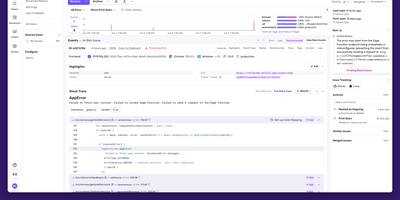
Sentry
Backed by 44,000 GitHub stars and trusted by over four million developers, Sentry is the debugging platform that captures errors, traces, replays, profiles, and metrics from your applications and connects them all through distributed tracing. The error tracking engine captures full stack traces with source context, breadcrumbs, and automatic demangling for native crashes, while intelligent grouping consolidates duplicate events into actionable issues with regression detection and automatic assignment. Performance monitoring instruments your frameworks automatically, capturing every database query, API call, cache hit, and queue operation as spans within distributed traces that flow across frontend, backend, and mobile boundaries. Session Replay produces video-like recordings of real user sessions showing DOM interactions, network requests, console messages, and errors on a synchronized timeline, with AI-powered summaries that describe what happened without watching the full replay. Continuous profiling captures CPU execution data at the function and line level for Node.js, Python, iOS, and Android, linking slow spans directly to the exact code responsible. Cron monitoring tracks scheduled jobs for failures, missed runs, and duration anomalies. The alerting engine fires notifications through Slack, PagerDuty, Opsgenie, and webhooks on new issues, regressions, error spikes, or when latency and crash-free session rate thresholds are crossed. Self-hosted deployment runs as a Docker Compose stack with PostgreSQL, ClickHouse, Kafka, Redis, and Relay. Running on a dedicated VPS on RepoCloud with guaranteed CPU, RAM, and SSD, full root SSH access, and a browser serial console. FSL licensed.
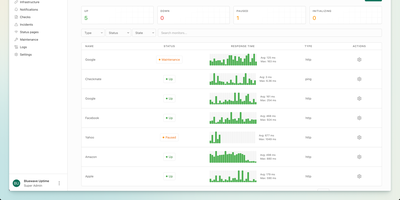
Checkmate
With 10,400 GitHub stars, 153 contributors, and no per-monitor pricing to worry about, Checkmate delivers comprehensive infrastructure monitoring from a single self-hosted dashboard — tracking uptime, page speed, server hardware, Docker containers, and even game servers without sending a byte of telemetry off your network. Ten monitor types cover HTTP, ping, TCP, gRPC, WebSocket, DNS, SSL certificate expiry, Docker container health, Lighthouse page speed with Core Web Vitals tracking, and game server status for over 100 server types including Minecraft and CS2. The Globalping integration enables geo-distributed monitoring from six continents, running ping and HTTP checks from Africa, Asia, Europe, North America, South America, and Oceania with results plotted on an interactive map. The optional Capture agent written in Go collects CPU, RAM, disk usage, temperature, and network metrics from any Linux, Windows, Mac, or Raspberry Pi host. Public status pages ship with four built-in themes and custom branding support, showing per-service uptime bars and incident history on a single shareable URL. Alert notifications reach teams through email, Discord, Slack, PagerDuty, Microsoft Teams, Telegram, Matrix, ntfy, Twilio SMS, and webhooks. Deploy via a single Docker Compose file requiring roughly 1 GB RAM — up and running in under five minutes on any Docker host. Running on a dedicated VPS on RepoCloud with guaranteed CPU, RAM, and SSD, full root SSH access, and a browser serial console. AGPLv3 licensed.
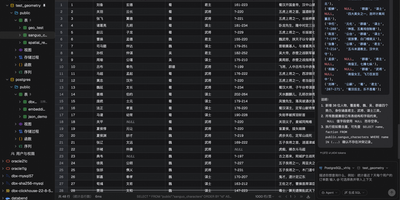
dbx
Universal database administration across modern enterprise infrastructure is simplified through dbx, a lightweight web client and SQL studio supporting over ninety database engines. Database administrators connect to MySQL, PostgreSQL, SQLite, Redis, MongoDB, ClickHouse, DuckDB, Oracle, and Microsoft SQL Server through authenticated network connections and encrypted SSH tunnels. The interactive query editor provides real-time multi-schema autocomplete, syntax linting, execution plan analysis, and natural language SQL query synthesis powered by configurable large language model backends. Teams visualize complex relational database architectures using interactive entity-relationship diagrams that map table foreign key constraints, primary indexes, and table partition layouts automatically. Operators inspect live Redis memory usage breakdowns, monitor real-time server command throughput, and manage key expirations without opening raw terminal sessions. The editable data grid supports multi-row modifications, foreign key reference lookups, CSV and JSON exports, and binary blob data inspection directly inside the browser viewport. Software developers expose connected databases directly to external AI coding assistants through native Model Context Protocol server endpoints. Running on a dedicated VPS on RepoCloud with guaranteed CPU, RAM, and SSD, full root SSH access, and a browser serial console. Apache-2.0 licensed.
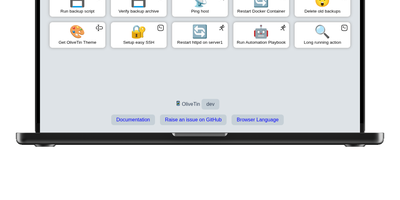
OliveTin
With over 3,600 GitHub stars and a philosophy of deliberate simplicity, OliveTin eliminates the need for SSH sessions, admin panels, and complex automation platforms by letting you define shell commands in a YAML config file and access them as clickable buttons through a clean browser interface. The Go binary consumes only a few megabytes of RAM, running on everything from tiny ARM and RISC-V devices through Linux VMs, containers, macOS, and Windows. Each button executes a predefined shell command with optional typed arguments that render as dropdowns, text fields, and validated inputs, preventing free-form command entry while giving users controlled access to server operations. Access control lists define exactly who can view or run each action — guests, family members, or junior administrators see only the buttons they are permitted to use. Entity templates generate actions dynamically from lists of hosts, containers, or other resources, creating one template that produces many buttons without manual duplication. Flexible triggers extend beyond browser clicks: cron schedules, webhooks, calendar file events, and filesystem watchers run actions automatically when conditions are met. Authentication supports OAuth2, JWT, and header-based methods for integration with reverse proxies and identity providers. Dashboards organize actions into folders and fieldsets for clear navigation across dozens of commands. No plugin system, no extension marketplace, no premium tiers — every feature ships in the single open-source release. Running on a dedicated VPS on RepoCloud with guaranteed CPU, RAM, and SSD, full root SSH access, and a browser serial console. AGPL-3.0 licensed.
Nimbus
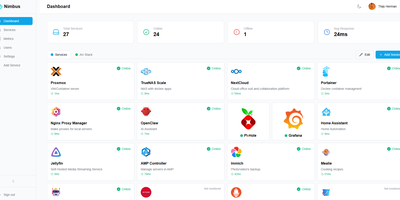
Nimbus is a self-hosted homelab dashboard that turns your scattered pile of services into a polished, organized command center with real-time health monitoring for every endpoint you care about. The dashboard displays live status cards for each registered service, tracking response times down to the millisecond and graphing uptime history so you can spot degradation before it becomes an outage. Health checks run on configurable intervals with smart self-signed certificate handling, meaning your internal services with self-issued TLS do not trigger false alarms. Multi-user support comes standard: local accounts authenticate via JWT, while OAuth2 integration with Google, GitHub, and Discord lets team members sign in with existing credentials. Role-based access control and a built-in admin panel give you granular authority over who sees what. Each user personalizes their view with custom backgrounds, light or dark mode, accent color themes, and drag-and-drop service tile arrangement. Services group into named categories and cards resize to fit your preferred layout, with both grid and list view modes available. Prometheus metrics export feeds your existing Grafana stack, and webhook notifications alert you instantly when a service goes offline. Custom service icons upload directly or auto-fetch from the Dashboard Icons collection. Zero-config Docker deployment gets you running in under 30 seconds with a single docker-compose command. Running on a dedicated VPS on RepoCloud with guaranteed CPU, RAM, and SSD, full root SSH access, and a browser serial console. AGPL-3.0 licensed.
GrowthBook
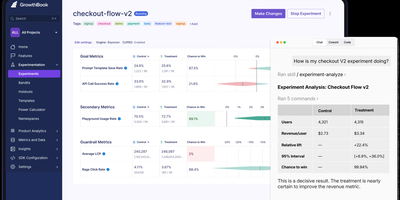
Used by over 3,000 organizations including Dropbox, Khan Academy, Sony, Pepsi, Wikipedia, and Mistral, GrowthBook is the open-source experimentation platform that handles over 100 billion feature flag evaluations daily across its cloud and self-hosted deployments. Feature flags support advanced targeting with user attributes, gradual percentage rollouts, prerequisite dependencies, and scheduled launches, with both client and server SDKs evaluating flags locally from a cached payload for sub-millisecond performance with zero network calls per check. The warehouse-native architecture queries experiment results directly from 11 data sources including BigQuery, Snowflake, Databricks, Redshift, ClickHouse, Mixpanel, and PostgreSQL, eliminating duplicate data pipelines. The statistics engine implements CUPED variance reduction, sequential testing, Bayesian analysis, post-stratification, multi-armed bandits, and sample ratio mismatch checks with fully open-source methodology. Product analytics provides dashboards with funnels, retention cohorts, and event-based tracking shareable across teams. Twenty-four SDKs cover React, Next.js, Node.js, Python, Go, Ruby, PHP, Java/Kotlin, Swift, C#/.NET, Rust, Elixir, Angular, and edge runtimes including Cloudflare Workers, Fastly Compute, and Lambda@Edge. The MCP server and REST API enable AI coding agents to create features, start experiments, and manage stale flags programmatically. Self-hosting deploys via Docker Compose with MongoDB, or via Helm charts on Kubernetes, with the same codebase powering both open-source and managed cloud offerings. Running on a dedicated VPS on RepoCloud with guaranteed CPU, RAM, and SSD, full root SSH access, and a browser serial console. MIT licensed.
Unkey
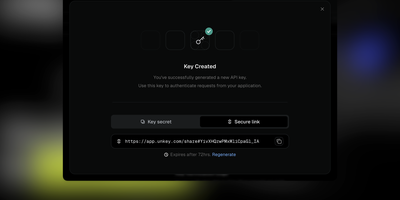
Unkey is the open-source platform that unifies API key management, rate limiting, deployment, and observability into a single control plane. The Go API service validates keys with sub-millisecond latency using regional Redis caches and MySQL 8.0 persistent storage, while ClickHouse captures every verification event for per-key and per-keyspace analytics with filterable time-series charts, request counters, and active key tracking. Keyspaces organize API keys by product, environment, or tier, each configurable with custom prefixes, byte lengths, IP whitelists, encrypted key recovery, and delete protection. Per-key settings include expiration dates, rate limit quotas with configurable windows, RBAC roles and permissions, owner identities linking multiple keys to a single user or organization, and key rotation with grace periods from immediate revocation through 24-hour overlap. The deployment pipeline connects GitHub repositories for automatic Docker container builds, generates preview environments per commit, promotes tested versions to production, and validates releases with OpenAPI diff detection flagging breaking changes before production. The edge gateway authenticates and rate-limits requests at the closest region before routing to the nearest API instance. Immutable audit logs track every key creation, verification, deletion, and configuration change with actor, timestamp, and event metadata. The CLI provides terminal access to key management, analytics queries, and deployment operations. On RepoCloud, deploy Unkey on a dedicated VPS with Docker, root SSH access, and complete control over your API infrastructure, all under the AGPL license.
Dagger
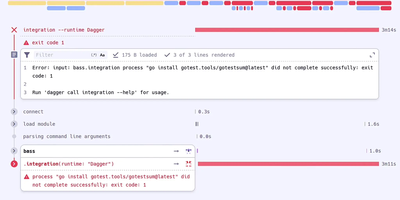
With 16,100 GitHub stars and created by Solomon Hykes (co-founder of Docker), Dagger eliminates proprietary YAML DSLs from CI/CD by letting developers write pipelines as real programs in their preferred language — then executing them identically on a laptop, in GitHub Actions, in GitLab CI, or on any machine with a container runtime. The BuildKit-based Dagger Engine runs every pipeline operation inside OCI containers, constructing a directed acyclic graph where each node is cached by default, parallelized automatically, and produces bit-for-bit reproducible outputs regardless of execution environment. Native SDKs generated from the GraphQL API schema provide Go, Python, TypeScript, PHP, Java, .NET, Elixir, and Rust developers with full type safety, IDE autocomplete, and the ability to unit-test CI pipelines using the same testing frameworks as application code. The module ecosystem enables cross-language composition where a Python team can invoke a Go team's build functions without learning Go, while filesystems, secrets, git repositories, and network tunnels are passed between functions as strongly-typed objects. Pipeline operations cache at container-layer granularity with content-addressed deduplication, and the interactive REPL enables step-by-step pipeline debugging with live container inspection. Host dependencies are explicit and strictly typed, eliminating implicit environment coupling that causes "works on my machine" failures. Running on a dedicated VPS on RepoCloud with guaranteed CPU, RAM, and SSD, full root SSH access, and a browser serial console. Apache 2.0 licensed.
ServerKit
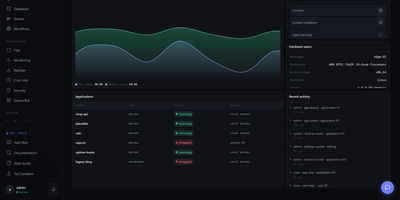
ServerKit delivers a server control panel that fits on a small VPS while managing everything from Docker containers to mail servers. The Python/Flask backend exposes 1,519 REST endpoints across 107 blueprints with full OpenAPI documentation at /api/v1/docs, while the React frontend spans 65 screens in a 1.75MB gzipped bundle served entirely from your own infrastructure. Docker management includes full container lifecycle control, Docker Compose project orchestration, real-time log streaming, and terminal access. Database panels cover MySQL/MariaDB and PostgreSQL with user management, browser-based query consoles, and automated backups to S3, Backblaze B2, or local storage. Nginx virtual host management automates Let's Encrypt certificate provisioning with hardened TLS 1.2+ configurations and Cloudflare-aware setups. The Go-based cross-platform agent enables multi-server fleet management with HMAC-SHA256 authentication over a WebSocket gateway, supporting Linux, Windows, and macOS across amd64 and ARM64 architectures. Fleet monitoring provides cross-server heatmaps, metric comparison charts, alert thresholds, anomaly detection, and capacity forecasting. A built-in marketplace distributes 106 one-click application templates using a declarative YAML schema with Docker Compose stacks. The extension system allows community plugins for Kubernetes management, Redis browsers, and WordPress site orchestration. Running on a dedicated VPS on RepoCloud with guaranteed CPU, RAM, and SSD, full root SSH access, and a browser serial console. MIT licensed.
Jaeger
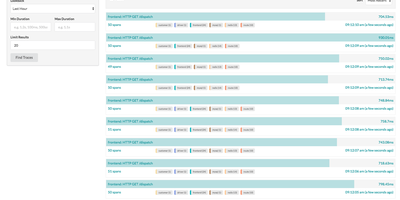
Created by Uber Technologies and graduated as the seventh CNCF top-level project in October 2019 with over 23,000 GitHub stars, Jaeger has become one of the most widely deployed open-source distributed tracing platforms, processing billions of spans per day in production environments at organizations including Uber, Red Hat, and Shopify. Version 2 rebuilt the platform on the OpenTelemetry Collector framework, inheriting its extensible pipeline architecture while implementing Jaeger-specific features as extensions and components, enabling seamless integration with the OpenTelemetry ecosystem through native OTLP protocol support. The platform stores traces in Cassandra 4.0+, Elasticsearch 7.x/8.x, OpenSearch 1.0+, ClickHouse, or the embedded Badger database for development setups. Three sampling strategies control trace volume: head-based sampling with constant, probabilistic, and rate-limiting modes, tail-based sampling using the OpenTelemetry Collector processor that evaluates complete traces before storage decisions, and adaptive sampling that dynamically adjusts probabilities based on observed traffic patterns. Service Performance Monitoring computes RED metrics directly from spans, displaying request rates, error rates, and latency percentiles in the Monitor tab with drill-down from aggregate service views to individual traces. The web UI provides trace search with multi-field filtering, trace detail views with span timeline visualization, trace comparison across services, and dependency graphs mapping service relationships from actual traffic. Deployment options range from a single all-in-one binary for development to distributed collector-ingester-query configurations with Kafka intermediate buffering for production scale. Running on a dedicated VPS on RepoCloud with guaranteed CPU, RAM, and SSD, full root SSH access, and a browser serial console. Apache 2.0 licensed.

Pipelock
Your AI coding agent has your API keys in its environment and unrestricted network access, which means one prompt injection away from sending those secrets anywhere. Pipelock closes that gap by sitting as a proxy between your agents and every outbound connection, scanning the actual content of HTTP, WebSocket, MCP, and Agent-to-Agent traffic before it leaves your server. An 11-layer scanner pipeline checks every request against 62 credential patterns covering AWS, GCP, Azure, GitHub, OpenAI, Anthropic, SSH keys, and database URLs, then inspects every response for prompt injection using 29 detection patterns with six-pass normalization that catches base64-encoded, leetspeak, and whitespace-obfuscated payloads. The MCP proxy wraps any Model Context Protocol server (stdio, HTTP, or WebSocket) with bidirectional scanning that detects tool description poisoning and mid-session rug-pull changes via SHA-256 fingerprinting. Every scanning decision produces a cryptographically signed action receipt that third parties can verify offline without trusting the agent or the vendor. The Operator Console provides a web dashboard for reviewing evidence scorecards, receipt timelines, agent sessions, enforcement decisions, and fleet posture at a glance. Cross-request taint tracking catches slow-drip exfiltration attempts that spread a secret across multiple calls. Canary tokens plant synthetic secrets that trip alerts the moment an agent tries to exfiltrate them. Pre-built Prometheus metrics and a Grafana dashboard provide real-time visibility into traffic volumes and block rates. Deploy on a dedicated VPS on RepoCloud with guaranteed CPU, RAM, and SSD, full root SSH access, and a browser serial console. Apache 2.0 licensed.
OpenRun
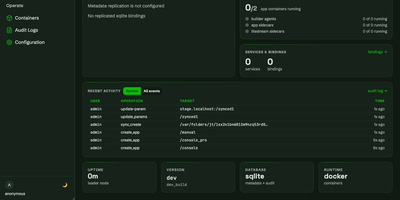
OpenRun replaces the patchwork of CI/CD pipelines, reverse proxies, and identity providers that teams typically assemble when deploying internal tools, offering declarative GitOps-based deployment of web applications to Docker, Podman, or Kubernetes from a single self-hosted Go binary. Point it at a Git repository and it builds containers from AppSpec templates, routes requests by domain or URL path, provisions TLS certificates automatically, and scales idle applications to zero when unused. Blue-green staged deployments promote new versions through development, staging, and production environments with atomic rollback across multiple apps simultaneously. Every deployed application inherits SSO authentication through OAuth, OpenID Connect, or SAML providers alongside role-based access control, all configured once at the platform level rather than per app. Service bindings provision isolated PostgreSQL, MySQL, SQLite, or Redis credentials for each application, while Litestream integration replicates SQLite databases to S3 for automatic disaster recovery. The management console provides a web interface for monitoring containers, reviewing audit logs, configuring syncs, and managing server operations. AppSpec templates handle Streamlit, Gradio, FastAPI, Flask, and FastHTML projects out of the box, deploying existing Python applications without requiring custom Dockerfiles. Running on a dedicated VPS on RepoCloud with guaranteed CPU, RAM, and SSD, full root SSH access, and a browser serial console. Apache-2.0 licensed.
OpenStatus
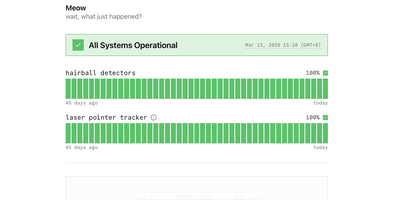
Trusted by Cal.com, WhiteBIT, and Documenso and backed by 8,800+ GitHub stars, OpenStatus delivers the open-source status page and uptime monitoring platform that replaces Atlassian Statuspage, Better Stack, and Instatus with a single self-hosted deployment. The monitoring engine runs Go-based probes across 28 global regions on three cloud providers checking HTTP, TCP, and DNS endpoints in parallel with configurable intervals and multi-region consensus to eliminate false-positive alerts. Status pages ship with custom domain support, password and email-domain access controls, maintenance windows, grouped monitor components, and subscriber notifications via email and RSS. Incident management provides structured status reports with investigating, identified, monitoring, and resolved timeline phases that publish automatically to affected status pages. The monitoring-as-code workflow supports YAML configuration synced through the CLI, a GitHub Actions integration for CI/CD pipelines, and a Terraform provider for infrastructure-as-code deployments. The typed ConnectRPC JSON-over-HTTP API exposes a published OpenAPI specification with a Node SDK for programmatic access, while an MCP server connects AI assistants like Claude, ChatGPT, and Cursor directly to workspace data. The tech stack combines Next.js with shadcn/ui for the dashboard, Hono for the API server, Drizzle ORM over Turso for application data, and Tinybird for analytics. Private monitoring locations deploy as a single 8.5MB Docker image behind firewalls to check internal services. Running on a dedicated VPS on RepoCloud with guaranteed CPU, RAM, and SSD, full root SSH access, and a browser serial console. AGPL-3.0 licensed.
1Panel
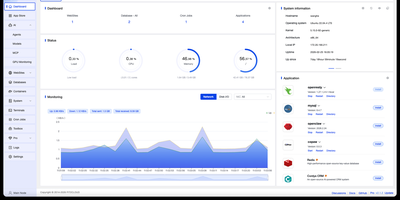
Backed by over 36,000 GitHub stars and 120 contributors with 123 releases since 2022, 1Panel has rapidly become the go-to open-source alternative to cPanel and Plesk for modern Linux server management. The platform delivers a clean Vue.js dashboard powered by a Go backend using the Gin framework, providing visual management of Docker containers, images, networks, and volumes without touching the command line. Its curated app marketplace offers one-click installation of 165+ trusted open-source applications including Nextcloud, Bitwarden, Umami analytics, WordPress, and NocoBase, each running in isolated containers for maximum security. Native AI capabilities set 1Panel apart from every competing panel: deploy Ollama LLMs directly from the dashboard, spin up OpenClaw personal agents, monitor GPU utilization, and manage AI models through a unified interface. Website management includes automatic domain binding, Let's Encrypt SSL certificate provisioning, and Nginx configuration with zero manual setup. Security runs deep with built-in firewall rules, fail2ban integration, container isolation, WAF protection, and comprehensive audit logging enabled from day one. Automated backups support AWS S3, Cloudflare R2, and local storage with one-click restore from any snapshot. The panel supports Debian, Ubuntu, CentOS, and Rocky Linux across x86_64, aarch64, armv7l, ppc64le, and s390x architectures. Running on a dedicated VPS on RepoCloud with guaranteed CPU, RAM, and SSD, full root SSH access, and a browser serial console. GPL-3.0 licensed.
Portabase
Portabase takes a zero-trust approach to database backups: lightweight Rust/Tokio agents deploy next to each database, encrypt dumps with AES-GCM before data ever leaves the host, and poll the Next.js control plane outbound every five seconds requiring zero inbound firewall rules. This architecture contains blast radius if the dashboard is compromised while supporting ten engines with stable backup and restore: PostgreSQL 12 through 18, MySQL 5.7 through 9, MariaDB 10 and 11, MongoDB 4 through 8, SQLite 3.x, Redis 2.8+, Valkey 7.2+, Firebird 3.0 through 5.0, Microsoft SQL Server 2017 through 2022 including Azure SQL, and Docker volumes on Engine 20.10+. Encrypted backups store on configurable backends including local filesystems, any S3-compatible provider (AWS, MinIO, RustFS), Google Cloud Storage, and Azure Blob Storage. Cron-based scheduling with Grandfather-Father-Son retention policies automates backup lifecycle management, while on-demand restore targets any compatible server for cross-environment recovery. The CLI installs agents with a single command and auto-updates when new versions ship. A RESTful API with MCP server integration enables automation from CI/CD pipelines and AI agent workflows. Developed by a non-profit under Apache-2.0. 1,270+ stars and 174 releases since October 2024. Running on a dedicated VPS on RepoCloud with guaranteed CPU, RAM, and SSD, full root SSH access, and a browser serial console.
Artifact Keeper
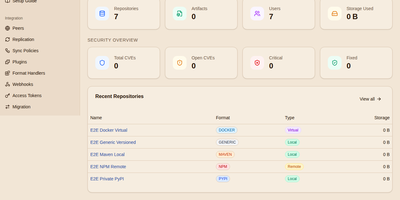
Artifact Keeper serves as a self-hosted universal software artifact repository that consolidates container images, application libraries, and infrastructure bundles under a unified management control plane. Software development teams can publish and resolve dependencies using their existing build tools, including Docker, Helm, npm, PyPI, Maven, Cargo, NuGet, and Terraform without installing proprietary client plugins. Remote repositories act as transparent pull-through caching proxies for public upstreams like Docker Hub and PyPI, accelerating internal CI/CD build speeds while insulating production pipelines from external registry outages. Virtual repositories combine multiple local, remote, and third-party endpoints into single URLs, resolving packages across prioritized internal teams and public registries automatically. Automated security scanners evaluate incoming packages for Common Vulnerabilities and Exposures using Trivy and Grype engines, assigning letter grades and enforcing quarantine policies to block vulnerable binaries before production release. Administrators can sign package metadata with cryptographic GPG keys, configure peer mesh replication across geographic regions, and manage team permissions using OpenID Connect, SAML, and granular access tokens. Running on a dedicated VPS on RepoCloud with guaranteed CPU, RAM, and SSD, full root SSH access, and a browser serial console. MIT licensed.
Maintenant
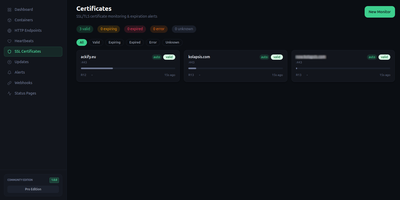
Maintenant replaces three to five separate monitoring tools with a single Go binary that consolidates container discovery, endpoint monitoring, SSL tracking, resource metrics, and public status pages without requiring any external database. The embedded Vue 3 frontend serves on port 8080 immediately after deployment, auto-discovering Docker containers and Kubernetes pods through direct socket and API access without configuration. HTTP and TCP endpoint monitoring validates availability with configurable intervals, while TLS certificate tracking alerts before expiration across all monitored domains. Resource metrics collect CPU, RAM, network throughput, and disk usage per container with real-time Server-Sent Events streaming to the dashboard. Heartbeat and cron monitoring accepts pings from external scheduled jobs, triggering alerts on missed check-ins via webhook callbacks and Discord notifications. The built-in alert engine supports escalation rules and notification batching. Public status pages expose component health to end users without authentication, customizable per monitored service. Network security insights analyze exposed ports, container privilege levels, and host configuration to produce a posture score. Update intelligence scans OCI registries to detect available container image updates with digest comparison. The REST API with SSE broker enables automation, and the integrated MCP server provides tooling for AI assistant integration. SQLite in WAL mode stores all data with zero operational overhead. Running on a dedicated VPS on RepoCloud with guaranteed CPU, RAM, and SSD, full root SSH access, and a browser serial console. AGPL-3.0 licensed.
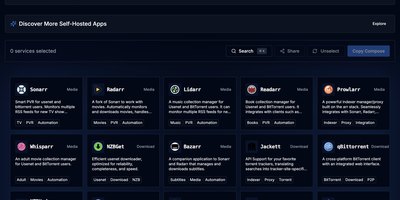
DCM
DCM is a visual builder that eliminates docker-compose copy-paste anxiety for home server enthusiasts. The TypeScript and Next.js web interface on port 7576 presents a curated catalog of popular self-hosted applications organized into categories: media management with Jellyfin, Plex, Sonarr, Radarr, and Prowlarr; dashboards like Homarr and Heimdall; databases including PostgreSQL, MariaDB, MongoDB, and Redis; monitoring stacks with Grafana and Prometheus; download clients like qBittorrent and NZBGet; security tools including Vaultwarden; storage solutions like Nextcloud; and home automation via Home Assistant. Select any combination of containers and DCM generates both compose.yaml and .env files with correct volume mounts, environment variables, PUID/PGID ownership, network modes, and port mappings — ready to paste into your terminal. Automatic port conflict detection identifies clashing services and reassigns ports before you ever hit a deployment error. The Template Gallery ships predefined multi-container stacks for common setups: media servers, development environments, database clusters, and monitoring solutions — some incorporating ten or more services in a single template. Built as a static Next.js export served from a 62 MB multi-arch Docker image supporting amd64, arm64, and arm/v7, DCM runs on everything from rack servers to Raspberry Pis. Share generated configurations via URL or download them locally. Running on a dedicated VPS on RepoCloud with guaranteed CPU, RAM, and SSD, full root SSH access, and a browser serial console. AGPL-3.0 licensed.