Stars
Forks
Watchers
Developer links
Nimbus
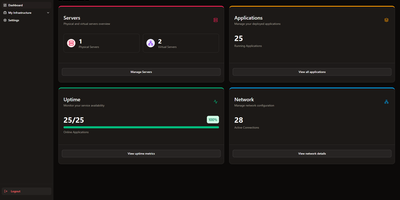
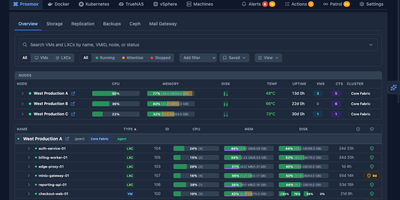
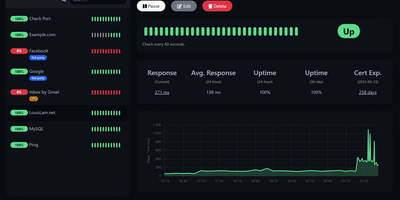
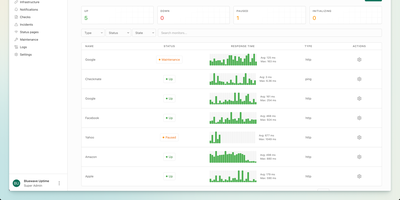
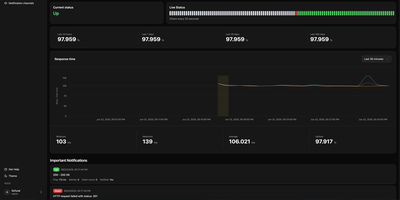
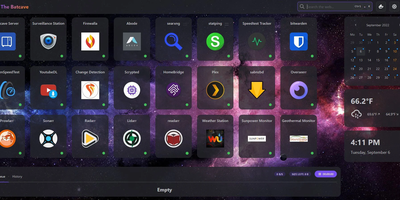
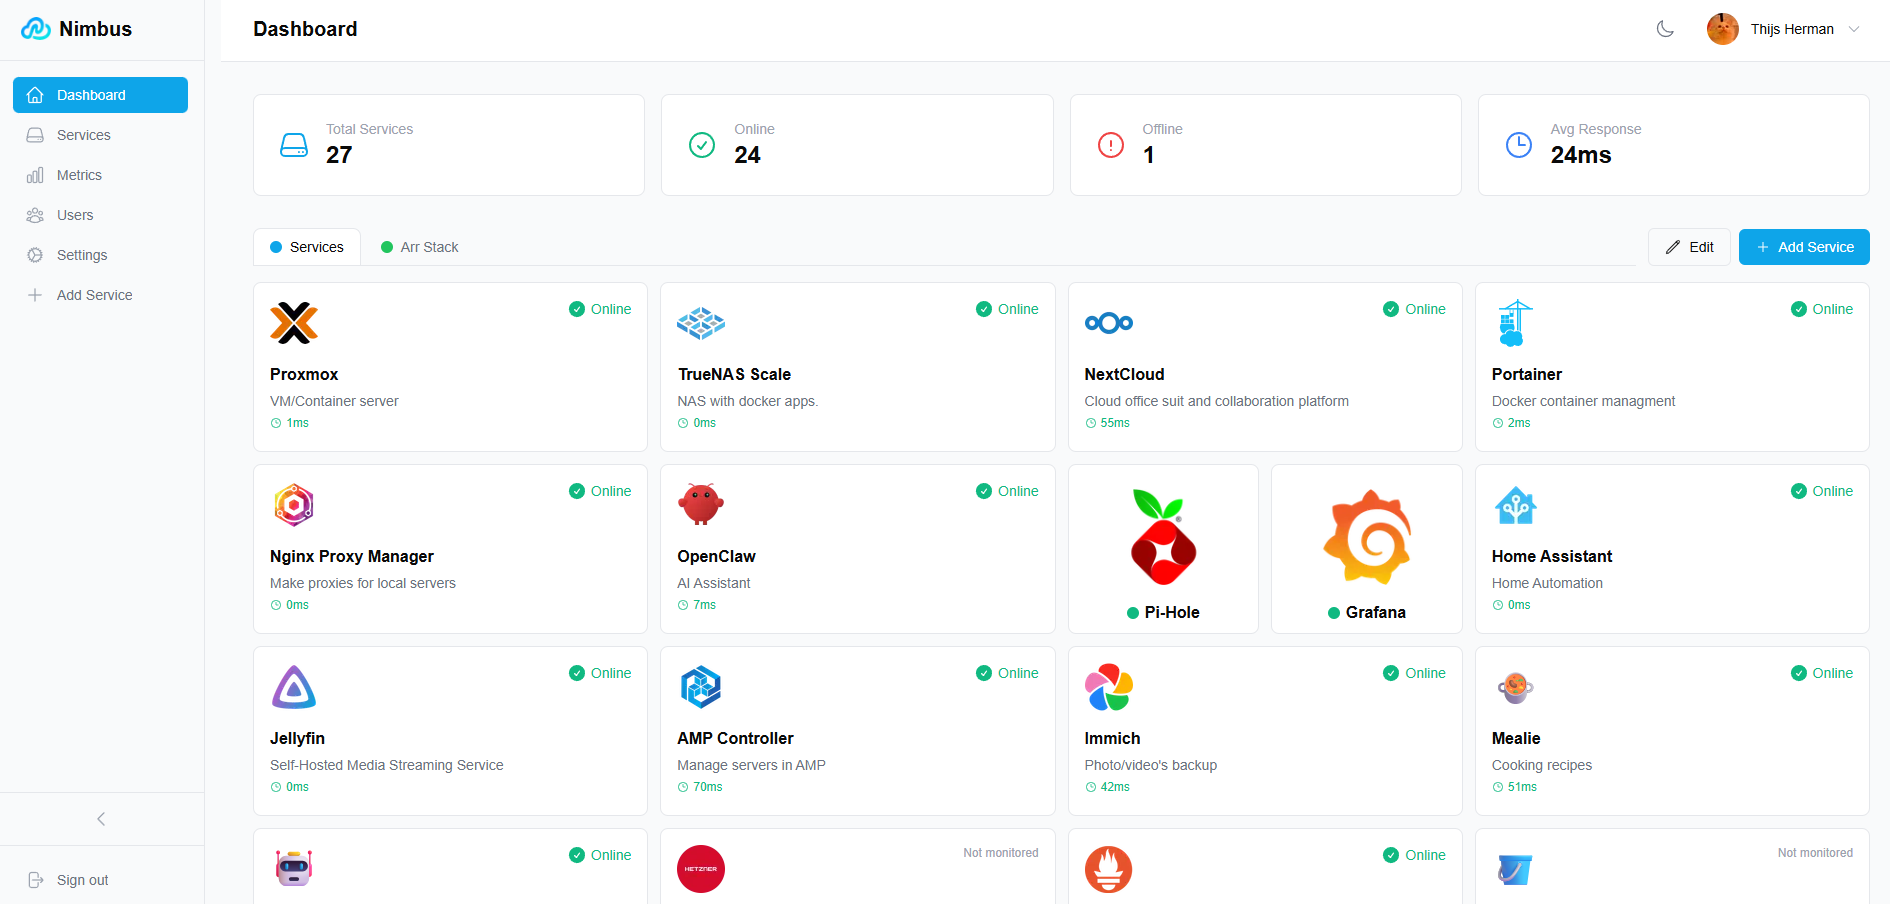
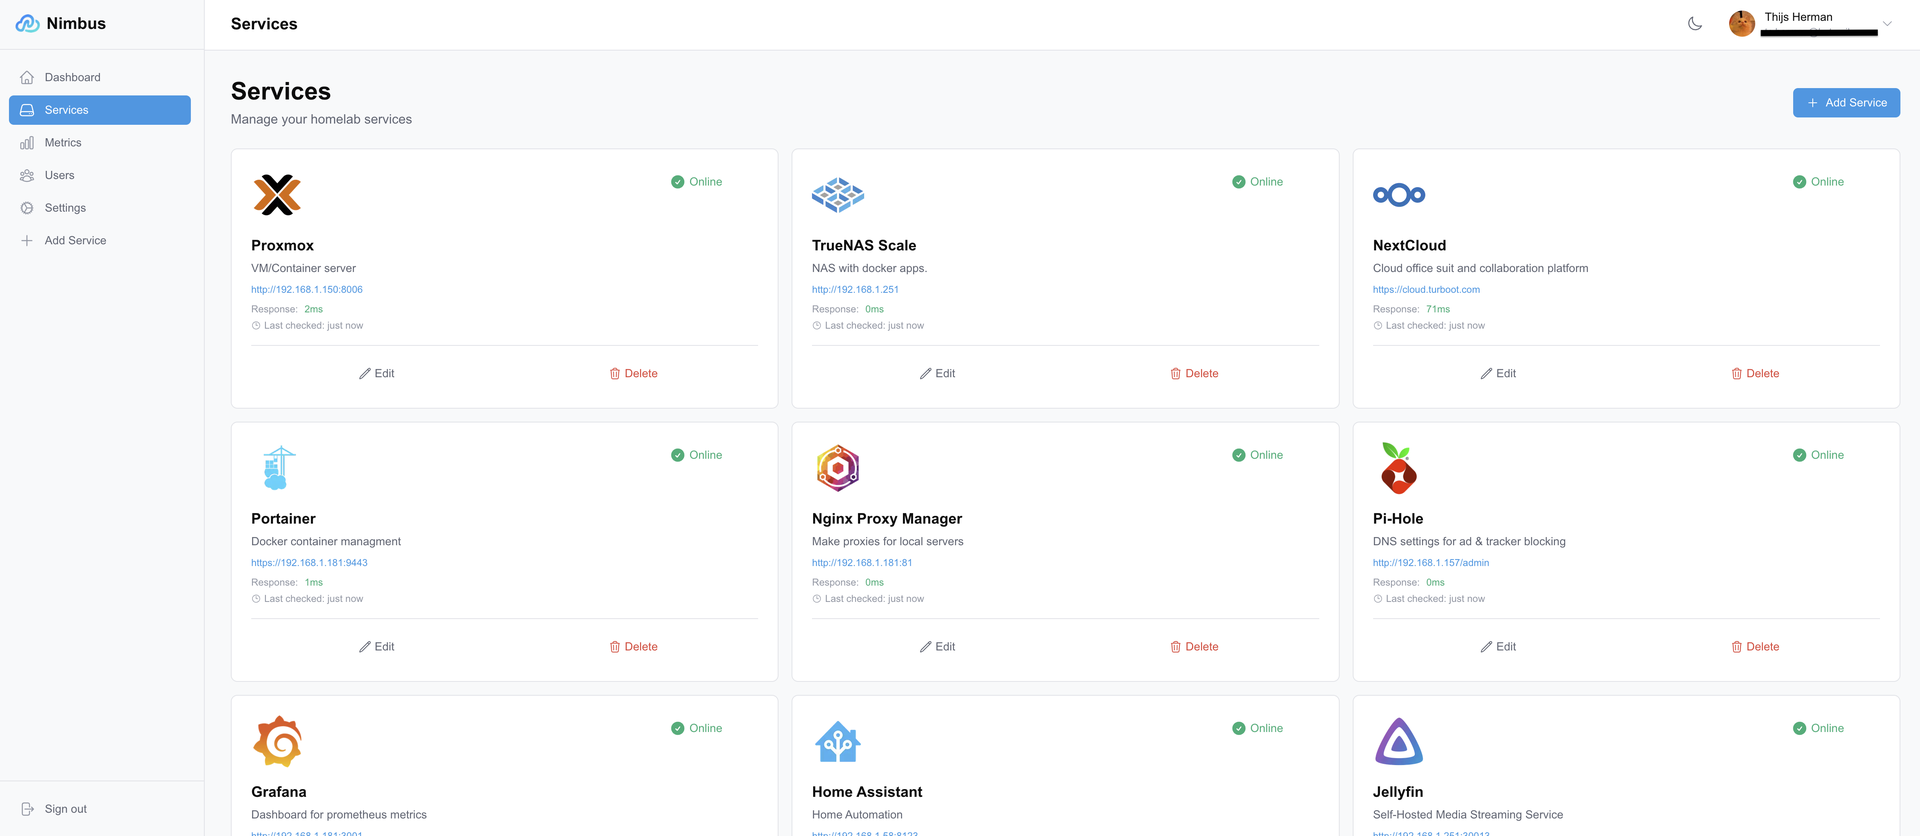
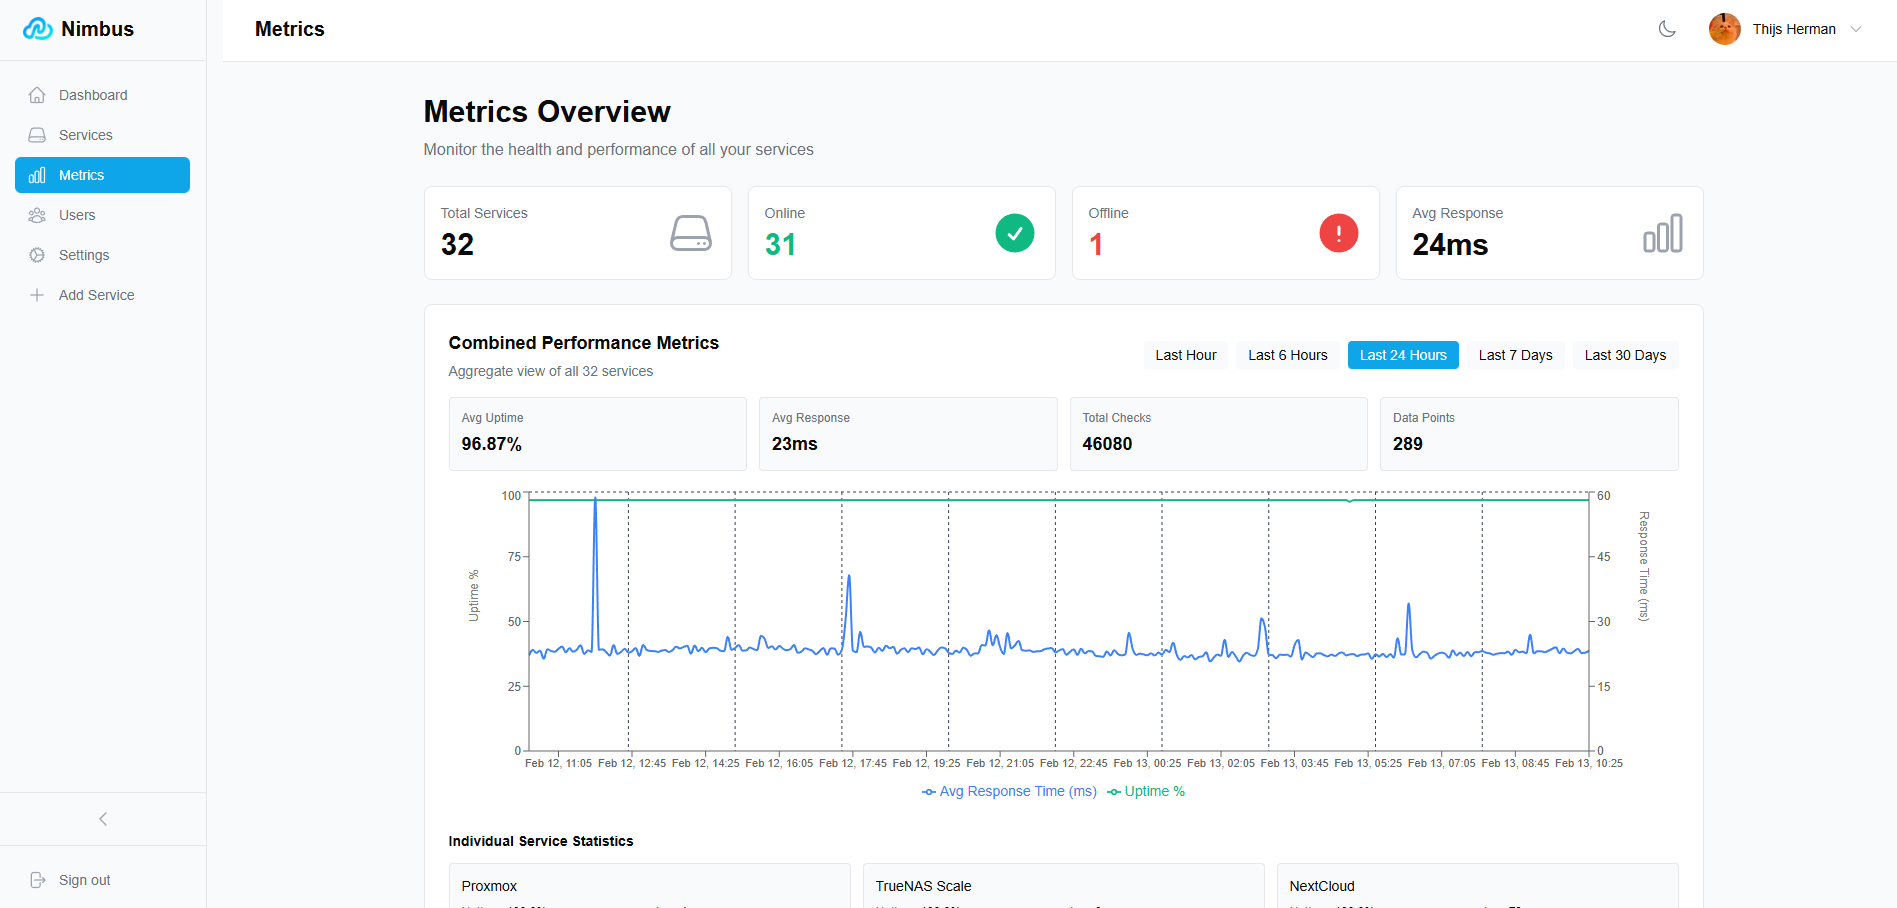
Nimbus is a self-hosted homelab dashboard that turns your scattered pile of services into a polished, organized command center with real-time health monitoring for every endpoint you care about. The dashboard displays live status cards for each registered service, tracking response times down to the millisecond and graphing uptime history so you can spot degradation before it becomes an outage. Health checks run on configurable intervals with smart self-signed certificate handling, meaning your internal services with self-issued TLS do not trigger false alarms. Multi-user support comes standard: local accounts authenticate via JWT, while OAuth2 integration with Google, GitHub, and Discord lets team members sign in with existing credentials. Role-based access control and a built-in admin panel give you granular authority over who sees what. Each user personalizes their view with custom backgrounds, light or dark mode, accent color themes, and drag-and-drop service tile arrangement. Services group into named categories and cards resize to fit your preferred layout, with both grid and list view modes available. Prometheus metrics export feeds your existing Grafana stack, and webhook notifications alert you instantly when a service goes offline. Custom service icons upload directly or auto-fetch from the Dashboard Icons collection. Zero-config Docker deployment gets you running in under 30 seconds with a single docker-compose command. Running on a dedicated VPS on RepoCloud with guaranteed CPU, RAM, and SSD, full root SSH access, and a browser serial console. AGPL-3.0 licensed.
Benefits
- Instant Health Visibility
- Real-time status cards display response times, uptime percentages, and status history graphs for every registered service, surfacing performance degradation before it escalates into downtime.
- Flexible Multi-User Access
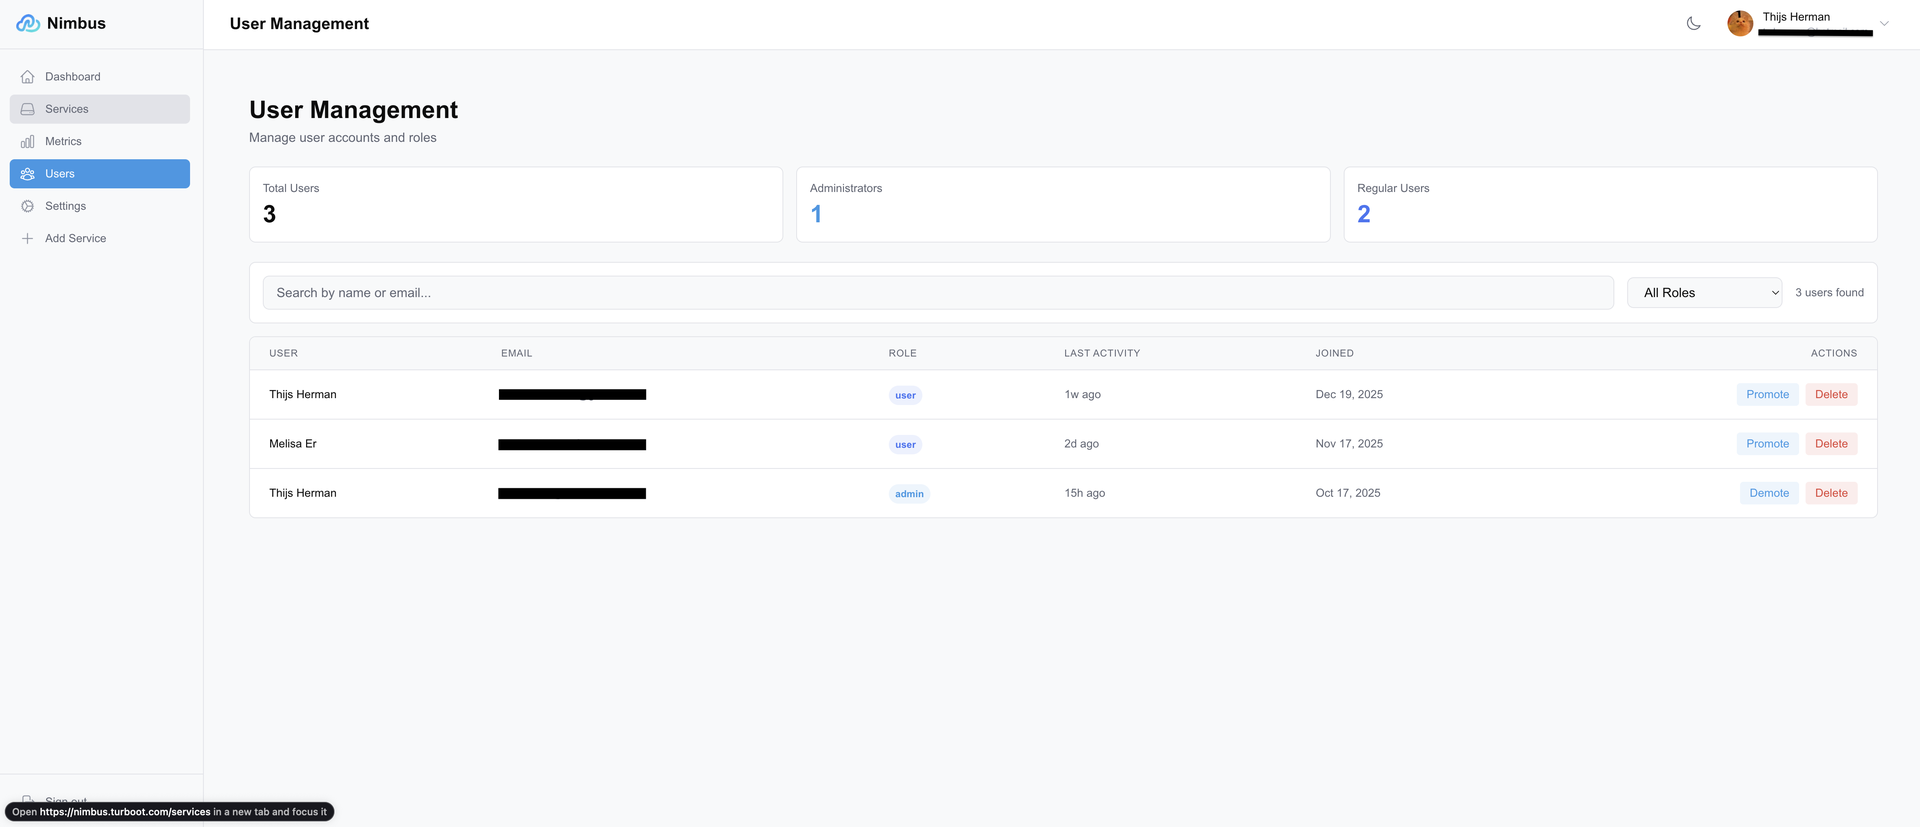
- Local JWT accounts and OAuth2 sign-in through Google, GitHub, and Discord combine with role-based access control so each team member sees only their authorized services.
- Fully Themeable Interface
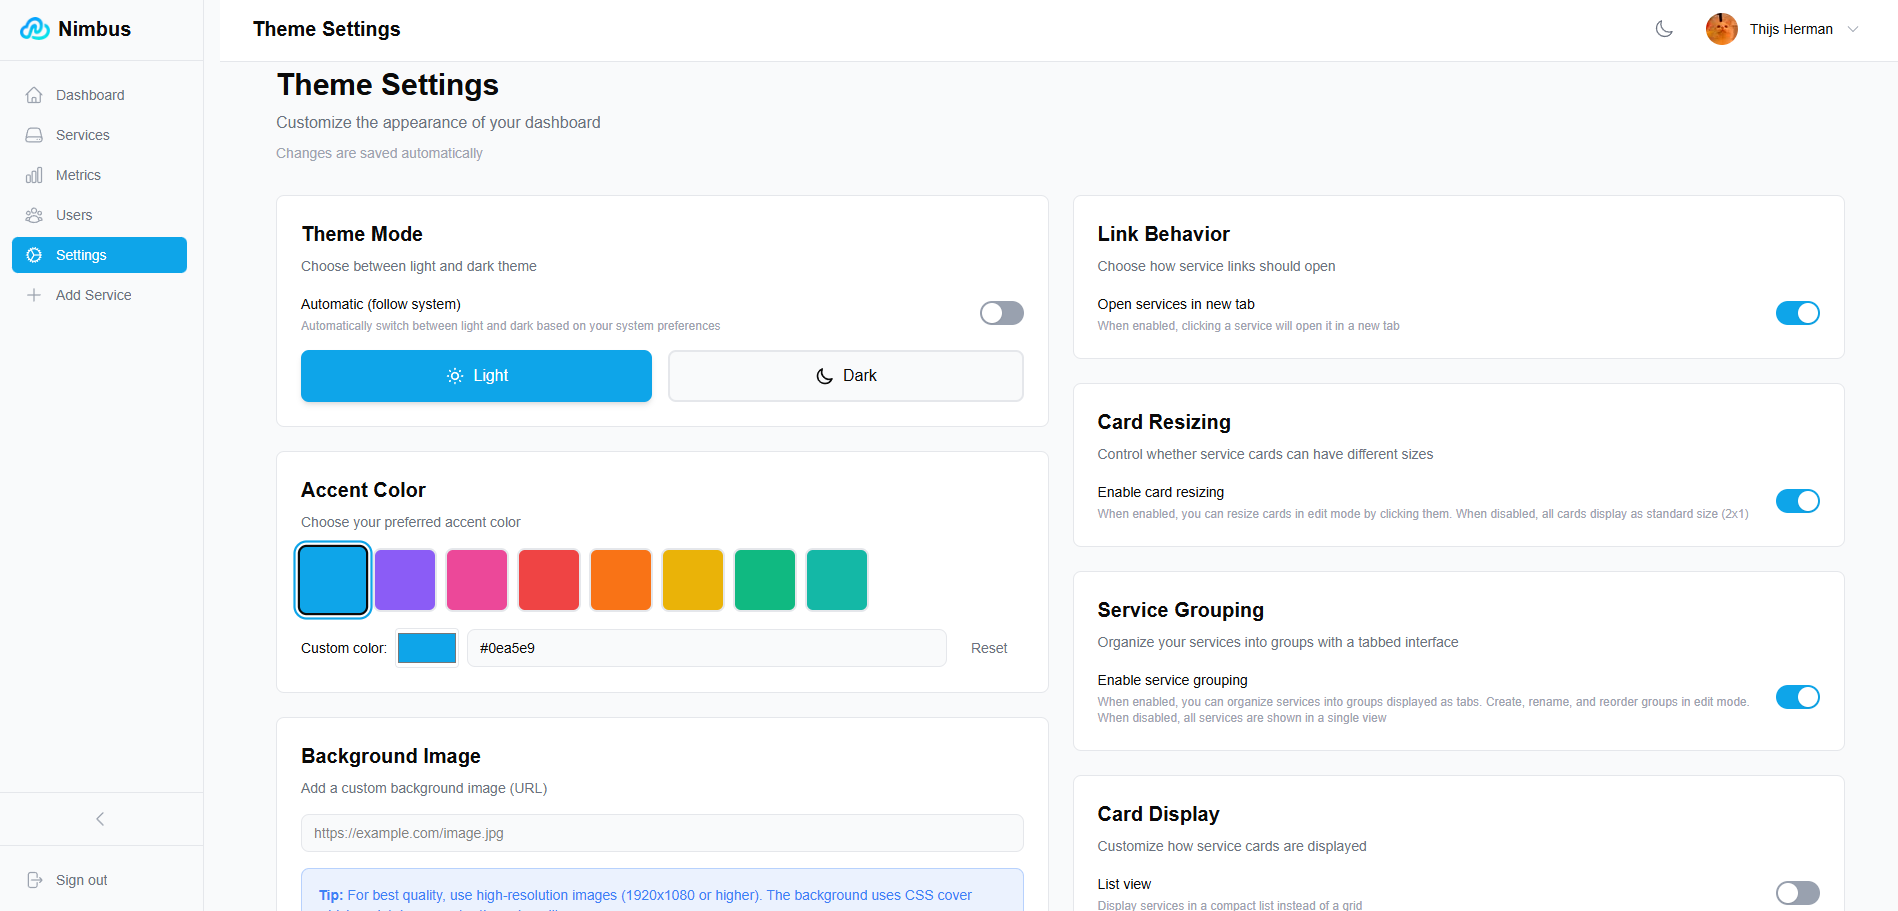
- Per-user custom backgrounds, accent color palettes, light and dark mode, drag-and-drop tile arrangement, and resizable cards let every operator personalize their dashboard layout.
- Zero-Config Docker Deployment
- A single docker-compose up command launches the entire stack with auto-generated secrets. Two optional environment variables cover database passwords and JWT secrets for production hardening.
Features
- Service Health Monitoring
- Runs configurable-interval health checks with response time tracking, self-signed certificate handling, and historical uptime graphs per service endpoint.
- OAuth2 Authentication
- Supports Google, GitHub, and Discord OAuth2 providers alongside local JWT accounts, with role-based access control and an admin user management panel.
- Prometheus Metrics Export
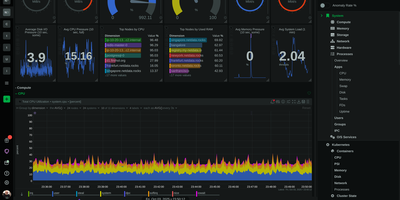
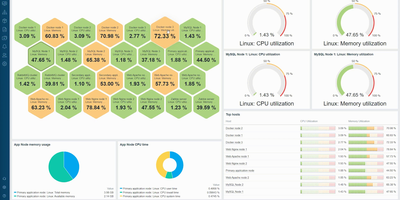
- Exposes service health data as Prometheus-compatible metrics for integration with Grafana dashboards and existing alerting pipelines.
- Customizable Tile Layout
- Drag-and-drop service tiles, resizable cards, named service groups, grid and list view modes, and auto-fetched icons from the Dashboard Icons collection.
- Webhook Notifications
- Sends uptime alerts via configurable webhooks when services go offline or recover, enabling integration with Slack, Discord, or custom notification endpoints.