VictoriaMetrics
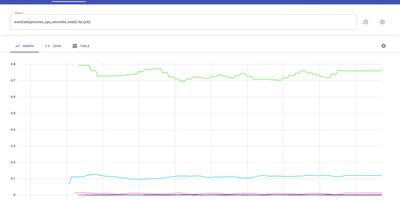
Trusted by thousands of organizations processing billions of time series data points and backed by 17,000+ GitHub stars, VictoriaMetrics delivers a monitoring and time series database that outperforms Prometheus by 16x on query speed while consuming 2.5x less disk space through its optimized compression and storage engine. The architecture supports both single-node deployments handling 10M+ active time series and a horizontally scalable cluster version with vminsert, vmstorage, and vmselect components providing multi-tenancy, replication, and independent namespace isolation. Data ingestion accepts both push protocols including InfluxDB line protocol, Graphite plaintext, OpenTSDB HTTP, CSV, and OpenTelemetry OTLP alongside pull-based Prometheus scraping and remote write, enabling drop-in replacement of existing monitoring stacks without reconfiguring exporters. MetricsQL extends standard PromQL with additional functions, subqueries, and implicit time range alignment while maintaining full backward compatibility with existing Prometheus alerts and Grafana dashboards. The vmalert component processes recording and alerting rules with Alertmanager integration, while vmbackup and vmrestore enable point-in-time snapshots to S3, GCS, and Azure Blob Storage. Stream aggregation operates as a StatsD alternative for pre-aggregating high-cardinality metrics before storage. NFS-compatible storage backends including Amazon EFS and Google Filestore allow shared persistent volumes across cluster nodes. Running on a dedicated VPS on RepoCloud with guaranteed CPU, RAM, and SSD, full root SSH access, and a browser serial console. Apache-2.0 licensed.
Beszel
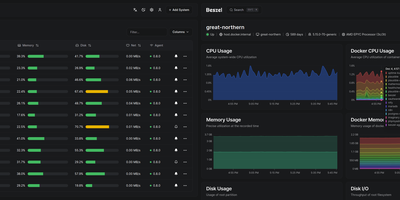
Reaching 24,000 GitHub stars within two years of its first commit in July 2024, Beszel delivers Netdata-grade monitoring dashboards from a single Docker container with no Prometheus stack, no external database, and no complex configuration — just a one-binary hub on PocketBase (SQLite embedded) and a sub-15 MB agent per host that auto-discovers Docker and Podman containers on contact. The agent connects outbound via WebSocket or SSH tunnel, requiring zero open ports on monitored servers and zero manual network configuration. Per-host metrics cover CPU usage, memory with swap and ZFS ARC breakdown, disk I/O across multiple partitions, network throughput, load average, sensor temperatures, battery charge, and GPU utilization with power draw for Nvidia, AMD, and Intel cards — features that competitors lock behind paid tiers. S.M.A.R.T. disk health including eMMC wear indicators and Linux mdraid array status surface hardware degradation before failures occur. Container statistics track CPU, memory, and network history per container with automatic discovery as new containers start. Configurable threshold alerts notify via email, Discord, Telegram, ntfy, Pushover, Gotify, Matrix, Mattermost, Signal, Slack, Microsoft Teams, and Twilio when metrics exceed defined limits. Multi-user accounts with OAuth/OIDC authentication let teams share monitored systems with role-based access, while automatic backups persist data to disk or S3-compatible storage. Running on a dedicated VPS on RepoCloud with guaranteed CPU, RAM, and SSD, full root SSH access, and a browser serial console. MIT licensed.
Gatus
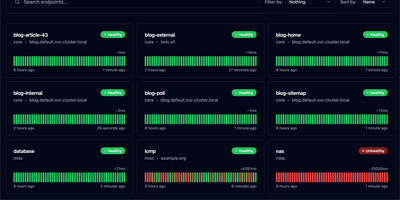
With 11,400+ GitHub stars and active development since 2019, Gatus is the developer-oriented status page and health monitoring tool that ships as a single statically-linked Go binary in a scratch Docker image under 20 MB — deploying in seconds while monitoring your entire infrastructure across 12 protocols from a single YAML configuration file. Define health checks for HTTP, ICMP, TCP, DNS, gRPC, WebSocket, SSH, UDP, SCTP, STARTTLS, and TLS endpoints with conditions that go far beyond simple ping: evaluate response status codes, body content with JSONPath expressions, response time thresholds, certificate expiration days, DNS record values, and IP address ranges. Each endpoint supports independent alerting through Slack, Microsoft Teams, PagerDuty, Discord, Telegram, Twilio, Mattermost, Google Chat, email, Gotify, Pushover, and custom webhook providers with configurable failure thresholds and descriptions. The built-in status page displays uptime badges, response time graphs, and incident timelines with maintenance window support for planned downtime communication. External endpoints accept push-based health reports from services behind firewalls. Prometheus metrics export via the /metrics endpoint enables integration with existing observability stacks. OIDC and Basic Authentication protect the dashboard. PostgreSQL persistence stores historical uptime data. The official Helm chart supports Kubernetes deployment with liveness probes and PVC storage, while a community sidecar auto-generates endpoint configurations from Kubernetes Ingress and HTTPRoute resources. Running on a dedicated VPS on RepoCloud with guaranteed CPU, RAM, and SSD, full root SSH access, and a browser serial console. Apache 2.0 licensed.
Argo CD
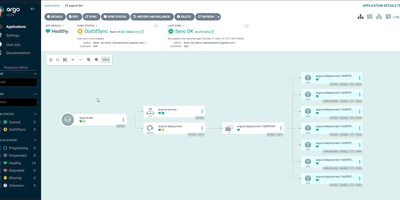
A CNCF Graduated project with over 23,700 GitHub stars and adoption by organizations including Intuit, Adobe, Capital One, and Red Hat, Argo CD has become the industry standard for GitOps-based Kubernetes deployments since its creation at Intuit in 2018, treating Git repositories as the single source of truth for application configurations and automatically reconciling live cluster state with declared desired state. The platform supports Helm charts including Helm 4, Kustomize overlays, Jsonnet, and plain Kubernetes YAML manifests, rendering templates and applying resources through configurable sync policies with automated or manual reconciliation, pruning of orphaned resources, and self-healing that reverts unauthorized cluster changes. ApplicationSets enable templated generation of applications across multiple clusters, environments, and Git repositories using generators for pull requests, Git directories, cluster lists, and merge strategies. The web UI provides a real-time application topology view with resource health status, sync state indicators, log streaming, and a network view supporting Gateway API and Ingress visualization. Version 3.5 introduced mTLS for internal component communication, graduated user impersonation and source hydrator to beta, added native ApplicationSet management with preview applications in the UI, and delivered source integrity validation. Multi-cluster management deploys applications across development, staging, and production environments from a single Argo CD instance with RBAC, SSO via OIDC and SAML, and audit logging. Running on a dedicated VPS on RepoCloud with guaranteed CPU, RAM, and SSD, full root SSH access, and a browser serial console. Apache 2.0 licensed.

RocketplaneIO
RocketplaneIO is a self-hosted AI SRE platform that gives Kubernetes clusters zero-instrumentation eBPF observability plus a copilot capable of safely diagnosing and fixing issues without your telemetry ever leaving your infrastructure. Point it at any cluster, and an eBPF DaemonSet starts capturing HTTP, gRPC, SQL, Redis, and Kafka spans across every service, including compiled binaries, with cross-service context propagation and no code changes required. The live service map draws itself from actual network traffic, matching technology logos from container images and coloring each node's health from RED metrics. Every log line sits two clicks from its parent distributed trace, and a PromQL query engine, embedded from the real Prometheus evaluator, runs over ClickHouse for long-term metric retention. The complete Kubernetes inventory (Services, Ingress, ConfigMaps, network policies, persistent volumes, CRDs) syncs continuously and is searchable alongside traces and logs. When the copilot identifies a problem, it picks from a catalog of roughly 30 risk-classified safe actions; each action verifies its preconditions, captures a before-state snapshot, executes, checks the result, and rolls back automatically on failure. Disruptive operations pause for explicit human approval before proceeding. An MCP endpoint exposes the identical guardrailed toolbox to external AI agents, so Claude Code or Cursor can operate the cluster through the same safety boundary the browser copilot uses. Complex remediations compose as searchable, forkable Starlark workflows that compile deterministically at save. Running on a dedicated VPS on RepoCloud with guaranteed CPU, RAM, and SSD, full root SSH access, and a browser serial console. Apache-2.0 licensed.
Headlamp
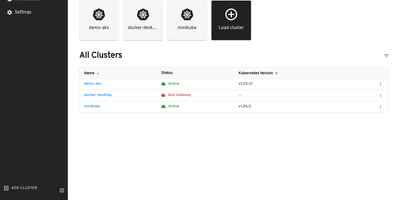
The Kubernetes project's own answer to cluster management UIs: maintained under SIG UI governance, Headlamp's roadmap tracks Kubernetes releases and its design philosophy reflects community needs rather than a vendor's product strategy. The React interface provides full read-write capabilities adapted to each user's RBAC permissions — delete, scale, edit, and restart buttons appear only when the authenticated user holds the corresponding cluster role, preventing accidental unauthorized actions. Multi-cluster support surfaces workloads across development, staging, and production from a single view without context switching. The plugin architecture drives extensibility through a curated catalog: an AI Assistant plugin answers natural-language cluster queries and performs operations via configurable LLM keys, Flux handles GitOps, Karpenter manages nodes. Integrated terminals provide browser-based exec access to running pods, live log streaming follows container output with filtering, and the YAML editor displays inline Kubernetes API documentation alongside resource definitions. Deployment creation forms let you configure containers, environment variables, volumes, and replicas without writing manifests. Side-by-side cluster comparison views surface differences in workload distribution. Works with any distribution: EKS, GKE, AKS, Minikube, Docker Desktop. Helm chart installation via the Headlamp repository with images on GitHub Container Registry. Running on a dedicated VPS on RepoCloud with guaranteed CPU, RAM, and SSD, full root SSH access, and a browser serial console. Apache-2.0 licensed.
Laminar
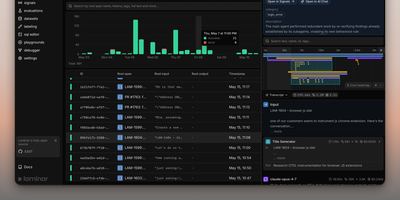
Backed by Y Combinator (S24) and processing traces from thousands of AI agents in production, Laminar is the open-source observability platform that treats agent debugging as a first-class engineering discipline rather than an afterthought. Its OpenTelemetry-native SDK auto-instruments Vercel AI SDK, LangChain, OpenAI, Anthropic, Gemini, Browser Use, Stagehand, Mastra, Pydantic AI, and the OpenAI Agents SDK with a single line of code, capturing every LLM turn, tool call, and sub-agent delegation as nested spans with full input/output data and token costs. The Signals engine lets you describe failures in plain language — "agent is stuck in a loop" or "tool returned empty results" — then reads every trace and alerts via Slack when it detects a match. A built-in debugger records runs and replays them from cache so each iteration takes seconds, designed for Claude Code, Cursor, or Codex to drive the repair loop via the MCP server or CLI. Run code-first evaluations in Python or TypeScript locally or in CI/CD pipelines, build datasets from production traces, and query everything with raw SQL through custom dashboards, the in-app editor, or your coding agent. The Rust backend delivers 20x trace compression, a custom real-time streaming engine, ultra-fast full-text search, and gRPC ingestion, while ClickHouse powers columnar analytics and PostgreSQL stores application state. Running on a dedicated VPS on RepoCloud with guaranteed CPU, RAM, and SSD, full root SSH access, and a browser serial console. Apache 2.0 licensed.
Semaphore
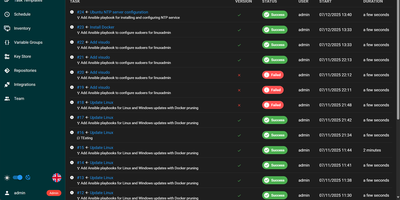
With nearly 14,000 GitHub stars and over 200 releases, Semaphore UI has established itself as the lightweight yet powerful alternative to enterprise automation platforms like Ansible AWX and Jenkins. Unlike AWX's heavyweight Kubernetes-dependent architecture, Semaphore ships as a single Go binary with zero external runtime dependencies — install it, run setup, and you have a production-ready automation server in minutes. The platform natively orchestrates Ansible playbooks, Terraform and OpenTofu infrastructure code, Terragrunt configurations, PowerShell scripts, Bash commands, and Python automation, all from a clean Vue.js web interface that displays task history, execution logs, and scheduling status at a glance. Semaphore supports concurrent task execution across multiple servers using distributed project runners, enabling horizontal scaling of automation workloads without complex clustering. The built-in inventory management system handles both static and dynamic inventory sources, while four-level RBAC (Owner, Manager, Task Runner, Guest) provides granular access control for team environments. Notifications flow to Slack, Microsoft Teams, Telegram, email, Rocket.Chat, and Gotify, keeping operators informed of failed tasks and deployment status. Integration with HashiCorp Vault secures sensitive credentials, and the comprehensive REST API with built-in Swagger documentation enables programmatic automation. Deploy via Docker Compose, Helm chart for Kubernetes, or native packages for Debian, Ubuntu, and RHEL-based distributions. Running on a dedicated VPS on RepoCloud with guaranteed CPU, RAM, and SSD, full root SSH access, and a browser serial console. MIT licensed.
Infisical
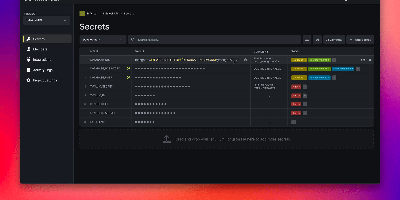
API keys hardcoded in repos, database passwords pasted into CI variables, .env files emailed between developers - Infisical, the open-source platform for secrets, certificates, and privileged access management, is the answer to all three. Secrets live in versioned stores scoped by project, environment, and path, with fine-grained identity-aware access control and full audit logging on every read and change. Delivery covers every consumption pattern: CLI injection into local dev, SDKs for Go, Node.js, and Python, an HTTP API, agents, a Kubernetes Operator, and secret syncs that push to GitHub, GitLab, AWS Secrets Manager, and Vercel. Automatic rotation replaces credentials for PostgreSQL, MySQL, MSSQL, LDAP, AWS IAM, and Azure on a rolling schedule - new credentials issue while old ones stay temporarily valid, so nothing breaks mid-rotation. Dynamic secrets go further, generating ephemeral, time-bound database credentials on demand, and SSH access replaces static keys with short-lived CA-signed certificates that expire automatically. Secrets scanning catches hardcoded credentials in code and pipelines, certificate management automates X.509 issuance and renewal, and a built-in KMS handles encrypt/decrypt with central key control. Self-hosting keeps the keys to everything else on your own infrastructure.
Runtipi
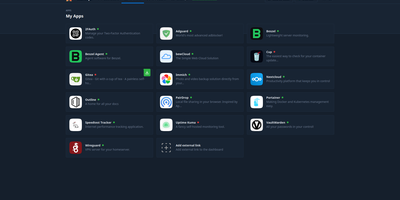
Runtipi makes any Linux server a personal app platform where installing services like Plex, Nextcloud, or Home Assistant takes a single click from a curated store of 265+ applications. With 9,500+ GitHub stars and 50 contributors, the React frontend backed by NestJS orchestrates Docker Compose projects for each installed app, automatically generating environment files, compose configurations, and Traefik reverse proxy labels for domain routing and SSL certificate provisioning via Let's Encrypt. The integrated Traefik reverse proxy handles all incoming traffic routing, HTTPS termination, and forward-auth protection for securing applications behind Runtipi's authentication layer without manual configuration. One-click updates notify administrators of new app versions and apply container image upgrades with automatic pre-update backup creation, while the restore feature rolls back application data to any saved snapshot. Custom app stores extend the ecosystem through Git repositories following the Runtipi app definition format, enabling organizations and communities to maintain private catalogs alongside the official store. The Docker Compose override system preserves user customizations across updates, allowing advanced modifications without losing changes. Architecture-aware filtering detects ARM64 or x86 platforms and displays only compatible applications. All apps deploy as standard Docker containers, and compose files can be exported for independent operation without lock-in. Running on a dedicated VPS on RepoCloud with guaranteed CPU, RAM, and SSD, full root SSH access, and a browser serial console. GPL-3.0 licensed.
phpMyAdmin
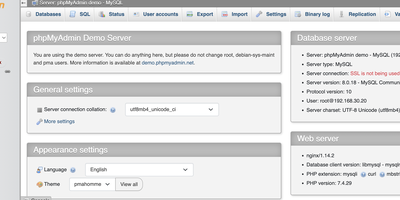
Since 1998, phpMyAdmin has been the standard web interface for MySQL and MariaDB - the tool millions of developers, DBAs, and hosting companies reach for when a database needs inspecting, fixing, or migrating. Written in PHP, it covers effectively the entire administration surface: create, browse, alter, and drop databases, tables, views, columns, and indexes; insert and edit rows through a tabular editor; manage user accounts and granular privileges; and maintain stored procedures, triggers, and events - all without touching a command line. The SQL editor executes arbitrary queries with syntax highlighting, autocompletion, history, and bookmarkable statements, including batch queries. Import/export is a migration workhorse: read SQL, CSV, XML, and OpenDocument spreadsheets in; write out to SQL dumps, CSV, JSON, XML, PDF, Word, LaTeX, and more - the fastest path for moving a WordPress database or handing a schema to a colleague. The Designer view renders your schema as an interactive ER diagram with drag-and-drop relationship editing, and data transformations display BLOBs as images or download links inline. Server maintenance views surface configuration suggestions. Multi-server support, dark mode, and translations into 72 languages round out a tool that earns its ubiquity. GPL-licensed.
GoAccess
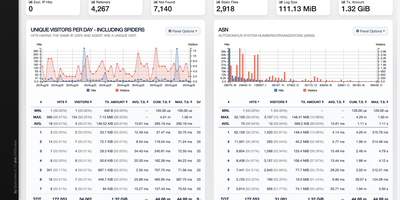
GoAccess processes millions of web log entries in seconds and renders the results as interactive dashboards that update every 200 milliseconds in the terminal or every second via WebSocket-connected HTML reports. Written entirely in C with only ncurses as a dependency, it achieves exceptional performance even on resource-constrained servers, reducing memory usage by approximately 20% and parsing time by 35% in recent releases through optimized in-memory hash tables with on-disk persistence support. The analyzer parses virtually every web log format out of the box (Apache Combined and Common, Nginx, Amazon CloudFront, Amazon S3, AWS Elastic Load Balancing, Google Cloud Storage, Squid, W3C IIS, Caddy JSON, and Traefik) while supporting fully custom log format strings for non-standard configurations. The self-contained HTML dashboard displays 15+ interactive panels covering unique visitors, requested files, static files, 404 errors, referring sites, search keyphrases, geographic location with city-level GeoIP resolution, operating systems, browsers, HTTP status codes, time distribution, and virtual host metrics. WebSocket authentication via JWT provides secure remote access, and incremental log processing ensures data continuity across daemon restarts. Docker deployment requires a single command with volume-mapped access logs. Over 20,800 stars with active development since 2010. Running on a dedicated VPS on RepoCloud with guaranteed CPU, RAM, and SSD, full root SSH access, and a browser serial console. MIT licensed.
Open Code Review
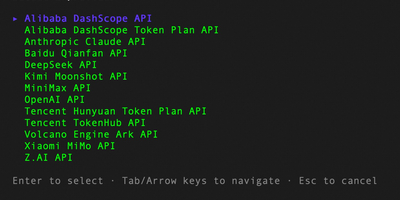
Originated as Alibaba Group's official internal AI code review assistant serving tens of thousands of developers and identifying millions of code defects over two years before open-sourcing in May 2026 — now at 21,000+ GitHub stars — Open Code Review is the production-hardened platform that proves enterprise-grade code review can be fully open-source under Apache 2.0. The hybrid architecture separates deterministic engineering pipelines (file selection, diff parsing, rule matching for NPE, thread-safety, XSS, and SQL injection across 10+ languages) from LLM-powered agent reasoning with tool-use capabilities including FileRead, CodeSearch, and cross-file context inspection, consuming approximately one-ninth the tokens of general-purpose coding agents while delivering line-level precise comments with severity and confidence scoring. The bundled web dashboard (port 4173) provides review management, findings triage, result browsing, and direct GitHub posting without external dependencies, while the session viewer (port 5483) renders full LLM request/response traces for debugging and auditing. Integration spans GitHub Actions, GitLab CI, GitFlic CI, and Gerrit with delegation mode enabling Claude Code, Cursor, and other AI agents to leverage OCR's engineering logic alongside their own LLM reasoning. Supports OpenAI, Anthropic, Google Gemini, DeepSeek via built-in providers plus Ollama and vLLM for air-gapped deployments. Running on a dedicated VPS on RepoCloud with guaranteed CPU, RAM, and SSD, full root SSH access, and a browser serial console. Apache 2.0 licensed.
Sentry
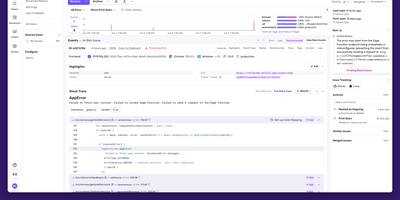
Backed by 44,000 GitHub stars and trusted by over four million developers, Sentry is the debugging platform that captures errors, traces, replays, profiles, and metrics from your applications and connects them all through distributed tracing. The error tracking engine captures full stack traces with source context, breadcrumbs, and automatic demangling for native crashes, while intelligent grouping consolidates duplicate events into actionable issues with regression detection and automatic assignment. Performance monitoring instruments your frameworks automatically, capturing every database query, API call, cache hit, and queue operation as spans within distributed traces that flow across frontend, backend, and mobile boundaries. Session Replay produces video-like recordings of real user sessions showing DOM interactions, network requests, console messages, and errors on a synchronized timeline, with AI-powered summaries that describe what happened without watching the full replay. Continuous profiling captures CPU execution data at the function and line level for Node.js, Python, iOS, and Android, linking slow spans directly to the exact code responsible. Cron monitoring tracks scheduled jobs for failures, missed runs, and duration anomalies. The alerting engine fires notifications through Slack, PagerDuty, Opsgenie, and webhooks on new issues, regressions, error spikes, or when latency and crash-free session rate thresholds are crossed. Self-hosted deployment runs as a Docker Compose stack with PostgreSQL, ClickHouse, Kafka, Redis, and Relay. Running on a dedicated VPS on RepoCloud with guaranteed CPU, RAM, and SSD, full root SSH access, and a browser serial console. FSL licensed.
Checkmate
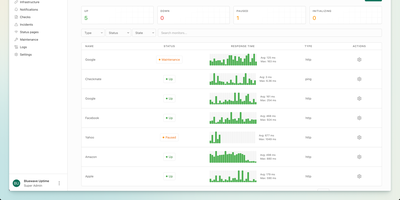
With 10,400 GitHub stars, 153 contributors, and no per-monitor pricing to worry about, Checkmate delivers comprehensive infrastructure monitoring from a single self-hosted dashboard — tracking uptime, page speed, server hardware, Docker containers, and even game servers without sending a byte of telemetry off your network. Ten monitor types cover HTTP, ping, TCP, gRPC, WebSocket, DNS, SSL certificate expiry, Docker container health, Lighthouse page speed with Core Web Vitals tracking, and game server status for over 100 server types including Minecraft and CS2. The Globalping integration enables geo-distributed monitoring from six continents, running ping and HTTP checks from Africa, Asia, Europe, North America, South America, and Oceania with results plotted on an interactive map. The optional Capture agent written in Go collects CPU, RAM, disk usage, temperature, and network metrics from any Linux, Windows, Mac, or Raspberry Pi host. Public status pages ship with four built-in themes and custom branding support, showing per-service uptime bars and incident history on a single shareable URL. Alert notifications reach teams through email, Discord, Slack, PagerDuty, Microsoft Teams, Telegram, Matrix, ntfy, Twilio SMS, and webhooks. Deploy via a single Docker Compose file requiring roughly 1 GB RAM — up and running in under five minutes on any Docker host. Running on a dedicated VPS on RepoCloud with guaranteed CPU, RAM, and SSD, full root SSH access, and a browser serial console. AGPLv3 licensed.
dbx
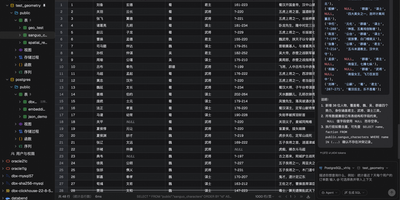
Universal database administration across modern enterprise infrastructure is simplified through dbx, a lightweight web client and SQL studio supporting over ninety database engines. Database administrators connect to MySQL, PostgreSQL, SQLite, Redis, MongoDB, ClickHouse, DuckDB, Oracle, and Microsoft SQL Server through authenticated network connections and encrypted SSH tunnels. The interactive query editor provides real-time multi-schema autocomplete, syntax linting, execution plan analysis, and natural language SQL query synthesis powered by configurable large language model backends. Teams visualize complex relational database architectures using interactive entity-relationship diagrams that map table foreign key constraints, primary indexes, and table partition layouts automatically. Operators inspect live Redis memory usage breakdowns, monitor real-time server command throughput, and manage key expirations without opening raw terminal sessions. The editable data grid supports multi-row modifications, foreign key reference lookups, CSV and JSON exports, and binary blob data inspection directly inside the browser viewport. Software developers expose connected databases directly to external AI coding assistants through native Model Context Protocol server endpoints. Running on a dedicated VPS on RepoCloud with guaranteed CPU, RAM, and SSD, full root SSH access, and a browser serial console. Apache-2.0 licensed.
OliveTin
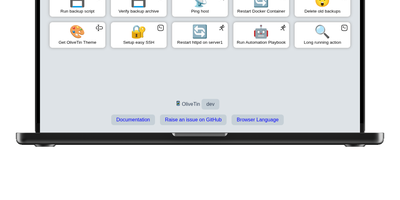
With over 3,600 GitHub stars and a philosophy of deliberate simplicity, OliveTin eliminates the need for SSH sessions, admin panels, and complex automation platforms by letting you define shell commands in a YAML config file and access them as clickable buttons through a clean browser interface. The Go binary consumes only a few megabytes of RAM, running on everything from tiny ARM and RISC-V devices through Linux VMs, containers, macOS, and Windows. Each button executes a predefined shell command with optional typed arguments that render as dropdowns, text fields, and validated inputs, preventing free-form command entry while giving users controlled access to server operations. Access control lists define exactly who can view or run each action — guests, family members, or junior administrators see only the buttons they are permitted to use. Entity templates generate actions dynamically from lists of hosts, containers, or other resources, creating one template that produces many buttons without manual duplication. Flexible triggers extend beyond browser clicks: cron schedules, webhooks, calendar file events, and filesystem watchers run actions automatically when conditions are met. Authentication supports OAuth2, JWT, and header-based methods for integration with reverse proxies and identity providers. Dashboards organize actions into folders and fieldsets for clear navigation across dozens of commands. No plugin system, no extension marketplace, no premium tiers — every feature ships in the single open-source release. Running on a dedicated VPS on RepoCloud with guaranteed CPU, RAM, and SSD, full root SSH access, and a browser serial console. AGPL-3.0 licensed.
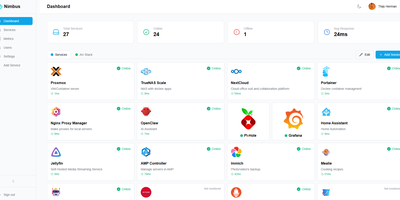
Nimbus
Nimbus is a self-hosted homelab dashboard that turns your scattered pile of services into a polished, organized command center with real-time health monitoring for every endpoint you care about. The dashboard displays live status cards for each registered service, tracking response times down to the millisecond and graphing uptime history so you can spot degradation before it becomes an outage. Health checks run on configurable intervals with smart self-signed certificate handling, meaning your internal services with self-issued TLS do not trigger false alarms. Multi-user support comes standard: local accounts authenticate via JWT, while OAuth2 integration with Google, GitHub, and Discord lets team members sign in with existing credentials. Role-based access control and a built-in admin panel give you granular authority over who sees what. Each user personalizes their view with custom backgrounds, light or dark mode, accent color themes, and drag-and-drop service tile arrangement. Services group into named categories and cards resize to fit your preferred layout, with both grid and list view modes available. Prometheus metrics export feeds your existing Grafana stack, and webhook notifications alert you instantly when a service goes offline. Custom service icons upload directly or auto-fetch from the Dashboard Icons collection. Zero-config Docker deployment gets you running in under 30 seconds with a single docker-compose command. Running on a dedicated VPS on RepoCloud with guaranteed CPU, RAM, and SSD, full root SSH access, and a browser serial console. AGPL-3.0 licensed.