FounderOS
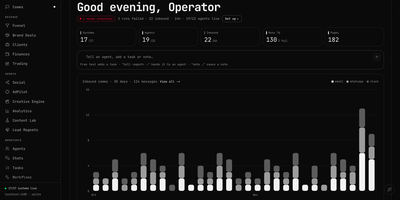
For a solo founder, FounderOS is one live dashboard where AI-assisted departments take care of the busywork of running a company. Home shows system health, agent counts, and inbound message volume, plus a free-text bar that turns a sentence into a task, a note, or an instruction for a named agent. Comms merges email, Slack, WhatsApp, and meeting threads into one inbox with unread counts, needs-reply flags, snooze, mark done, and reply starters that include a drafted answer. Funnel tracks touches, new leads, conversions, and revenue by source, with a pipeline from first touch to converted client. Agents shows a roster of AI seats and a conductor that delegates work, with runs by seat, open task lanes, and the items waiting on you. Tasks adds in-progress, overdue, and runtime stats beside a schedule. The Knowledge Visualizer maps notes, skills, agents, and accounts into a network with matrix, timeline, ranking, and findings views. Clients, Brand Deals, Finances, Social, and Content Lab sit in the same sidebar, and every integration stays optional until you connect it. A bundled demo company makes exploring easy. Creators, small agencies, and one-person businesses get a daily operating view in a single tab. Running on a dedicated VPS on RepoCloud with guaranteed CPU, RAM, and SSD, full root SSH access, and a browser serial console. MIT licensed.
Komari
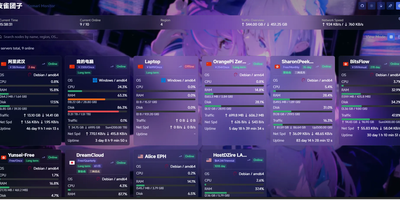
Komari turns a scattered fleet of VPS boxes into one clean status wall that shows which servers are alive, struggling, or about to expire. Every node reports CPU, GPU, memory, swap, disk, load, network speed, traffic totals, and uptime to a real-time dashboard, with history views from ten minutes to thirty days or any custom range. Flip between a card grid and a table, search by name, region, or operating system, and tag each machine with its price, billing cycle, and days until renewal. Latency tasks send ICMP, TCP, or HTTP probes and plot the results in per-node charts. Offline alerts wait out a per-node grace period before firing, expiry reminders warn before a plan lapses, and Webhook and custom JavaScript channels deliver them. A multi-tab browser terminal that reattaches after disconnects, remote command execution, and a remote file manager with an editor let you fix problems without leaving the panel. Agents install with a script, a binary, Docker, or an auto-discovery key for batch rollouts, and administrators can switch an agent's version remotely. Plugins run on an embedded JavaScript runtime and can add scheduled jobs, HTTP hooks, static pages, and notification channels. Administrators can add two-factor authentication, OAuth sign-in, API keys for a JSON-RPC 2.0 endpoint, themes from a theme market, and backups. Running on a dedicated VPS on RepoCloud with guaranteed CPU, RAM, and SSD, full root SSH access, and a browser serial console. MIT licensed.
Heimdall
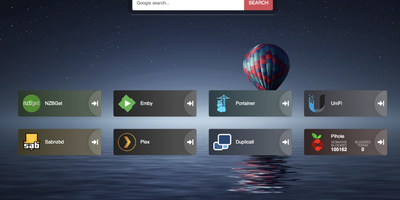
Links stop drowning in browser bookmarks once Heimdall - the application dashboard from the LinuxServer.io team - gives every web app and service you run a single, organized front door. Items come in three tiers. Generic items link to anything on the web with a name, color, and optional icon. Foundation apps are recognized as you type, auto-filling the application's icon and tile color so a full homelab dashboard assembles in minutes. Enhanced apps go further: supply API credentials and the tile shows live data - queue size and download speed for SABnzbd and NZBGet, plus integrations for Sonarr, Radarr, Plex, Jellyfin, Pi-hole, Portainer, Transmission, and many more. There are no iframes and no apps-within-apps; tiles are honest links with real-time stats layered on. Tiles arrange by drag and drop, backgrounds are customizable, an optional search bar (Google, Bing, or DuckDuckGo) makes it work as a browser start page, and optional multi-user authentication keeps dashboards personal. Built on Laravel with SQLite file-based storage - no external database - it stays light, responsive on mobile, and simple to back up. A natural first deployment: the page that ties every other self-hosted service together.
Neko Master
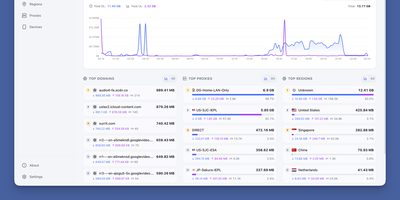
Neko Master watches every connection flowing through your Clash, Mihomo, or Surge gateway and turns the stream into a live map of devices, domains, countries, and proxy nodes, so questions that once needed packet captures get answered at a glance. The dashboard refreshes over WebSocket as traffic moves, charting upload and download trends across thirty minutes, one hour, or a full day. Domain views rank every host your network contacts by traffic and connection count, and IP views add ASN and geographic detail, so an unfamiliar endpoint explains itself instead of raising an alarm. Proxy statistics break traffic down per node and per rule, which makes a saturated exit, a misrouted application, or an underused subscription obvious in seconds. One panel watches several gateways at once: add OpenClash backends directly, or install the one-command agent on OpenWrt, Linux, or macOS machines beside remote gateways and let each agent report home. Because agents open the connection outward, gateways behind NAT still report in, and the panel never reaches into your network uninvited. History persists in SQLite by default, and busy networks can dual-write traffic statistics to ClickHouse for larger histories while configuration stays in SQLite. Token-based access control protects the dashboard, dark mode and an installable PWA keep it comfortable on a phone, and the interface switches between English and Chinese. Running on a dedicated VPS on RepoCloud with guaranteed CPU, RAM, and SSD, full root SSH access, and a browser serial console. MIT licensed.
Headlamp
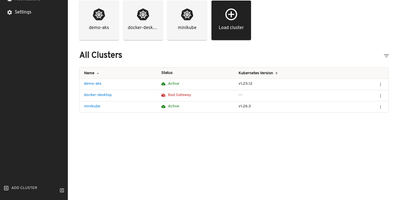
The Kubernetes project's own answer to cluster management UIs: maintained under SIG UI governance, Headlamp's roadmap tracks Kubernetes releases and its design philosophy reflects community needs rather than a vendor's product strategy. The React interface provides full read-write capabilities adapted to each user's RBAC permissions — delete, scale, edit, and restart buttons appear only when the authenticated user holds the corresponding cluster role, preventing accidental unauthorized actions. Multi-cluster support surfaces workloads across development, staging, and production from a single view without context switching. The plugin architecture drives extensibility through a curated catalog: an AI Assistant plugin answers natural-language cluster queries and performs operations via configurable LLM keys, Flux handles GitOps, Karpenter manages nodes. Integrated terminals provide browser-based exec access to running pods, live log streaming follows container output with filtering, and the YAML editor displays inline Kubernetes API documentation alongside resource definitions. Deployment creation forms let you configure containers, environment variables, volumes, and replicas without writing manifests. Side-by-side cluster comparison views surface differences in workload distribution. Works with any distribution: EKS, GKE, AKS, Minikube, Docker Desktop. Helm chart installation via the Headlamp repository with images on GitHub Container Registry. Running on a dedicated VPS on RepoCloud with guaranteed CPU, RAM, and SSD, full root SSH access, and a browser serial console. Apache-2.0 licensed.
Malloy Publisher
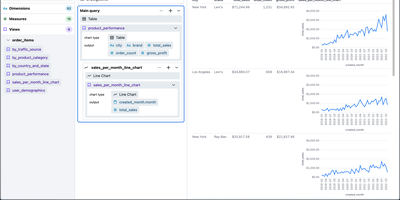
Analytics teams, and increasingly the AI agents working beside them, get one shared definition of the business from Malloy Publisher instead of a pile of SQL queries that each compute revenue slightly differently. You model what your data means once: the sources, the joins, the measures, and who may see what. Agents then compose queries against that model over MCP, so there is no wrong join, no invented column, and no fan-out that double-counts while looking plausible, and the same question returns the same numbers tomorrow. Applications and BI tools reach the same model over REST, and unattended agents use the same governed path instead of scraping raw tables. Reports declared in Malloy read top to bottom or lay out as tile grids you can build by dragging, no-build HTML data apps ship inside the package, and the built-in Console lets anyone browse environments, packages, models, and results without writing code. Access rules decide who may query and which rows they see, discovery curation decides what is even visible, and a single annotation materializes an expensive source or pre-aggregates it on a schedule. Local files work through built-in DuckDB, while BigQuery, Snowflake, Postgres, Databricks, and others connect when the data already lives there. Running on a dedicated VPS on RepoCloud with guaranteed CPU, RAM, and SSD, full root SSH access, and a browser serial console. MIT licensed.
Depictio
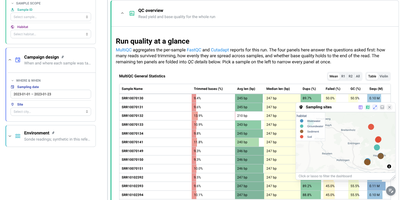
For teams drowning in pipeline output nobody reads, Depictio turns workflow results into dashboards you can hand to a collaborator. A MultiQC tab answers the first questions about a sequencing run: how many reads survived trimming, how evenly they spread across samples, and whether base quality holds to the end of the read, all in one glanceable table. Filter by sample, habitat, site, or sampling date on the left and every panel on the page follows, from community composition cards counting distinct taxa and phyla to differential abundance views that show what was tested, what survives correction, and how large the effects are. Alpha diversity tabs summarise richness and evenness per sample with rarefaction curves, and a sampling sites map lets you click or lasso points to filter the whole dashboard by geography. Forty two ready-made templates cover nf-core pipelines such as ampliseq, atacseq, and airrflow, while outputs from Nextflow, Snakemake, Galaxy, or plain shell scripts feed the same builder. Even a classic tabular dataset becomes an overview of distributions, box plots, and threshold counts, so the same tool serves a wet lab and a data science team. Running on a dedicated VPS on RepoCloud with guaranteed CPU, RAM, and SSD, full root SSH access, and a browser serial console. MIT licensed.
Tick Stock Panel
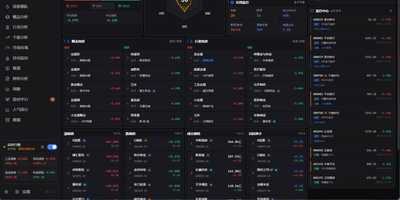
Screen equities against dozens of technical indicators, backtest algorithmic trading strategies, and spot intraday market anomalies using Tick Stock Panel, a self-hosted quantitative analysis workbench. Traders can filter entire exchanges across technical indicators including moving averages, relative strength index, and Bollinger bands with near-instantaneous execution. The platform provides a full backtesting environment where users test customized entry and exit rules, account for simulated slippage and commission fees, and review streamed performance metrics. Dedicated monitoring modules track intraday volume spikes, price breakouts, and multi-day limit streaks with automated alert dispatching to messaging channels and voice announcements. Users can explore individual stock profiles featuring multi-dimensional technical breakdowns, financial balance sheets, and automated event post-mortems generated via integrated language models. Visual factor mining tools allow analysts to discover uncorrelated signals and assemble composite portfolio screens without external database overhead. An interactive dashboard aggregates sector rotations, hot concept heatmaps, and customizable watchlists into modular operational views. Running on a dedicated VPS on RepoCloud with guaranteed CPU, RAM, and SSD, full root SSH access, and a browser serial console. MIT licensed.
Homepage
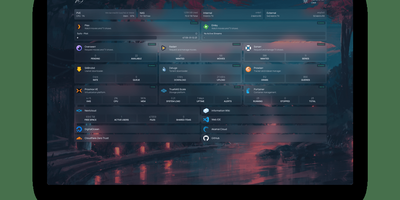
With over 31,000 GitHub stars and 430 contributors, Homepage has become the definitive self-hosted dashboard for homelab enthusiasts and server administrators who want a single, elegant landing page for all their services. The dashboard renders as a fully static site at build time for instant page loads, while a Node.js backend securely proxies all API requests to prevent exposing service credentials to the browser. Docker integration automatically discovers running containers through label-based configuration, populating the dashboard with service status indicators, health checks, and real-time statistics without manual URL entry. Over 100 native service widgets display live data from popular applications including Plex, Jellyfin, Radarr, Sonarr, Home Assistant, Pi-hole, Portainer, Proxmox, Nextcloud, Gitea, and dozens more, each showing relevant metrics like active streams, download queues, or system health directly on the dashboard. Information widgets provide weather forecasts, system resource utilization, search bars, and date/time displays. The layout system supports multiple columns, tabs, and custom CSS for pixel-perfect arrangement of service groups and bookmarks. Built-in authentication options include OIDC integration and password protection. Quick search functionality enables instant access to bookmarks and services with keyboard shortcuts. Internationalization covers 40+ languages with community-maintained translations. Configuration lives entirely in YAML files for version-controlled, reproducible dashboard setups. Deploy on a dedicated VPS on RepoCloud with guaranteed CPU, RAM, and SSD, full root SSH access, and a browser serial console for complete control. GPL-3.0 licensed with an active community and bi-weekly releases.
Statlite
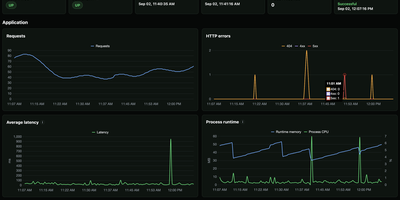
Small server, small monitoring. Statlite watches your applications and their host with a single binary that idles at about 15 MiB, so the observer never becomes the heaviest thing on the box. Point it at a Spring Boot Actuator endpoint and it polls health plus a fixed, curated set of Micrometer metrics: request traffic, latency, CPU, and runtime memory, all drawn as clean charts. Quarkus, Micronaut, and anything else that can answer a fixed JSON metrics profile can join the same dashboard. History lives in one local SQLite file, raw samples only, kept for 90 days by default, so yesterday's latency spike is still there when you go looking. The dashboard also watches the host itself: processor load, memory pressure, and filesystem capacity, including a warning before the metrics database fills its own disk. Restart detection tells you when an application bounced, and per-target Basic Auth support lets you poll protected Actuator endpoints safely. Configuration is one YAML file listing your targets and polling interval, friendly to systemd and Docker alike. Everything is deliberately scoped: no alert manager, no external service, no observability platform to operate. Just open the page and see whether your apps are healthy. Running on a dedicated VPS on RepoCloud with guaranteed CPU, RAM, and SSD, full root SSH access, and a browser serial console. MIT licensed.
metacubexd
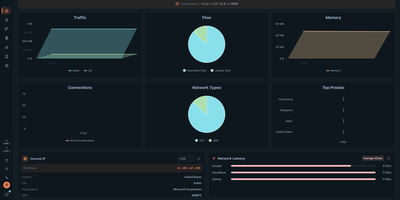
metacubexd gives your Mihomo proxy kernel a proper control room in the browser, from live traffic graphs to a full YAML profile editor. Real-time panels show upload and download speed, totals, active connections, memory use, and the busiest proxies, plus your current exit IP and latency to Google, Cloudflare, and GitHub. Proxy groups appear as cards with per-node latency bars, so switching a selector or running a latency test takes one click. Every connection is listed with its host, process, matched rule chain, and traffic, and can be closed or exported to CSV or JSON. Rules are searchable and filterable by type, and individual rules can be toggled on or off. Live logs stream by level, ready to search or download. With the all-in-one server image, you can also create profiles, import subscriptions by URL, edit configuration with schema-aware completion, validate it, and restart the kernel from the same page. Thirty-two themes, custom CSS, keyboard shortcuts, a responsive mobile layout, and seven interface languages make it comfortable to use anywhere. Running on a dedicated VPS on RepoCloud with guaranteed CPU, RAM, and SSD, full root SSH access, and a browser serial console. MIT licensed.
Apache StreamPipes
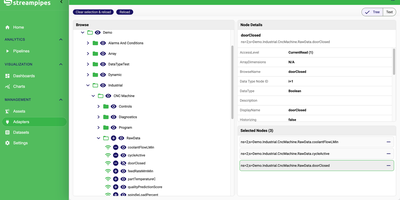
On the factory floor, the data already exists; it is just locked inside machines, PLCs, and protocols nobody on the analytics team speaks. StreamPipes unlocks it with guided adapters for OPC UA (including a web-based node browser), MQTT, Kafka, Pulsar, REST services, and industrial controllers, turning each source into a live stream in minutes. Domain experts then drag those streams into the pipeline editor, chain processors and sinks on a canvas, and watch connection validation check schema compatibility as they build, with live preview showing real values before anything is saved. Pipelines filter, enrich, aggregate, and route machine data, raise alerts, and write results to the built-in time-series data lake, where the data explorer charts history and spots trends. Finished pipelines run under an overview that starts, stops, and bulk-manages them, while detail views expose logs, metrics, status, and the pipeline as code. Live dashboards carry the same data to shop-floor screens and operations centers, organized around assets so a line, a cell, or a single machine becomes the navigation unit. Developers extend everything with custom adapters, processors, and sinks built on the Java SDK and deployed as microservices, or drive the platform from Python, Go, and Java clients. Running on a dedicated VPS on RepoCloud with guaranteed CPU, RAM, and SSD, full root SSH access, and a browser serial console. Apache-2.0 licensed.
QBitWebUI
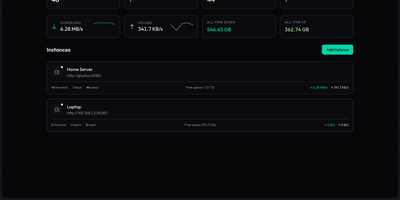
QBitWebUI is a single self-hosted dashboard that manages every qBittorrent instance you run, whether that is one seedbox or five, from one place. Instance cards show each client's status, live speeds, and torrent counts, with aggregate statistics across all of them and quick switching between instances. The torrent list brings sortable, resizable columns you can reorder and hide, filters for status, category, tag, and tracker, multi-select bulk actions with a context menu, and a details panel covering trackers, peers, files, and web seeds. Search your Prowlarr indexers from inside the UI and send results straight to the right instance, then let RSS feeds with regex auto-download rules keep recurring releases flowing in unattended. Browse the downloads directory and pull finished files or whole folders as tar archives, run an automatic cross-seed pass to match torrents across trackers, and check the connection with the network agent's speedtest, IP check, and DNS diagnostics. Edit qBittorrent preferences directly from the settings tabs, pick a color theme, and keep working from your phone with the installable PWA and mobile view. Running on a dedicated VPS on RepoCloud with guaranteed CPU, RAM, and SSD, full root SSH access, and a browser serial console. MIT licensed.
Dreeve
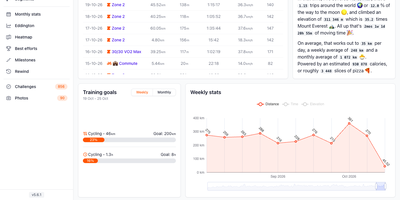
Every ride, run, hike, and swim you have ever recorded finds a home in Dreeve, a private fitness dashboard that lives on your own server rather than in a social feed. Import FIT, TCX, or GPX files from a watch folder, sync Strava, or add connectors for Garmin Connect, Wahoo, Polar Flow, Hammerhead, and Zepp/Amazfit. Weekly charts follow distance, time, and elevation beside training goals, heart rate zones, and training load analysis, and monthly stats pair per-sport totals with an interactive calendar. A heatmap paints every kilometer you have covered. Best efforts rank your fastest 5k, 10k, 50k, and 100k across every sport, while Eddington numbers, a milestones timeline, and a yearly Rewind mark the long game. Strava sync also brings segments, segment efforts, and challenges. Gear pages total the distance on each bike and shoe, and maintenance tasks send alerts through ntfy, Gotify, Discord, Telegram, Slack, or email when an interval comes due. Automation rules assign gear, flag commutes, and set sport types by device, distance, weekday, time of day, or location, so new imports arrive organized. Ask the AI workout assistant about your training, using cloud models, OpenRouter, or a local Ollama model. An installable mobile app and embeddable badges carry your stats to phones and blogs, and a password-protected admin panel keeps the settings. Running on a dedicated VPS on RepoCloud with guaranteed CPU, RAM, and SSD, full root SSH access, and a browser serial console. AGPL-3.0 licensed.
NetPulse
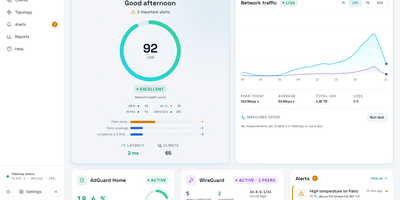
NetPulse is a self-hosted dashboard that turns a pile of routers, switches, and clients into one live picture of how your network is doing. A single score from 0 to 100 condenses latency, loss, uptime, and temperature, and updates every few seconds. The topology map draws itself from bridge and LLDP data, placing wired and wireless clients under the router and port they actually use. Every device is classified by type, with signal strength, band, and first-seen time. Router cards show model, firmware, CPU, memory, temperature, and live traffic. Scheduled WAN speed tests compare results against your contracted plan, and panels for WireGuard peers and AdGuard Home keep VPN and DNS activity in view. Alerts for overheating, new devices, firmware updates, and WAN outages reach you through push notifications, ntfy, Telegram, or webhooks. Admin and viewer accounts share access, a Wi-Fi channel analyzer scores congestion, and OpenWrt firmware upgrades can be started from the browser. MQTT publishing feeds Home Assistant, and an optional read-only MCP endpoint answers questions from your AI assistant. The interface installs as a phone app and speaks English and Spanish. Running on a dedicated VPS on RepoCloud with guaranteed CPU, RAM, and SSD, full root SSH access, and a browser serial console. AGPL-3.0 licensed.
Helical Insight
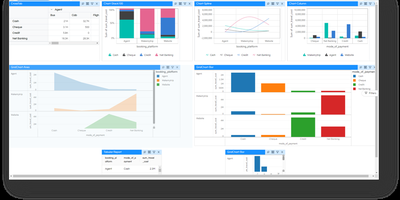
Finance closes the month with invoices that must print perfectly, analysts answer questions from a dashboard, and executives ask the data things in plain language: one platform handles all three jobs. Interactive dashboards support drill-down, drill-through, filters, KPI widgets, maps, and pivot tables, and scheduled delivery or report bursting pushes personalized copies to the people who need them. Pixel-perfect paginated reports cover statements, regulatory documents, and anything where layout is not negotiable. A chat interface generates SQL against connected sources, summarizes reports, and surfaces insights, running against a language model the organization itself chooses. Embedding puts dashboards, reports, and the chatbot inside customer portals and SaaS products, with white labeling swapping logos, themes, colors, and URLs for OEM delivery. Multi-tenancy isolates customers or departments on a single deployment. Row, column, and table level security follows the logged-in user, arriving through JWT, Okta, Keycloak, OAuth, or custom token single sign-on. Exports land in PDF, Excel, CSV, Word, HTML, JSON, and XML. Caching, pagination, virtualization, and clustering keep large deployments responsive, localization adapts the interface for regional teams, custom JavaScript visualizations extend the built-in charts, and REST APIs automate administration across the whole system. Running on a dedicated VPS on RepoCloud with guaranteed CPU, RAM, and SSD, full root SSH access, and a browser serial console. AGPL 3.0 licensed.

SQLPage
If you can write a SELECT statement, you can publish a working web app with SQLPage, where each query's results appear on the page as tables, charts, maps, or forms. A .sql file is a page. Name a component in the first row, and the rows after it become lists, cards, data grids, timelines, or step trackers. Tables offer searching, sorting, frozen headers, and per-row edit and delete buttons. Charts cover line, area, bar, pie, scatter, bubble, and heatmap views with a one-click CSV export. Forms feed INSERT and UPDATE statements directly, with validation and file uploads. A complete CRUD tool takes a handful of queries. The map component plots markers and GeoJSON shapes, and the JSON component lets the same data serve other systems as an API. Protect private pages with password logins or single sign-on through Google, Microsoft, or your own identity provider. Connect to SQLite, PostgreSQL, MySQL, SQL Server, or ODBC sources such as DuckDB, Oracle, Snowflake, and BigQuery. Tabs, modals, alerts, breadcrumbs, and carousels shape multi-page sites, and custom templates, CSS, and JavaScript fill any gap. Running on a dedicated VPS on RepoCloud with guaranteed CPU, RAM, and SSD, full root SSH access, and a browser serial console. MIT licensed.
IRONSIGHT
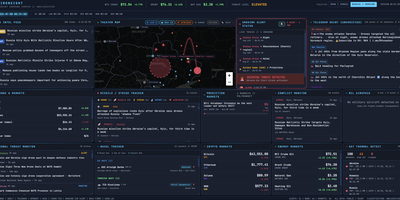
IRONSIGHT fuses over 50 publicly available intelligence sources into a single real-time dashboard that requires zero API keys and zero configuration. The Live Intel Feed aggregates 20+ RSS news sources with keyword relevance filtering from outlets including Reuters, Al Jazeera, and Kyiv Post. The Telegram OSINT module scrapes 27 channels every 60 seconds with automatic translation from Hebrew, Arabic, and Farsi. The interactive Leaflet Theater Map plots military aircraft positions via ADS-B transponder data, naval vessel locations in the Persian Gulf and Eastern Mediterranean, strike markers extracted from news and Telegram, missile trajectory arcs with range rings, and country-border overlays with a distance measurement tool. A header toggle switches the entire dashboard between Iran/Israel and Russia/Ukraine theaters, re-pointing every panel, map layer, and data feed to the selected conflict. The Israel Alert module streams live Pikud HaOref missile alerts with audio notifications, while the Conflict Monitor categorizes events into strikes, defense, diplomatic, and nuclear. Financial panels track defense contractor stocks, S&P 500, VIX, gold, Bitcoin, Ethereum, energy commodities via Yahoo Finance, and Polymarket prediction odds on conflict outcomes. NASA FIRMS satellite thermal detection flags fire and explosion signatures. The Next.js 16 App Router handles server-side data fetching for RSS and API endpoints while client-side React state management drives real-time polling updates. On RepoCloud, deploy IRONSIGHT on a dedicated VPS with persistent storage, root SSH access, and full control over your intelligence monitoring environment, all under the MIT license.