Categories
Self-Hosted Developer Tools Dashboard Network Tools Proxy Management Traffic Monitoring Mihomo Clash MetaStars
Forks
Watchers
Developer links
metacubexd
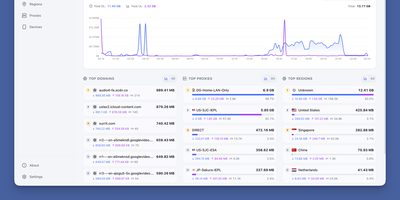
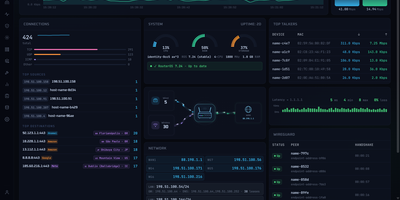
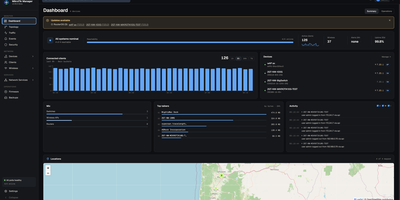
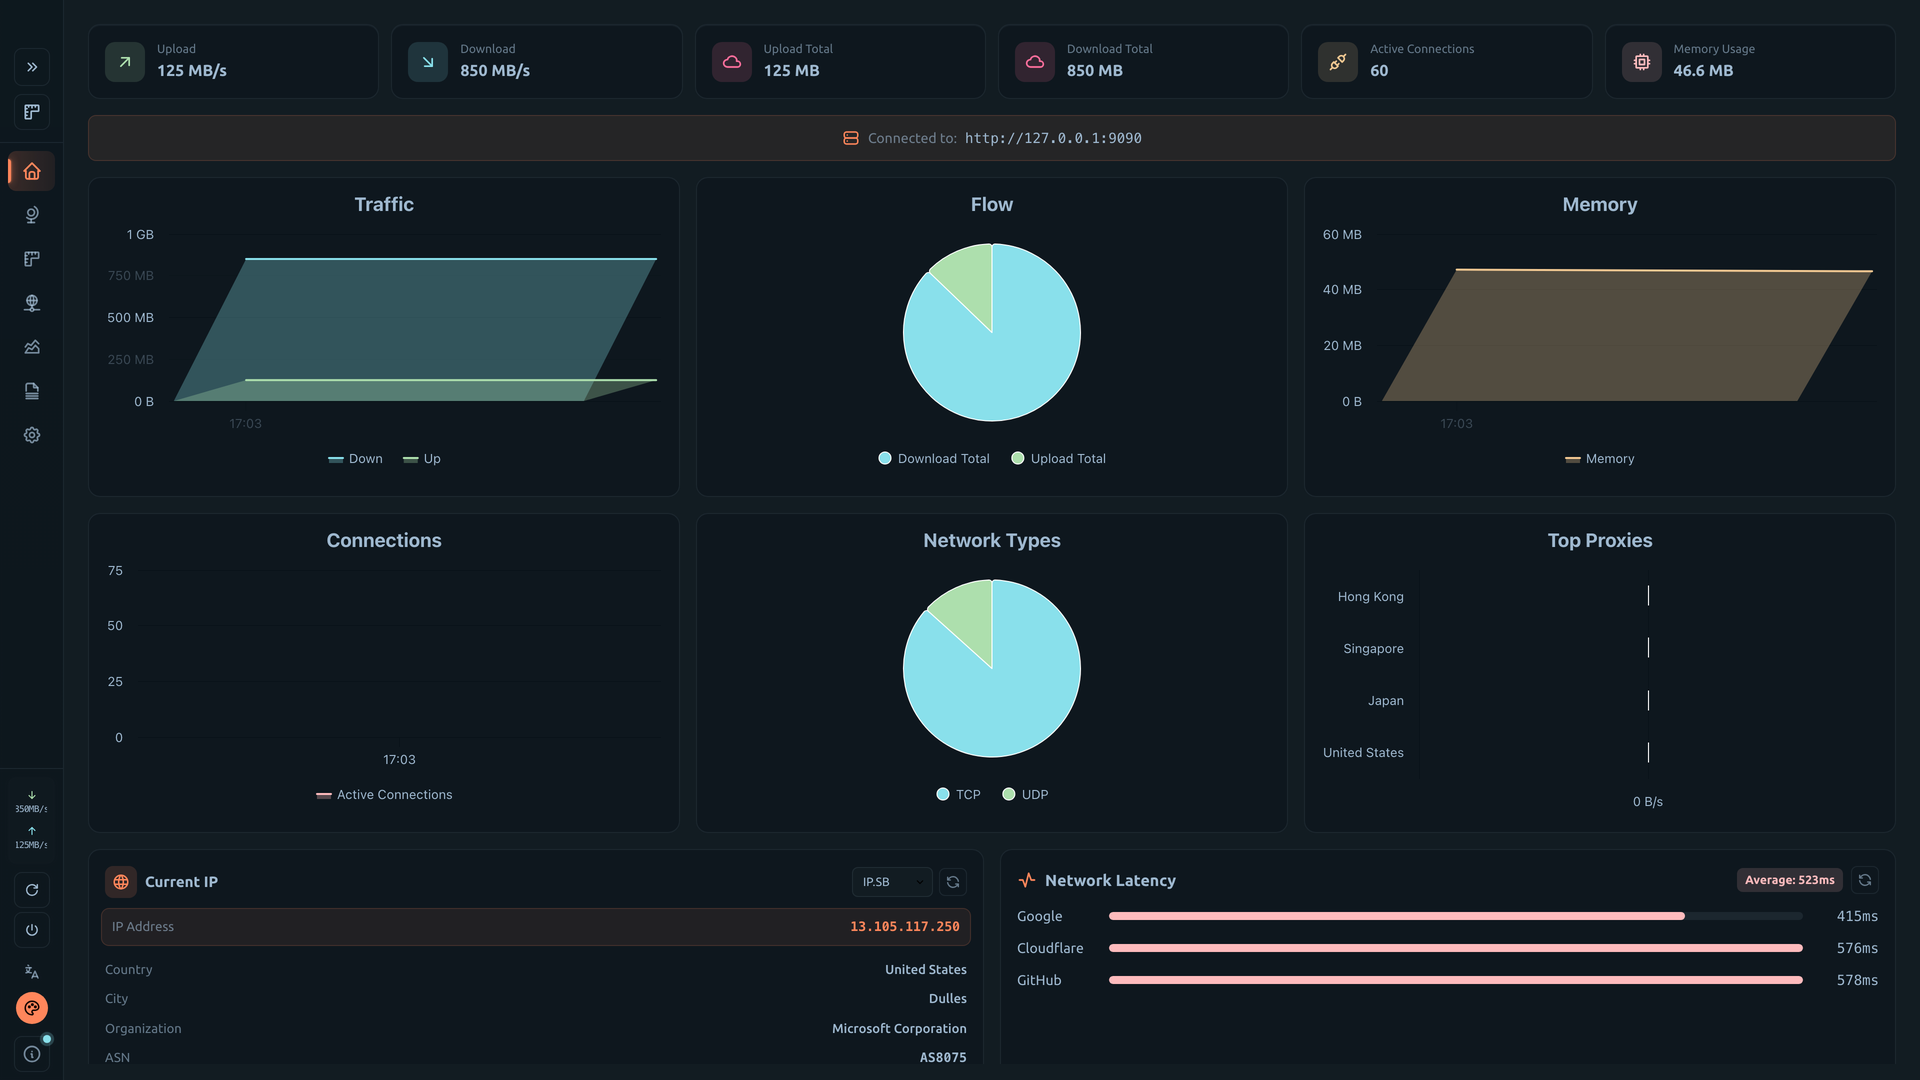
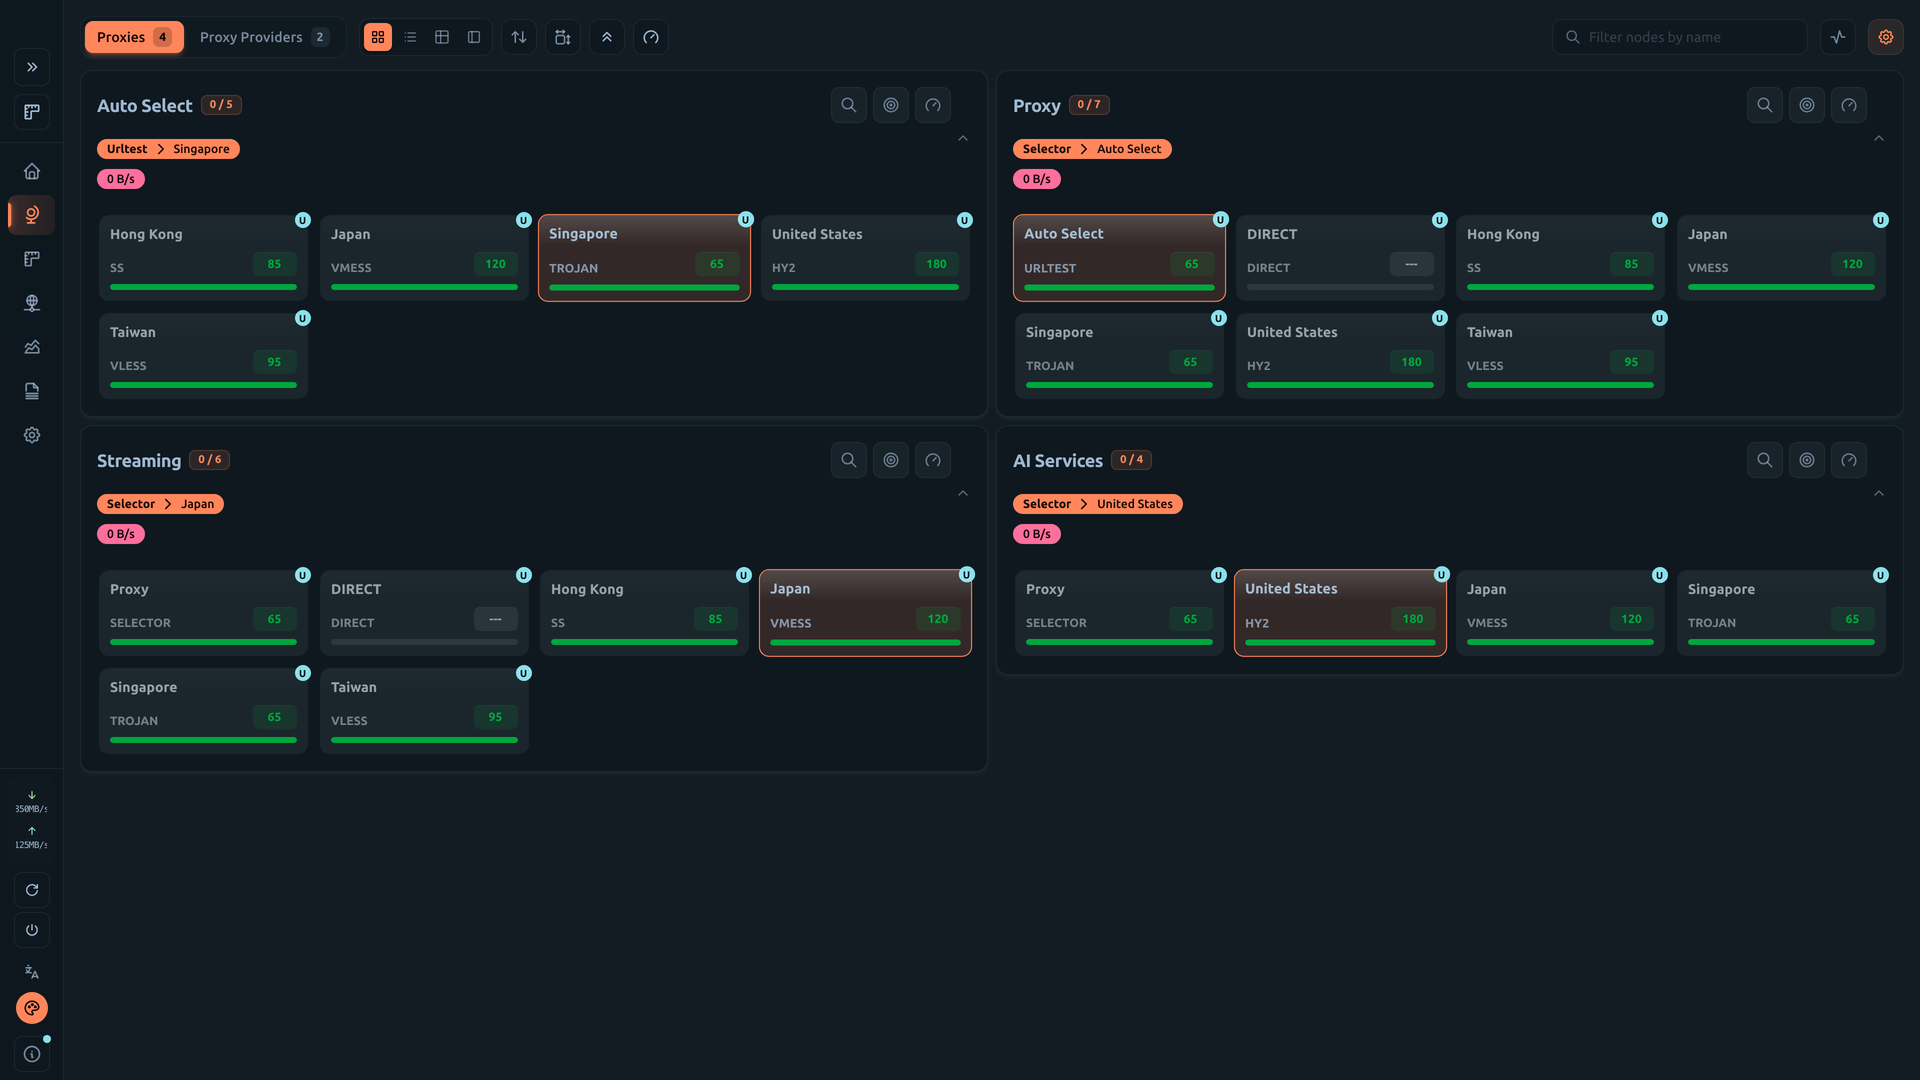
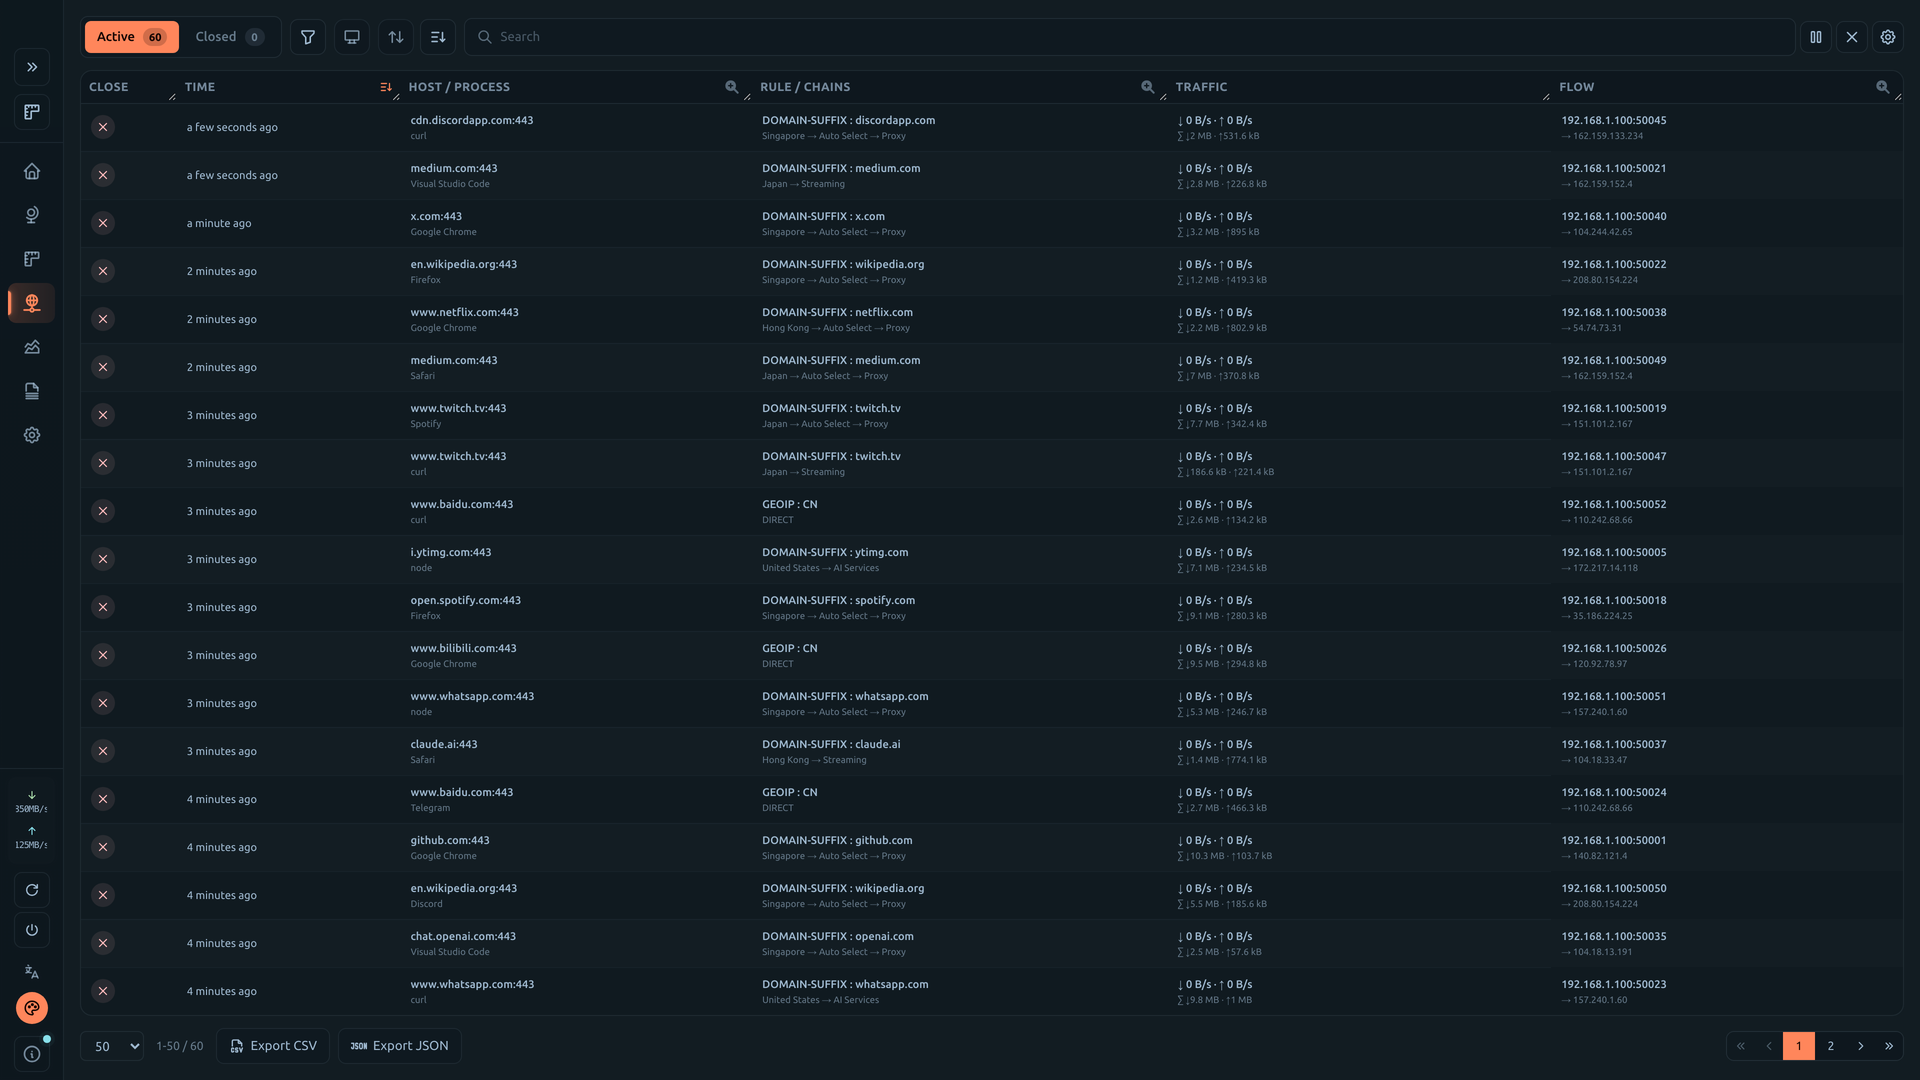
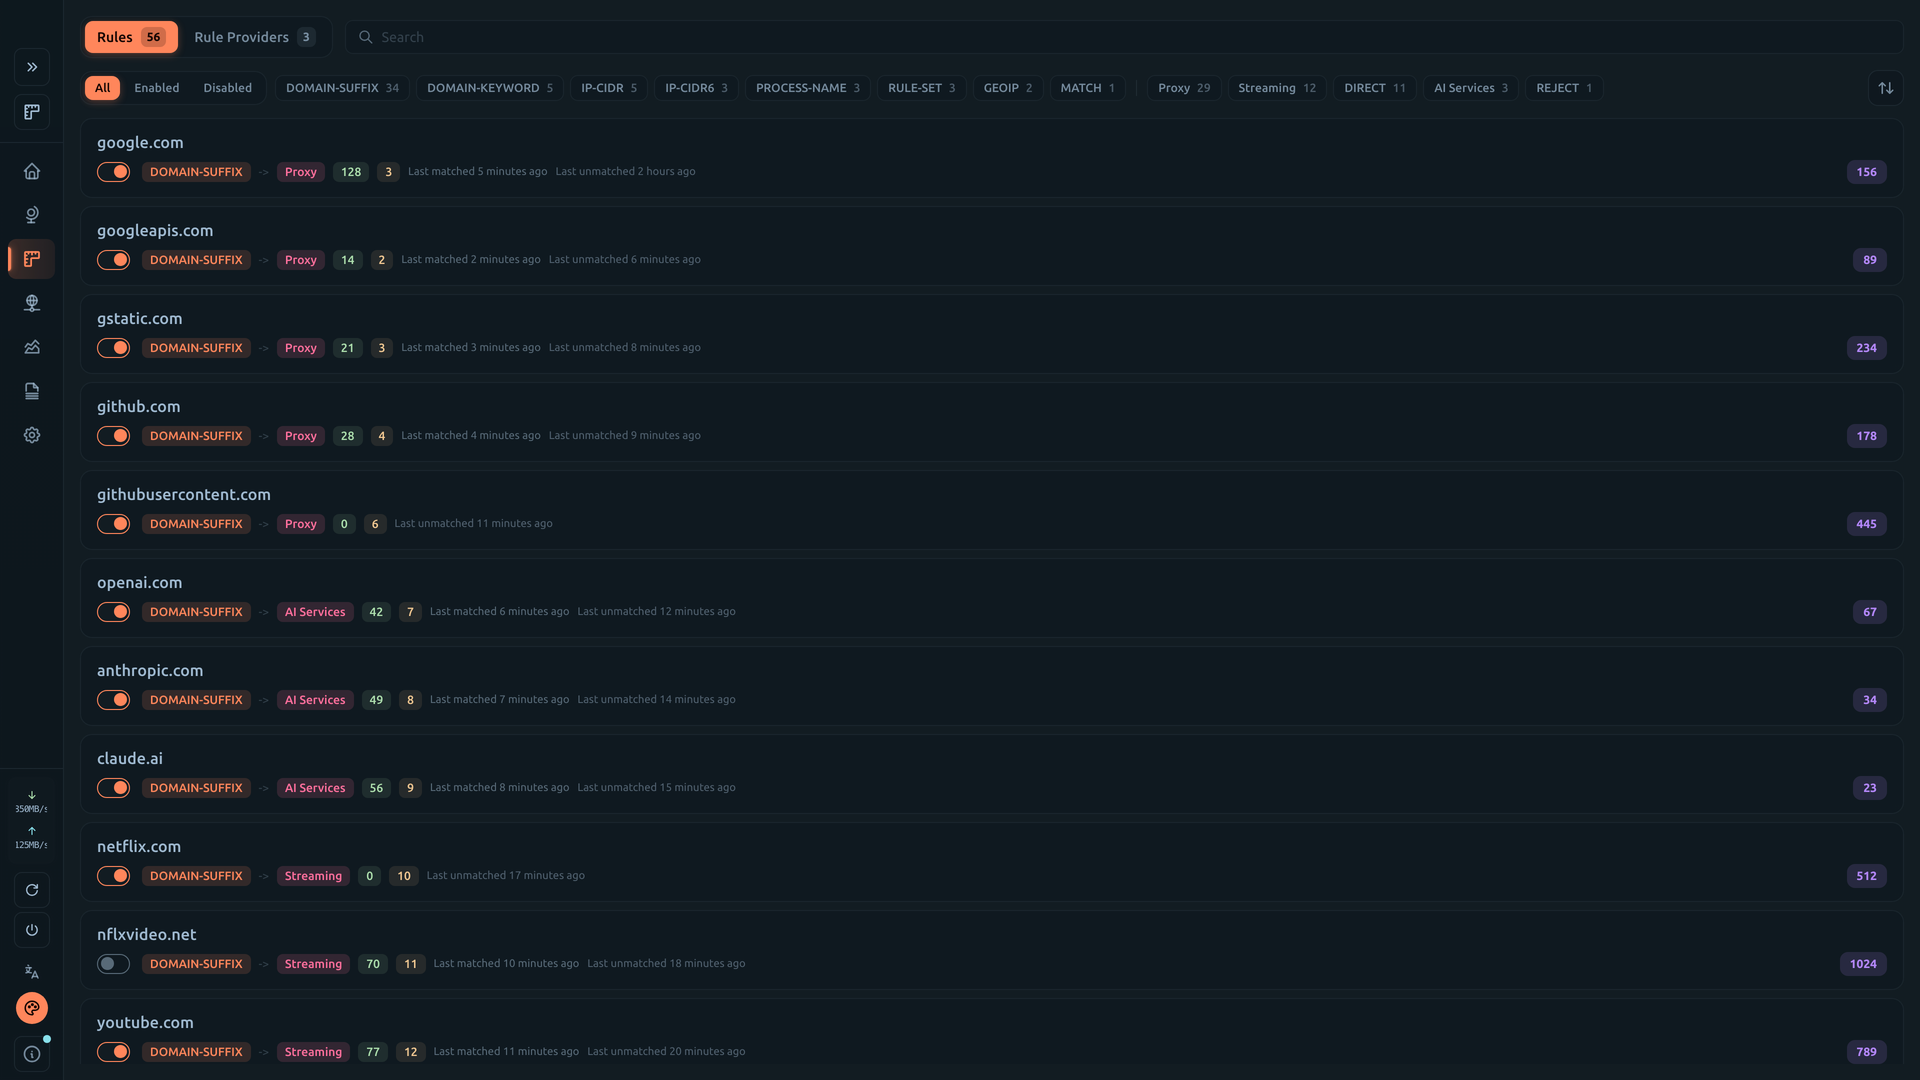
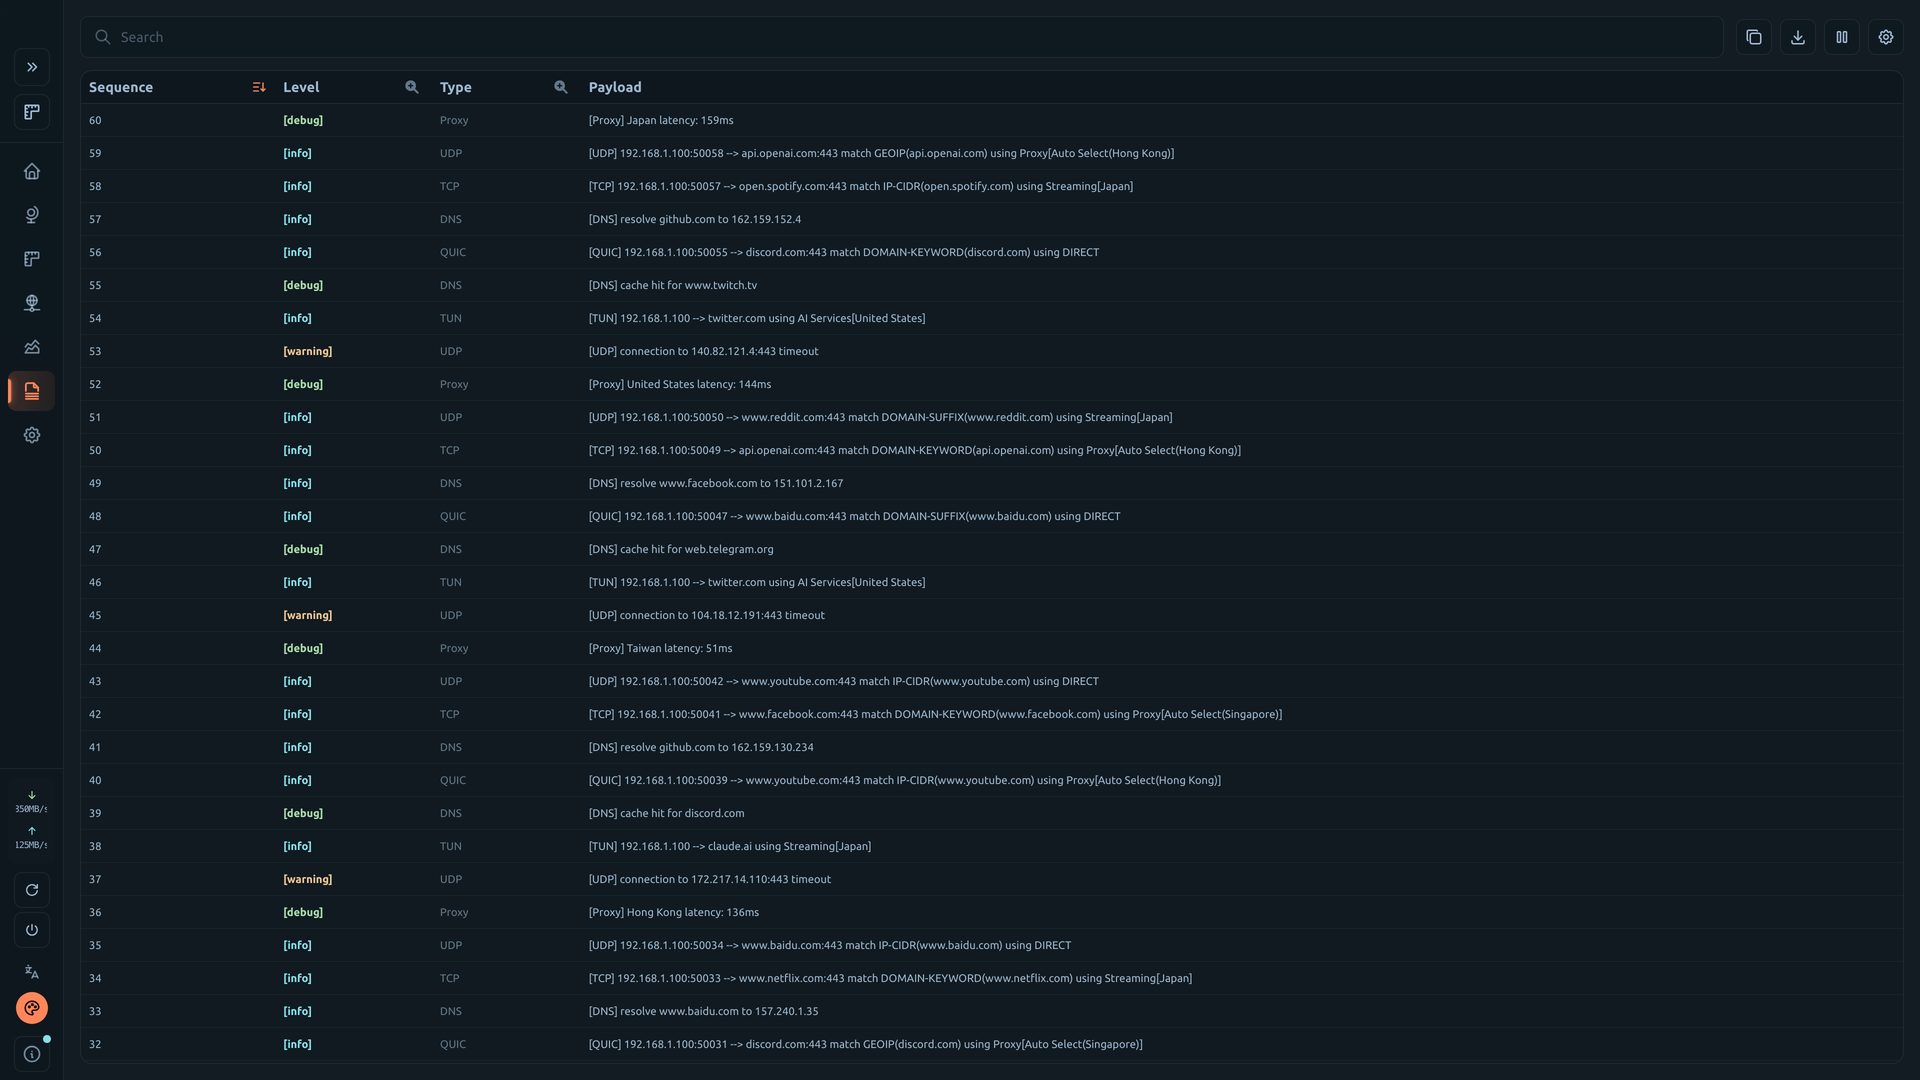
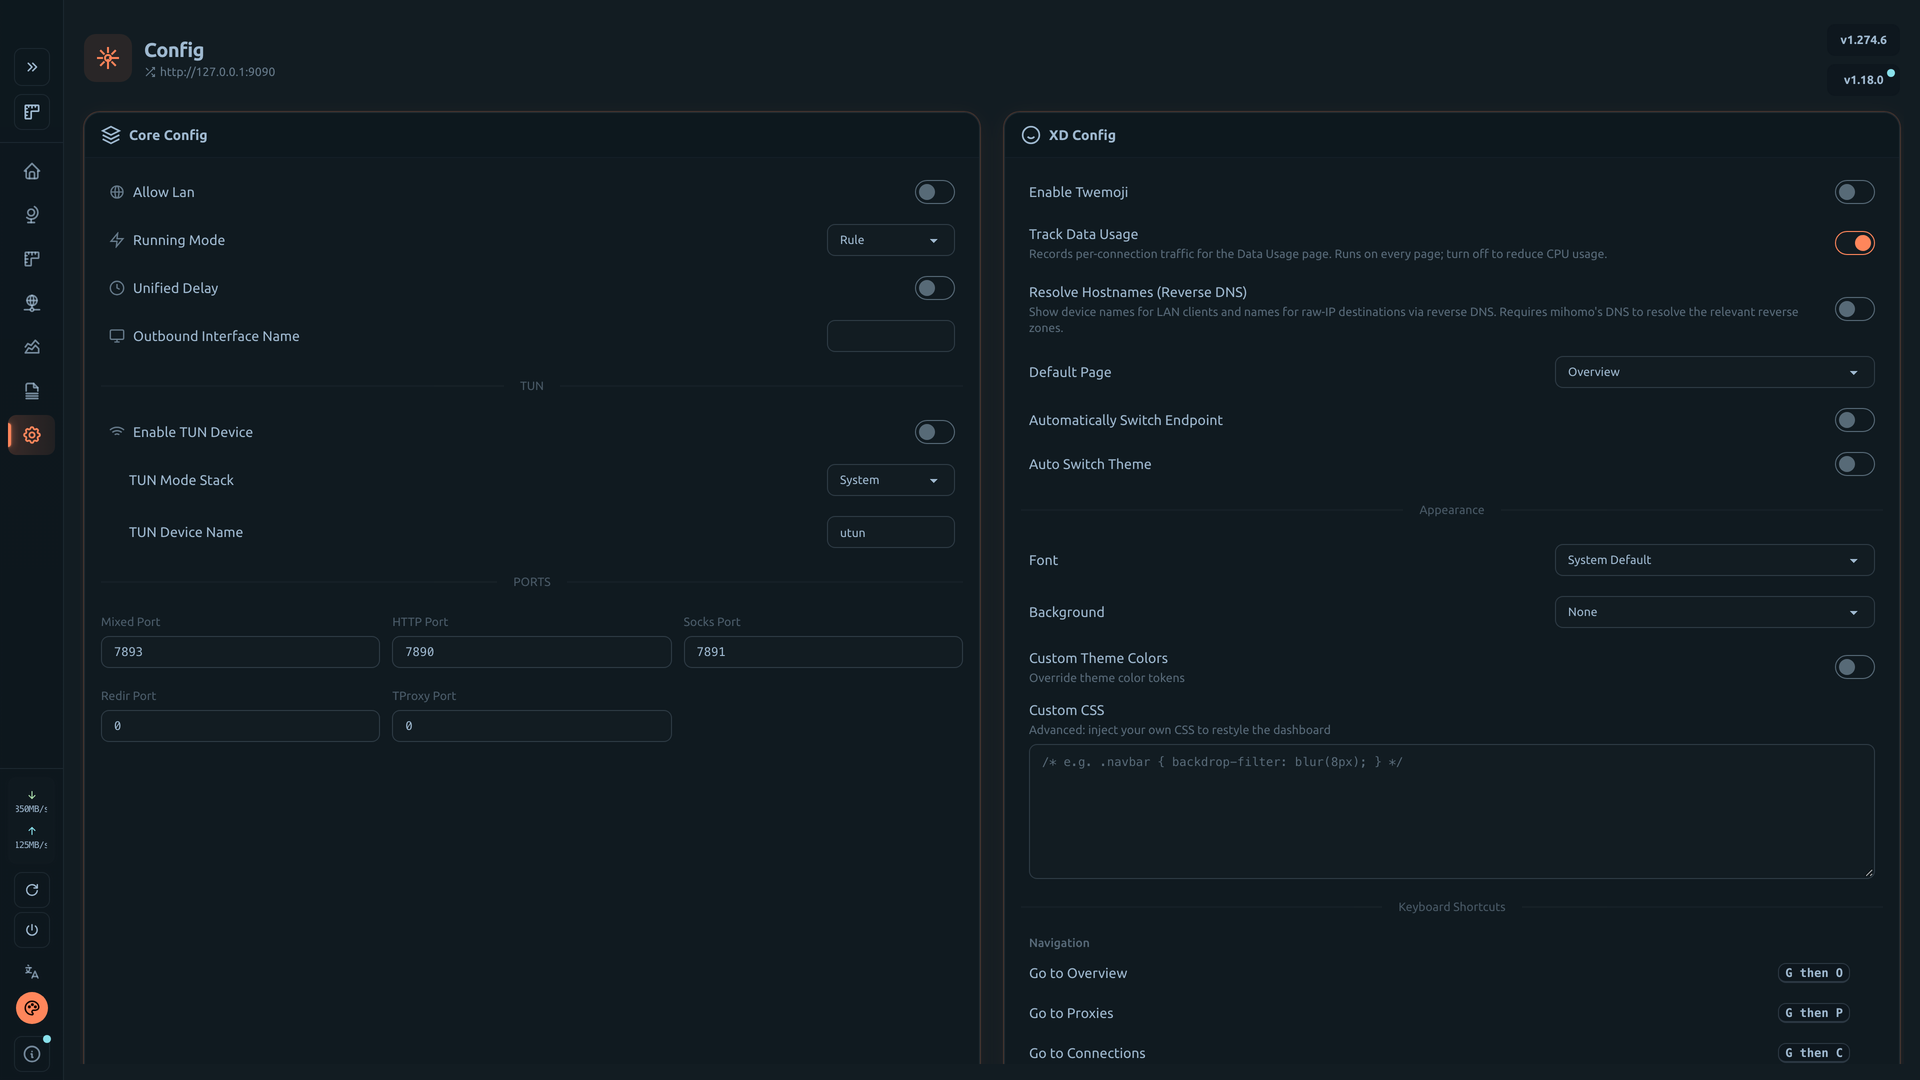
metacubexd gives your Mihomo proxy kernel a proper control room in the browser, from live traffic graphs to a full YAML profile editor. Real-time panels show upload and download speed, totals, active connections, memory use, and the busiest proxies, plus your current exit IP and latency to Google, Cloudflare, and GitHub. Proxy groups appear as cards with per-node latency bars, so switching a selector or running a latency test takes one click. Every connection is listed with its host, process, matched rule chain, and traffic, and can be closed or exported to CSV or JSON. Rules are searchable and filterable by type, and individual rules can be toggled on or off. Live logs stream by level, ready to search or download. With the all-in-one server image, you can also create profiles, import subscriptions by URL, edit configuration with schema-aware completion, validate it, and restart the kernel from the same page. Thirty-two themes, custom CSS, keyboard shortcuts, a responsive mobile layout, and seven interface languages make it comfortable to use anywhere. Running on a dedicated VPS on RepoCloud with guaranteed CPU, RAM, and SSD, full root SSH access, and a browser serial console. MIT licensed.
Benefits
- Control Your Proxy Kernel Visually
- Switch proxy groups, run latency tests, toggle rules, and change core settings from a browser panel instead of editing configuration files and restarting the kernel by hand.
- Spot Traffic Problems Fast
- Live charts, per-connection tables, rule match counts, and streaming logs show which host, process, and rule chain handled each request, so misrouted or slow traffic is easy to trace.
- Manage Profiles In The Browser
- Import subscriptions by URL, edit YAML with schema completion, validate before activating, and restart the kernel only after the check passes, all without opening a shell.
- Works On Desktop And Phone
- A responsive layout, 32 themes, seven languages, and keyboard shortcuts keep the dashboard usable from a laptop, a tablet, or a phone connected to your server.
Features
- Live Traffic Overview
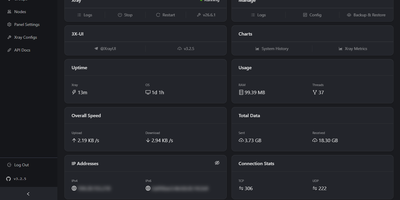
- Cards and charts show upload and download speed, totals, connections, memory, network types, top proxies, current IP, and latency tests to major sites.
- Proxy Group Management
- Selector and URL-test groups render as node cards with protocol labels and latency bars, with provider views and quick delay testing for every node.
- Connection Tracking
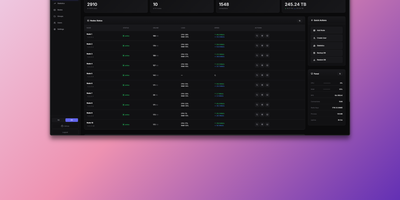
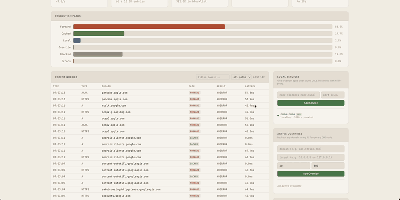
- Active and closed connections list host, process, matched rule chain, traffic, and flow, with search, sorting, one-click close, and CSV or JSON export.
- Rule And Log Viewer
- Browse rules by type with match counts and enable switches, and follow a searchable log stream filtered by debug, info, and warning levels.
- Profile And Config Editor
- The server image adds profile management, subscription import with usage cards, an in-browser YAML editor with validation, and safe kernel restarts.