Categories
Network Monitoring Traffic Analysis Proxy Management Network Visualization OpenClash Gateway Dashboard Self-Hosted MonitoringStars
Forks
Watchers
Developer links
Neko Master
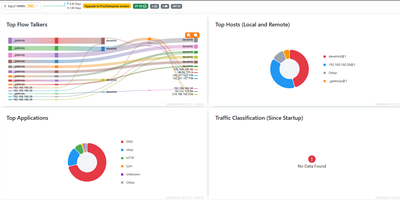
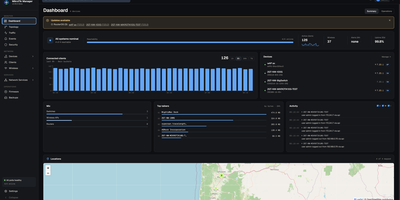
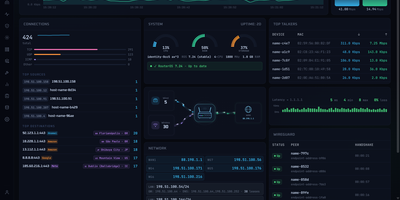
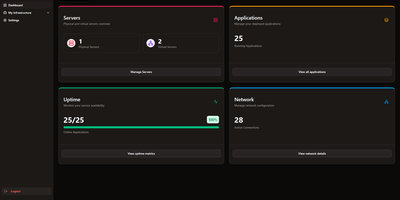
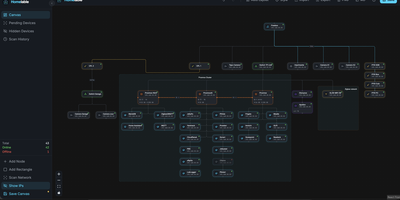
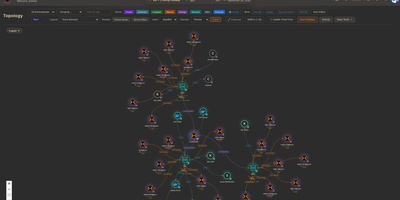
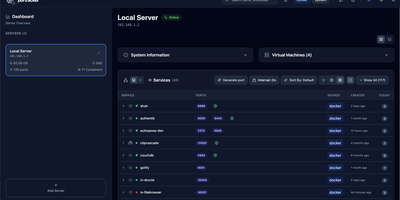
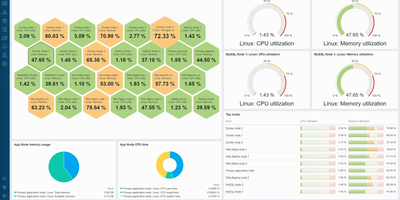
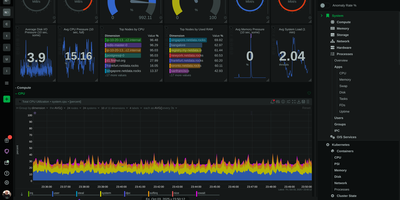
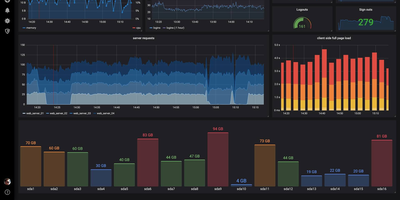
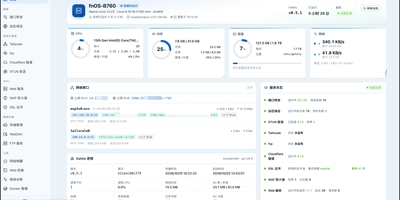
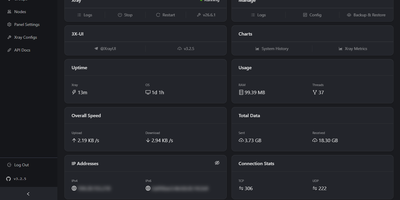
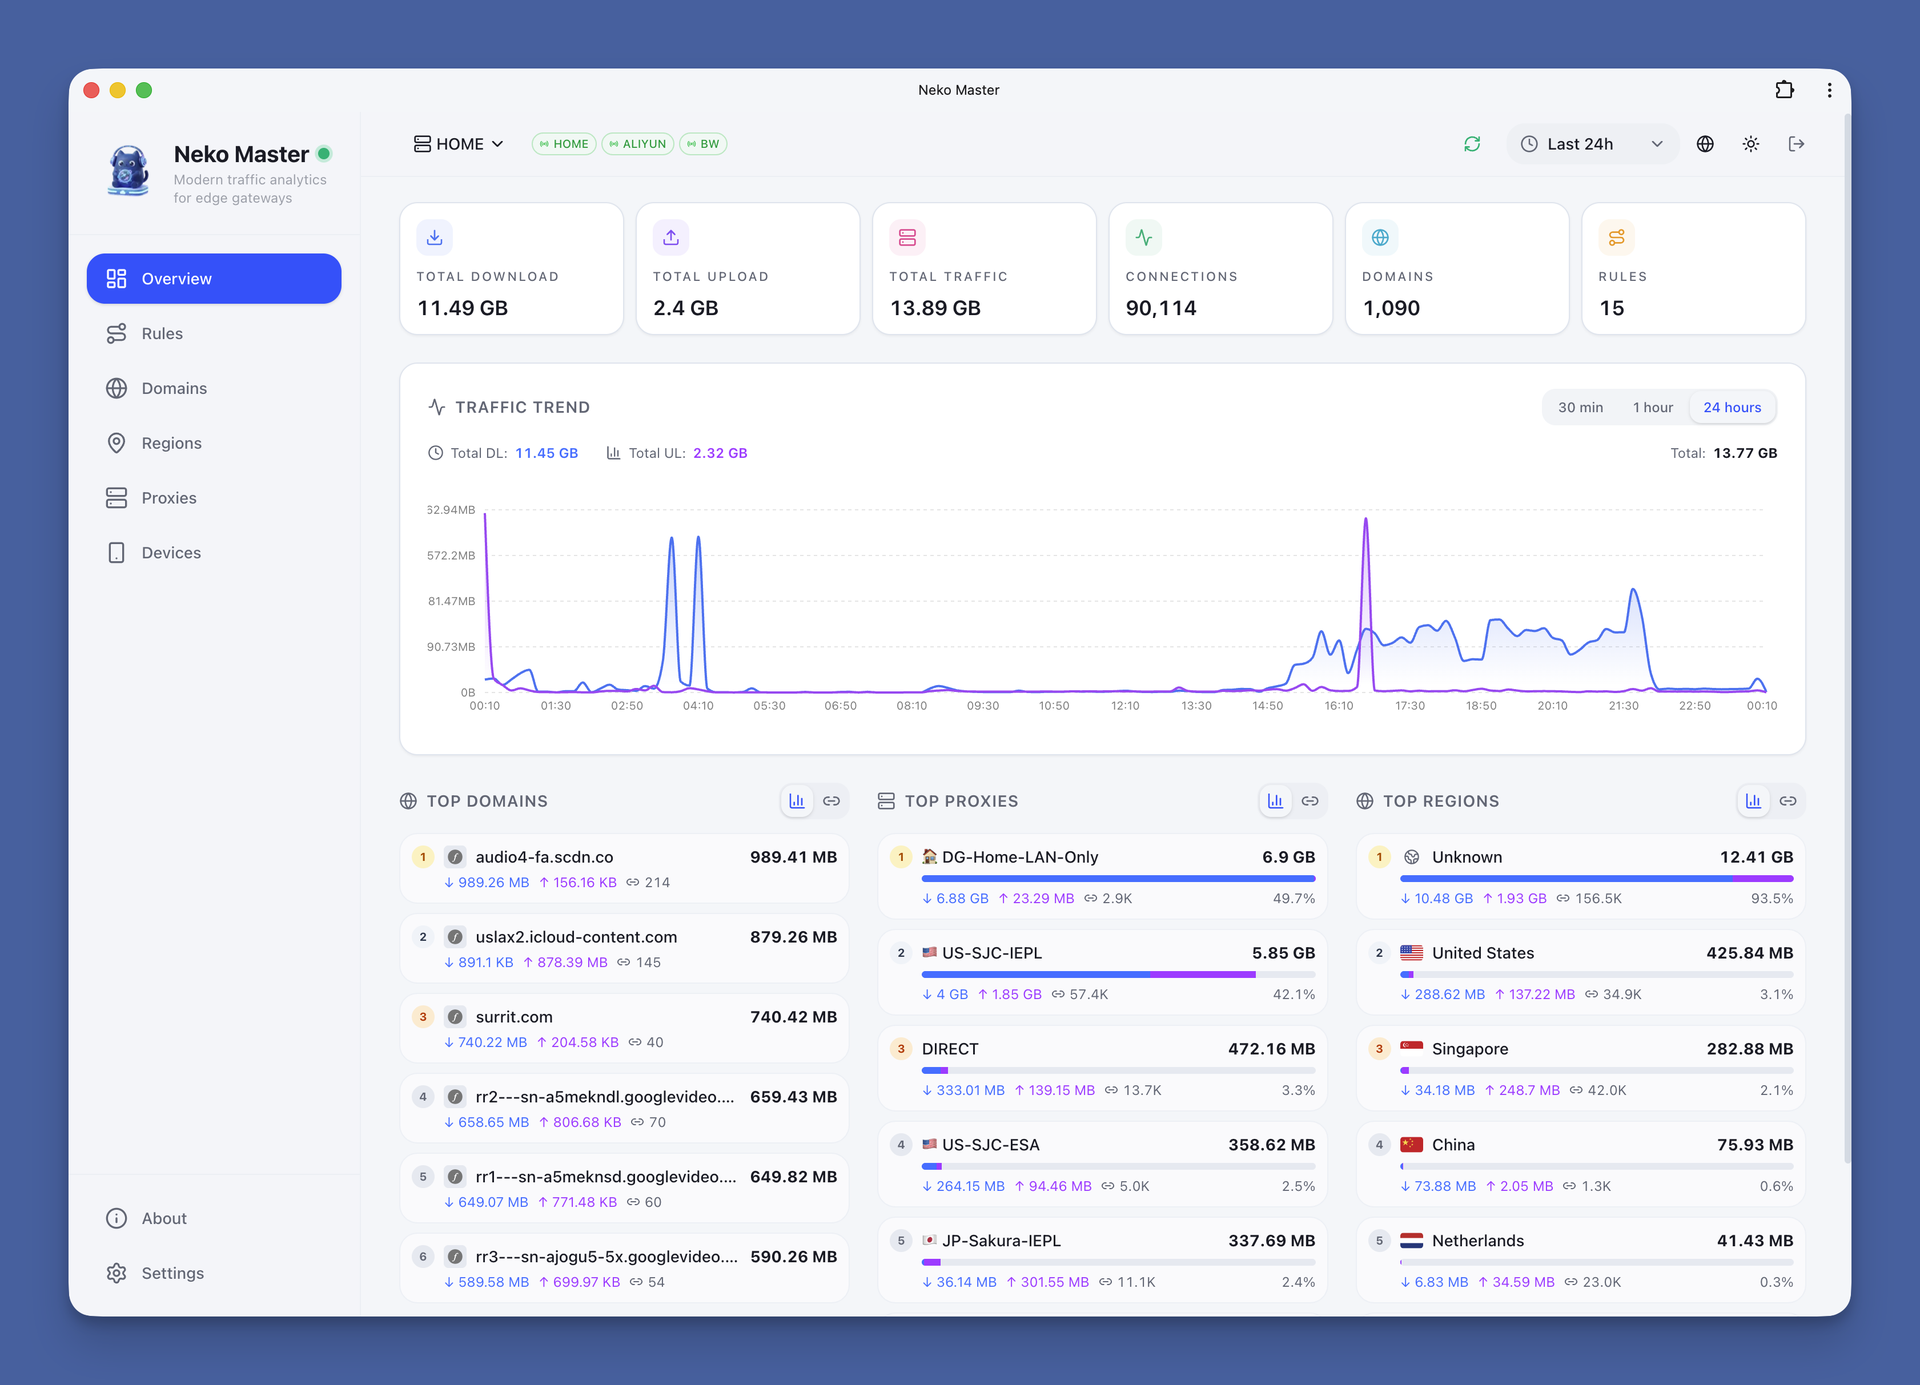
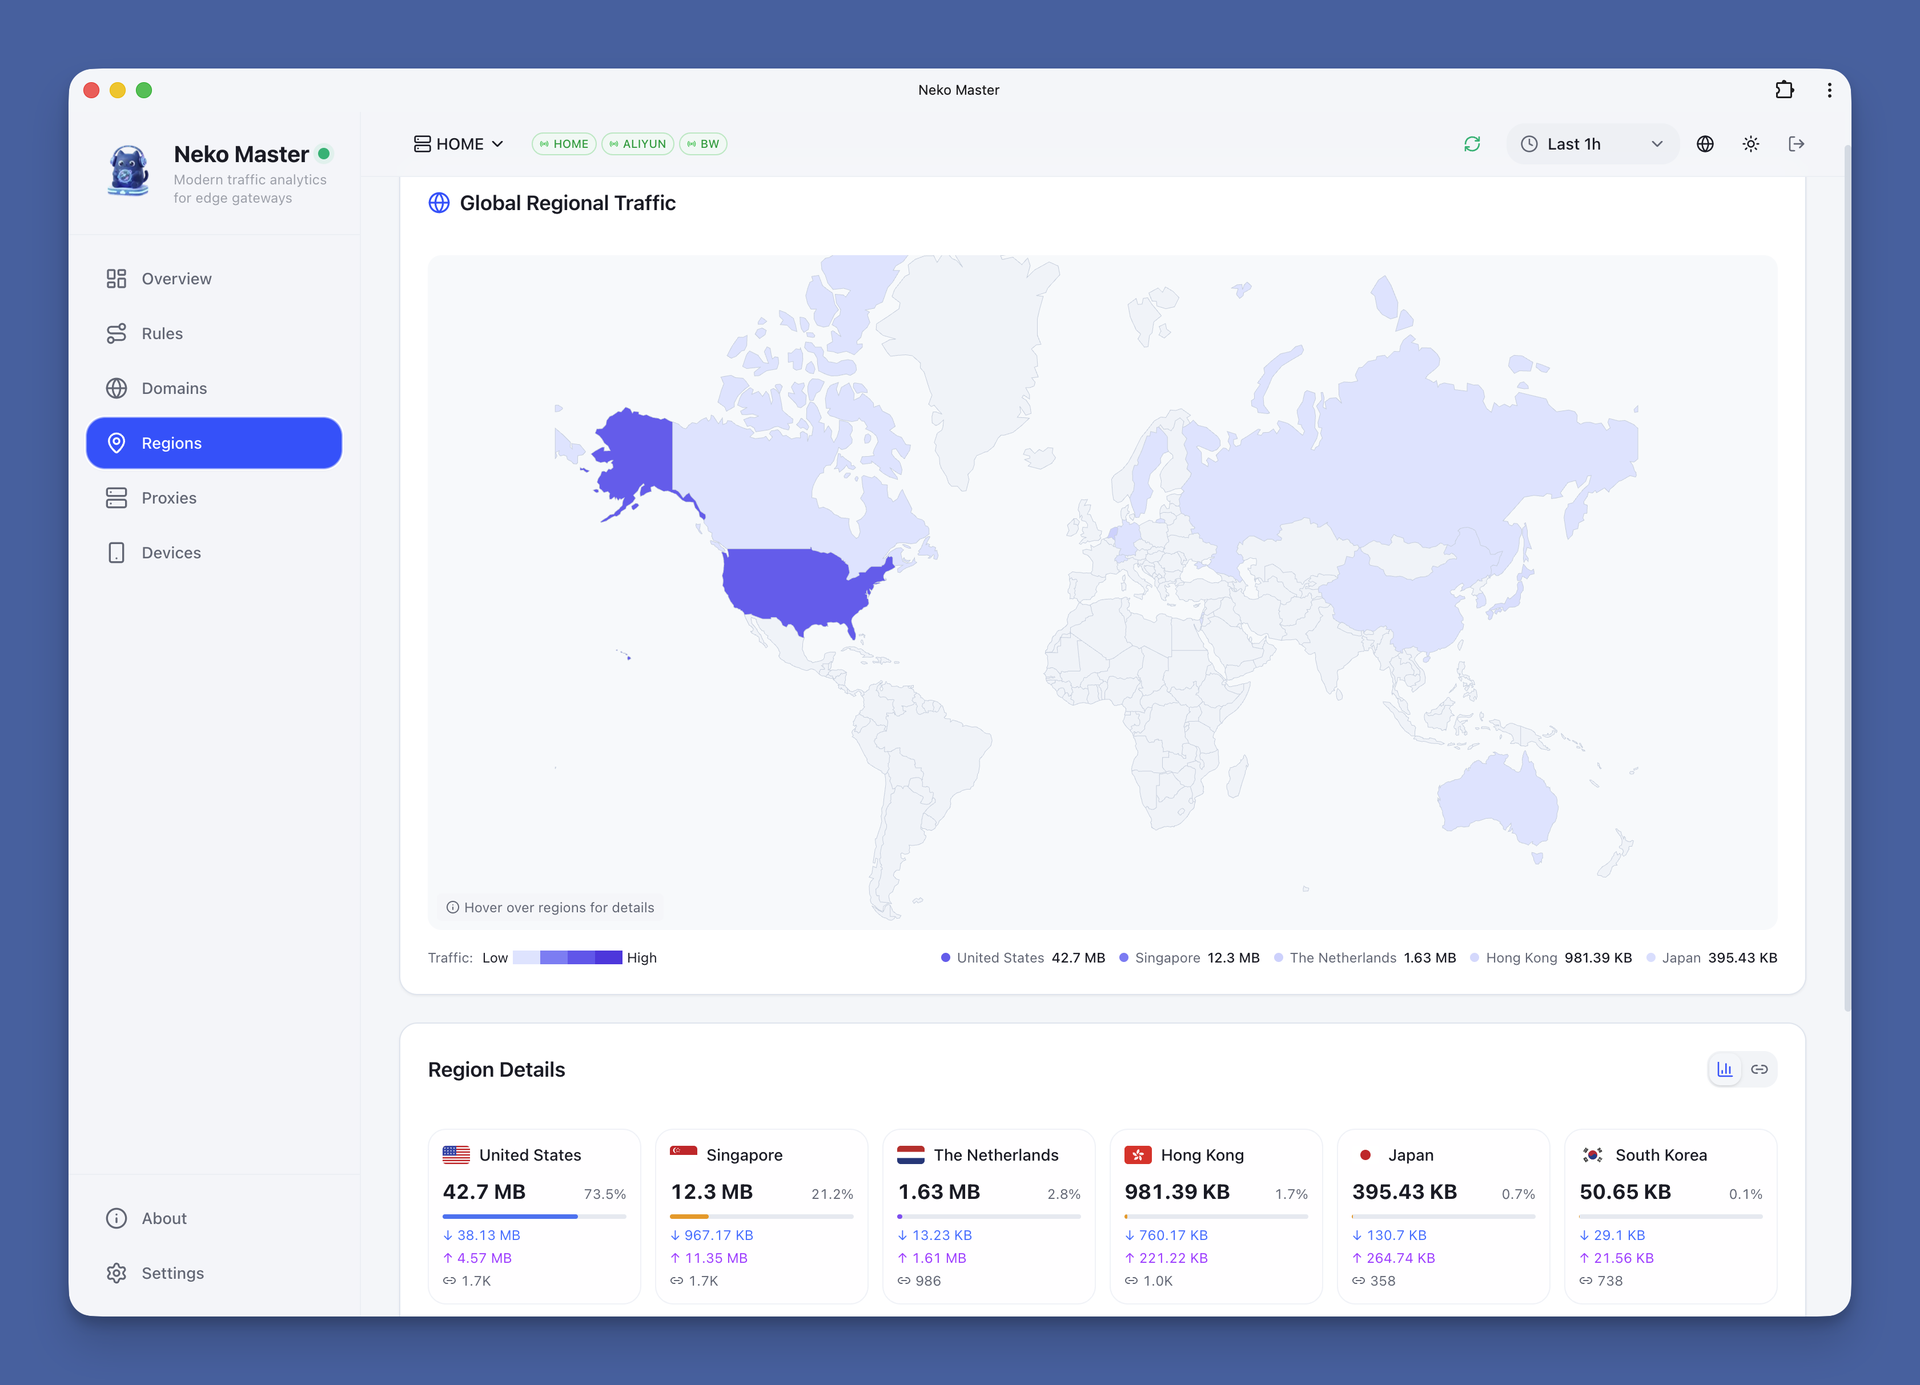
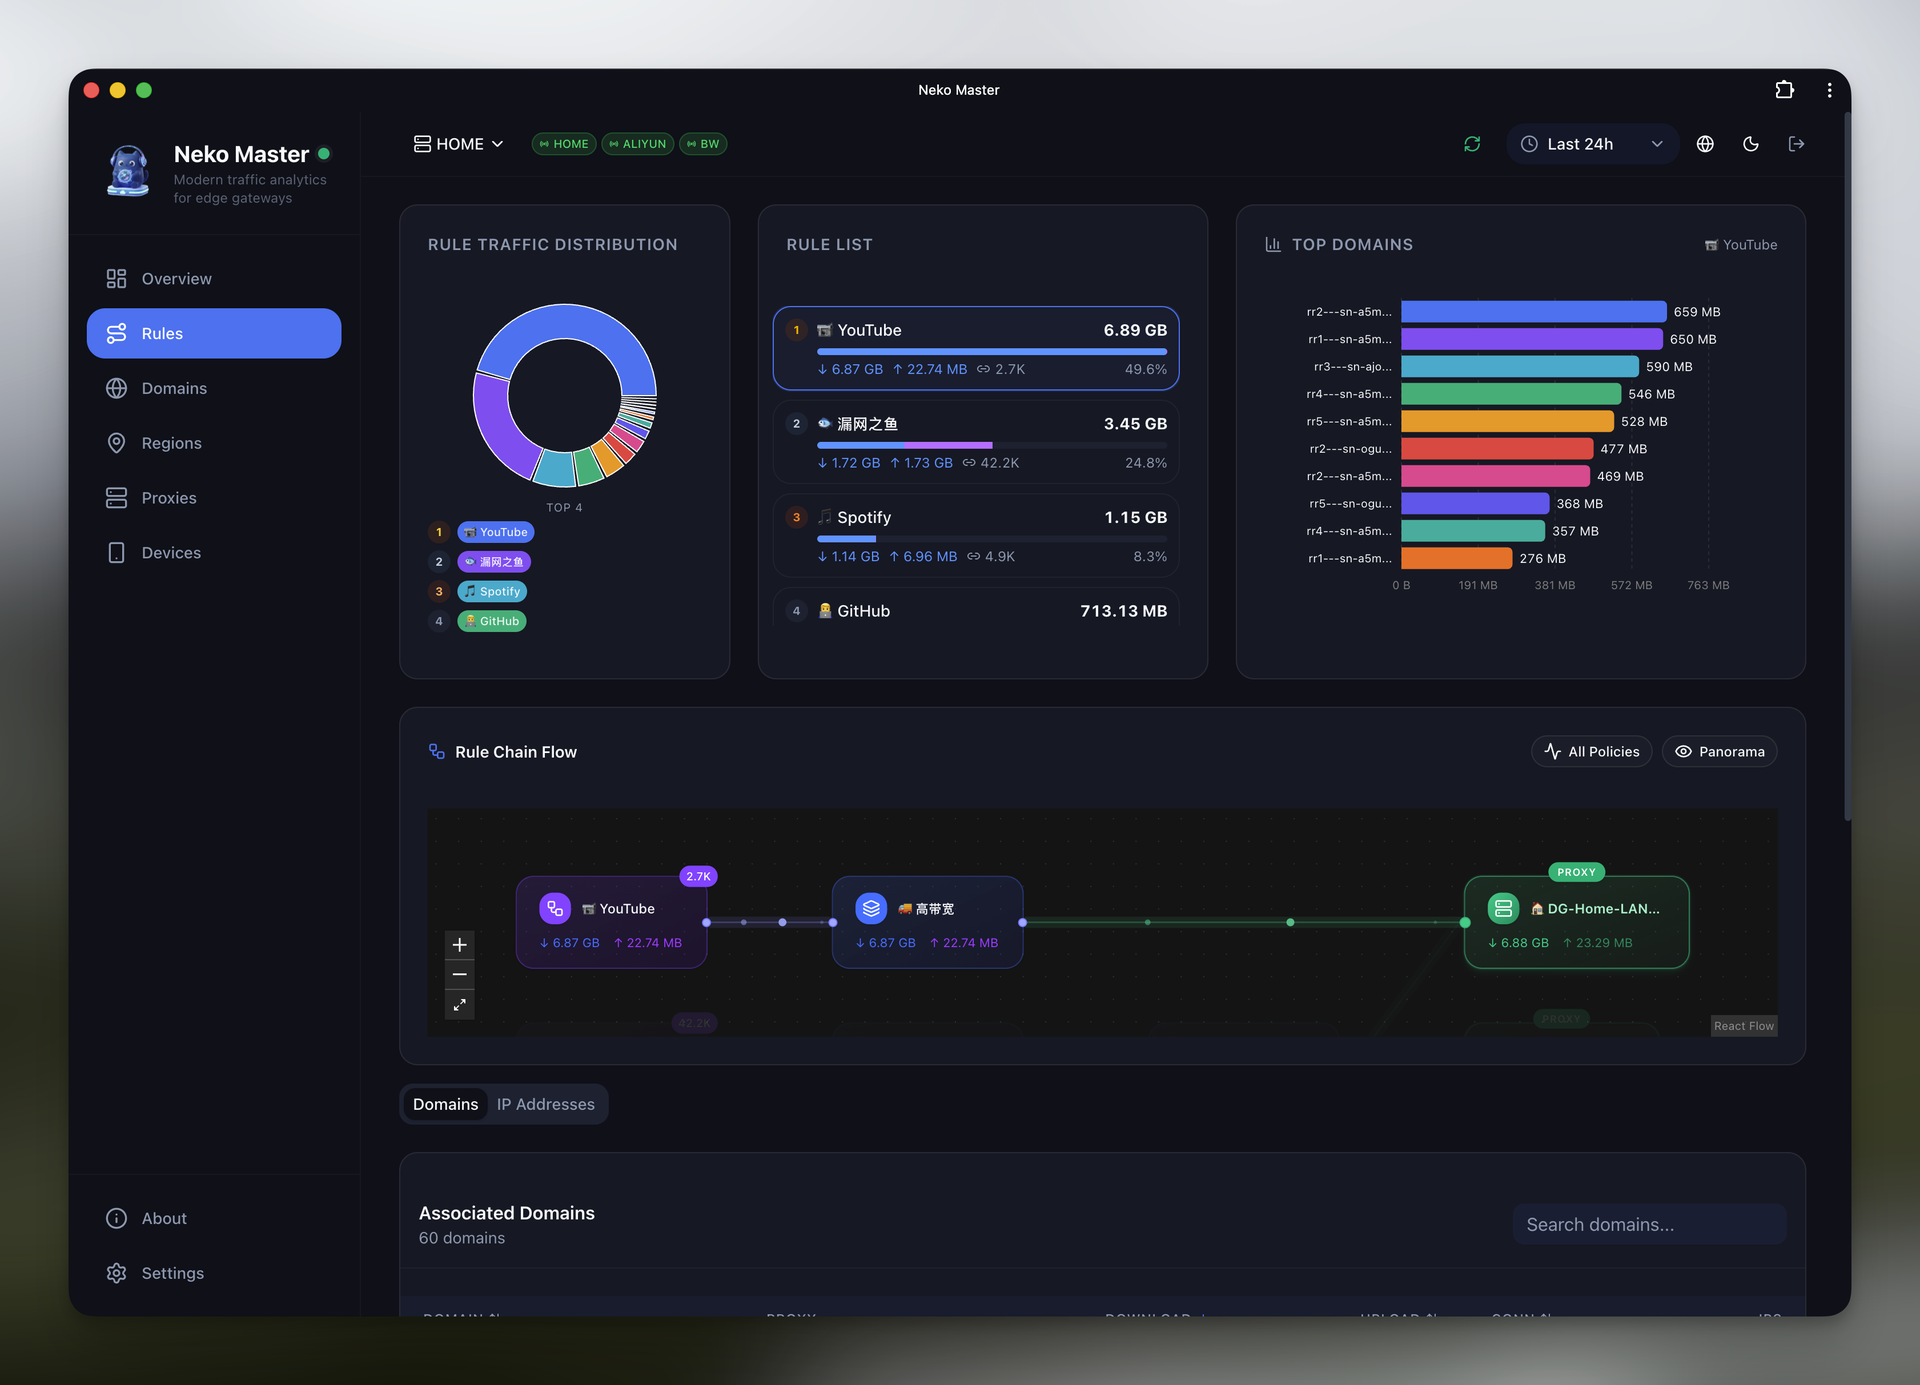
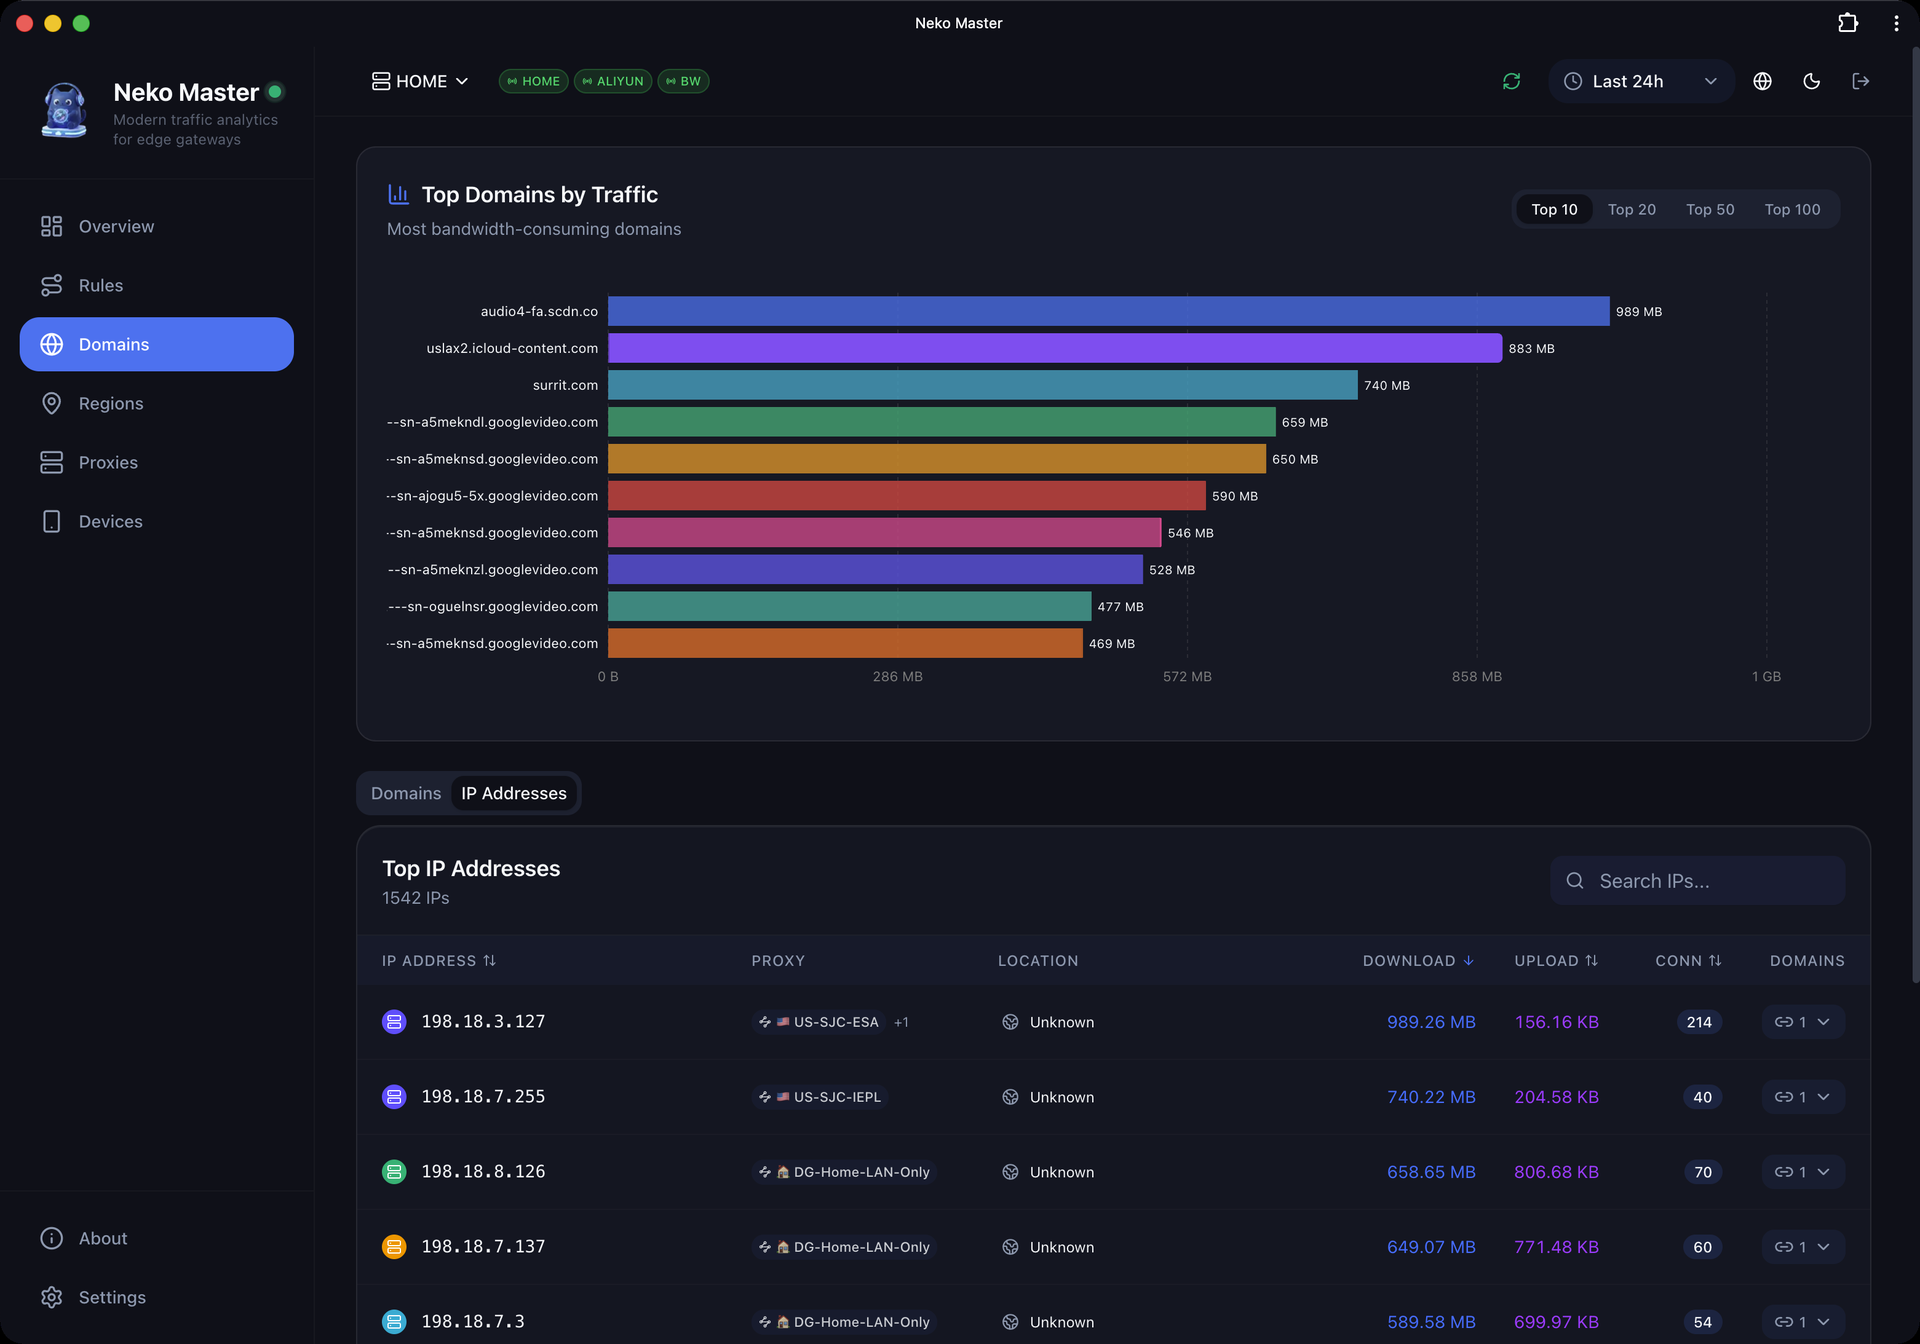
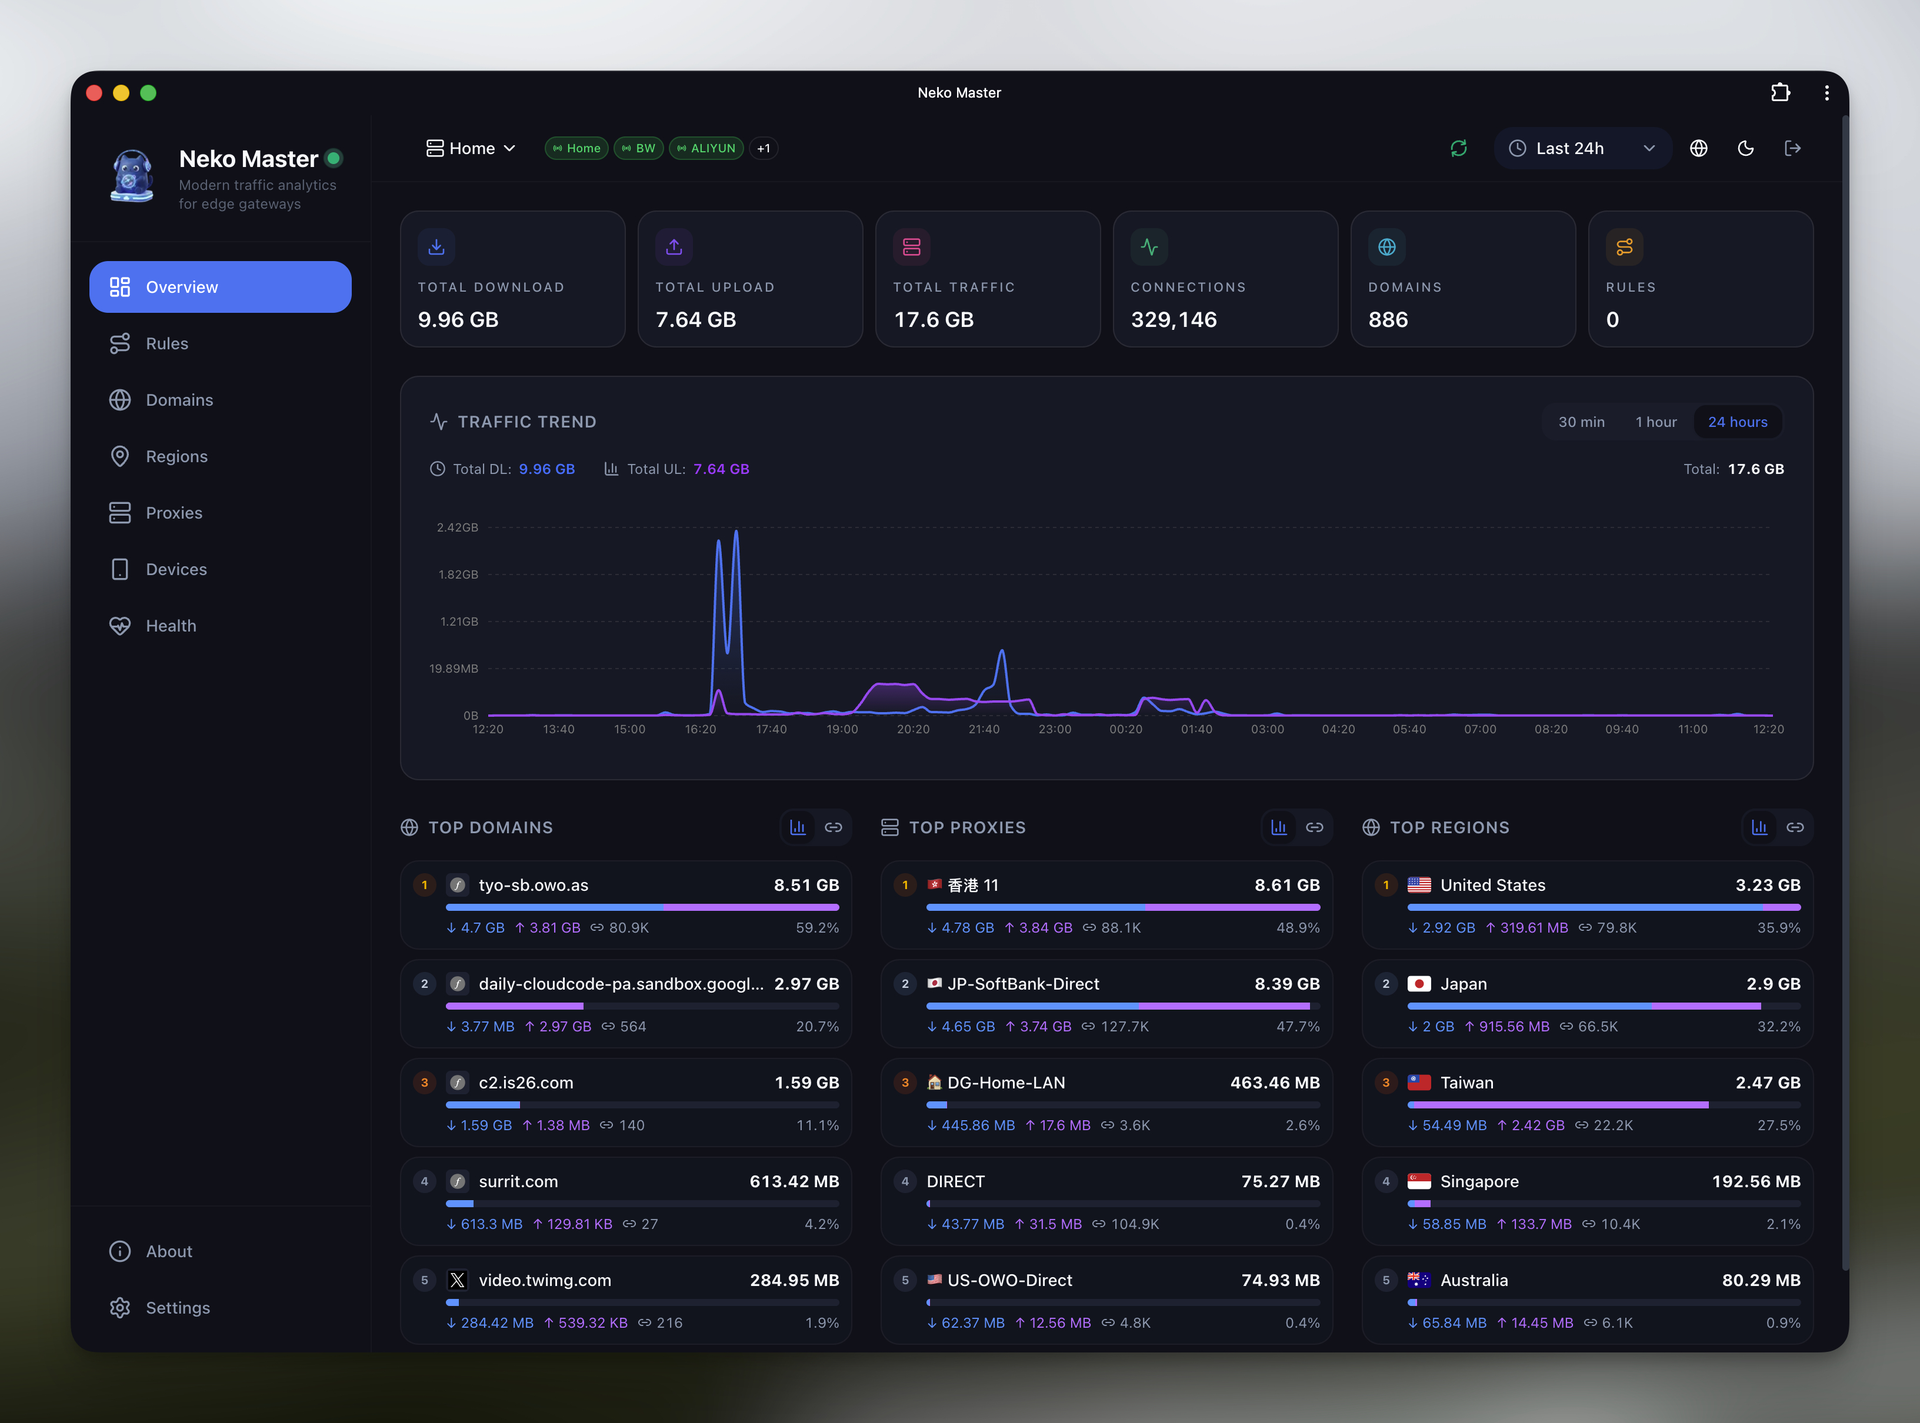
Neko Master watches every connection flowing through your Clash, Mihomo, or Surge gateway and turns the stream into a live map of devices, domains, countries, and proxy nodes, so questions that once needed packet captures get answered at a glance. The dashboard refreshes over WebSocket as traffic moves, charting upload and download trends across thirty minutes, one hour, or a full day. Domain views rank every host your network contacts by traffic and connection count, and IP views add ASN and geographic detail, so an unfamiliar endpoint explains itself instead of raising an alarm. Proxy statistics break traffic down per node and per rule, which makes a saturated exit, a misrouted application, or an underused subscription obvious in seconds. One panel watches several gateways at once: add OpenClash backends directly, or install the one-command agent on OpenWrt, Linux, or macOS machines beside remote gateways and let each agent report home. Because agents open the connection outward, gateways behind NAT still report in, and the panel never reaches into your network uninvited. History persists in SQLite by default, and busy networks can dual-write traffic statistics to ClickHouse for larger histories while configuration stays in SQLite. Token-based access control protects the dashboard, dark mode and an installable PWA keep it comfortable on a phone, and the interface switches between English and Chinese. Running on a dedicated VPS on RepoCloud with guaranteed CPU, RAM, and SSD, full root SSH access, and a browser serial console. MIT licensed.
Benefits
- See Every Connection Live
- WebSocket streaming refreshes the dashboard as packets flow, so a device misbehaving right now is visible right now instead of in tomorrow's log review.
- Audit Domains And IPs
- Every contacted domain is listed with traffic, connection counts, and resolved IPs, while IP views add ASN and country, making unknown endpoints easy to investigate.
- Many Gateways One Panel
- Direct backends and outbound-only agents let one dashboard follow gateways in several homes or offices, including machines behind NAT that nothing can dial into.
- Your Traffic Stays Yours
- All statistics live in your own SQLite or ClickHouse database on your server, and the tool only observes gateways you configure, never providing proxy services itself.
Features
- Real-Time WebSocket Streaming
- Connections stream from Clash and Mihomo gateways over WebSocket for near-instant dashboard updates, falling back to five-second HTTP polling when WebSocket routing is unavailable.
- Domain And IP Analysis
- Per-domain traffic, connection counts, and associated IPs combine with ASN and geo-location lookup so every remote endpoint carries context, not just an address.
- Proxy Node Statistics
- Traffic and connection counts are broken down per proxy node and rule, exposing saturated exits and misrouted traffic across Surge and Clash configurations.
- Agent-Based Remote Collection
- A one-command agent installs on OpenWrt, Linux, or macOS beside the gateway and reports to the central panel, which never connects to gateways directly.
- Optional ClickHouse Storage
- SQLite stores everything by default; enabling the ClickHouse profile dual-writes traffic statistics for large histories while SQLite keeps configuration and metadata as always.