Hermes Studio
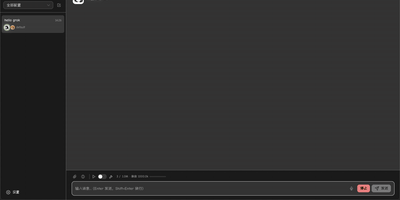
The most comprehensive open-source control plane for Hermes Agent — a full workspace combining AI chat, visual workflows, multi-agent orchestration, coding agent management, and platform channel integration in one self-hosted dashboard. Real-time chat streaming over Socket.IO connects to any OpenAI-compatible backend including Ollama, OpenAI, Anthropic, and custom endpoints with multi-session management, tool call expansion, inline file previews for HTML, PDF, DOCX, images, and source code, plus profile-scoped uploads and workspace attachments. The visual workflow builder provides a Vue Flow canvas for constructing DAG-structured pipelines with directed edges, conditional routes, approval gates, loops, and live execution with per-node status updates. Platform channel integration configures Telegram, Discord, Slack, WhatsApp, Matrix, Feishu, DingTalk, QQBot, WeChat, and WeCom bots from one page with credential management and per-platform behavior settings. Multi-agent group chat rooms enable real-time messaging with @mention routing, automatic context compression, and SQLite message persistence. The coding agent panel installs, launches, and monitors Claude Code and Codex with built-in terminal, session history, and file diffs. Usage analytics track token consumption, estimated costs, cache hit rates, and 30-day daily trends with model distribution charts. Kanban boards plan and track agent work alongside cron job scheduling for recurring tasks. Deploy via Docker, npm CLI, or desktop installer for Windows, macOS, and Linux. Running on a dedicated VPS on RepoCloud with guaranteed CPU, RAM, and SSD, full root SSH access, and a browser serial console. MIT licensed.
Appsmith
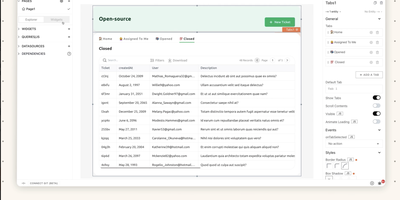
Admin panels, database GUIs, dashboards, approval flows, customer support consoles - Appsmith builds the internal tools your team keeps postponing, on an open-source low-code platform. The UI assembles from 45+ drag-and-drop widgets - tables with server-side pagination and inline editing, charts, forms, lists, buttons - which bind to data through {{ }} JavaScript expressions anywhere in the editor. Datasources cover PostgreSQL, MySQL, MongoDB, MS SQL, Redis, Snowflake, and more, plus any REST or GraphQL API, with SaaS integrations and AI query support for prompt-based steps inside apps. When the widget library falls short, custom widgets are plain JavaScript, HTML, and CSS, and external JS libraries can be imported, which keeps the platform extensible where pure no-code tools hit walls. Git-based version control enables branch-based collaboration, review, and rollback of app definitions. Queries and JS objects hold the business logic layer between datasources and UI. Self-hosted via Docker or Kubernetes, with role-based access control for published apps.
Homer
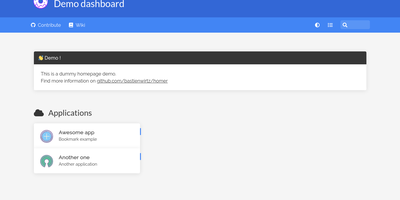
"Dead simple static HOMepage for your servER" - Homer's name is the spec. It is a fully static HTML/JS dashboard driven by one YAML file (assets/config.yml): list your services in groups with names, icons, tags, and URLs, and Homer renders a clean, fast landing page for everything you self-host. Because there is no backend, no database, and nothing to maintain, the container is tiny and effectively zero-maintenance - the entire operational surface is a text file you can version-control alongside your infrastructure. Despite the minimalism, the feature set is genuinely useful: smart cards add live data to service tiles via a type key - Pi-hole block statistics, AdGuard Home status, Jellyfin activity, Gatus and Home Assistant states, and dozens more integrations, with configurable periodic refresh. Fuzzy search jumps to any service as you type, keyboard shortcuts drive navigation, and multi-page support with item grouping keeps large homelabs organized. Theming covers built-in light and dark modes plus full custom CSS, tags get color-coded styles, and the whole dashboard installs as a PWA on phones and tablets. Icons come from Font Awesome or your own images. If Dashy is the maximalist dashboard and Homarr the drag-and-drop one, Homer is the minimalist: one YAML file, instant loads, and nothing that can break at 2 a.m.
Apache Superset
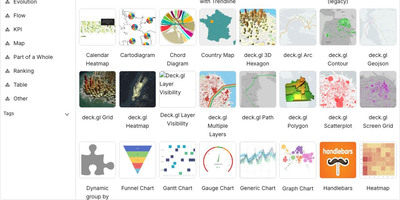
Powering data analytics at companies like Airbnb, Twitter, and Lyft where it originated, Apache Superset has become the leading open-source business intelligence platform with over 65,000 GitHub stars and an Apache Software Foundation top-level project designation. The platform ships with over forty visualization types out of the box including geographic maps, time-series charts, pivot tables, heatmaps, treemaps, and Sankey diagrams, all rendered with Apache ECharts for publication-quality output. Its SQL Lab provides a full-featured IDE experience with syntax highlighting, autocomplete, query history, and result caching for interactive data exploration. Superset connects natively to PostgreSQL, MySQL, ClickHouse, Trino, Presto, BigQuery, Snowflake, Apache Druid, Apache Hive, and dozens more databases through SQLAlchemy connectors, with support for custom database drivers via Python plugins. The semantic layer allows data teams to define calculated columns, metrics, and virtual datasets that business users can query without writing SQL. Role-based access control with row-level security enables fine-grained data governance, while the embedded analytics SDK lets you integrate dashboards directly into external applications via iframes with SSO pass-through. The caching layer supports Redis and Memcached for query result caching, and the asynchronous query execution engine powered by Celery handles long-running queries without blocking the UI. Alerts and reports can be scheduled via email or Slack with PNG or CSV attachments generated from any chart or dashboard. Running on a dedicated VPS on RepoCloud with guaranteed CPU, RAM, and SSD, full root SSH access, and a browser serial console. Apache 2.0 licensed.
LightDash
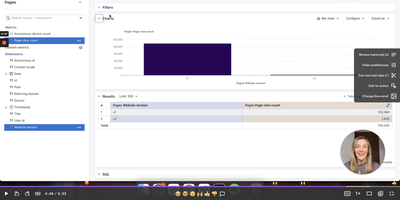
With 5,600+ GitHub stars and deep dbt integration, Lightdash is the open-source Agentic BI platform that treats analytics like software — defining metrics, dimensions, joins, permissions, and caching in a governed context layer that powers dashboards, AI agents, data apps, embedded analytics, and MCP server endpoints simultaneously. The dbt Write-Back feature lets business users create custom metrics and models in the UI, then automatically generates pull requests in GitHub or GitLab so every change flows through code review and CI validation before reaching production. Context-specific AI analysts automatically select relevant models and metrics, build queries, and present insights in plain English, while row-level security, user attributes, and customer-facing permissions ensure data governance at every layer. The platform connects to BigQuery, Snowflake, Redshift, Databricks, PostgreSQL, Trino, and ClickHouse through warehouse adapters, with the TypeScript monorepo built on React, Mantine, Vite, and TanStack Query on the frontend plus Node.js, Express, Knex, and PostgreSQL on the backend. Data teams build analytics with coding agents, preview changes from the CLI, validate in CI pipelines, and review charts and dashboards in pull requests — making the entire analytics lifecycle version-controlled and reproducible. Running on a dedicated VPS on RepoCloud with guaranteed CPU, RAM, and SSD, full root SSH access, and a browser serial console. MIT licensed.
IRONSIGHT
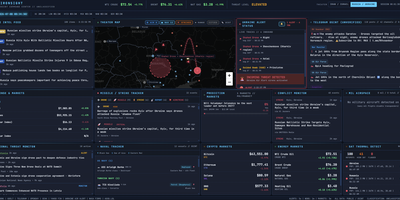
IRONSIGHT fuses over 50 publicly available intelligence sources into a single real-time dashboard that requires zero API keys and zero configuration. The Live Intel Feed aggregates 20+ RSS news sources with keyword relevance filtering from outlets including Reuters, Al Jazeera, and Kyiv Post. The Telegram OSINT module scrapes 27 channels every 60 seconds with automatic translation from Hebrew, Arabic, and Farsi. The interactive Leaflet Theater Map plots military aircraft positions via ADS-B transponder data, naval vessel locations in the Persian Gulf and Eastern Mediterranean, strike markers extracted from news and Telegram, missile trajectory arcs with range rings, and country-border overlays with a distance measurement tool. A header toggle switches the entire dashboard between Iran/Israel and Russia/Ukraine theaters, re-pointing every panel, map layer, and data feed to the selected conflict. The Israel Alert module streams live Pikud HaOref missile alerts with audio notifications, while the Conflict Monitor categorizes events into strikes, defense, diplomatic, and nuclear. Financial panels track defense contractor stocks, S&P 500, VIX, gold, Bitcoin, Ethereum, energy commodities via Yahoo Finance, and Polymarket prediction odds on conflict outcomes. NASA FIRMS satellite thermal detection flags fire and explosion signatures. The Next.js 16 App Router handles server-side data fetching for RSS and API endpoints while client-side React state management drives real-time polling updates. On RepoCloud, deploy IRONSIGHT on a dedicated VPS with persistent storage, root SSH access, and full control over your intelligence monitoring environment, all under the MIT license.
World Monitor
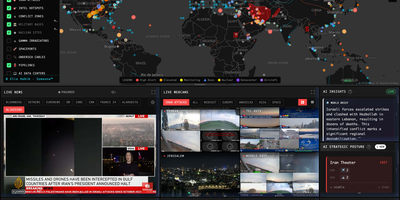
World Monitor replaces twenty or more browser tabs by fusing geopolitical, military, financial, and infrastructure signals onto a single interactive canvas built with TypeScript, Vite, globe.gl with Three.js for the 3D globe, and deck.gl with MapLibre GL for the flat map. World Monitor ingests live data from 530 upstream sources including ACLED and UCDP for conflict events, OpenSky Network for military and civilian aircraft, AISStream for vessel positions, NASA FIRMS for satellite fire detection, USGS for earthquakes, and FRED, IMF, BIS, and Finnhub for macroeconomic and market data. The Country Instability Index v8 computes real-time stress scores across 31 Tier-1 nations, while the finance radar tracks 29 stock exchanges, commodities, and cryptocurrency with a 7-signal market composite. Six specialized dashboard variants — World, Tech, Finance, Commodity, Energy, and Happy — deploy from a single codebase. AI summarization runs locally through Ollama and LM Studio integration or optionally via Groq and OpenRouter cloud providers, with Transformers.js powering browser-side inference. The platform supports 26 languages with native-language feeds and RTL layout, and provides MCP server integration for AI agent connectivity. Running on a dedicated VPS on RepoCloud with guaranteed CPU, RAM, and SSD, full root SSH access, and a browser serial console. AGPL-3.0 licensed.
Briefer
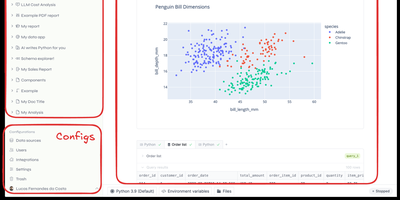
Backed by Y Combinator with 4,300 GitHub stars and growing rapidly since its September 2024 launch, Briefer delivers the first truly unified notebook-and-dashboard platform that eliminates the fragmented workflow of juggling Jupyter for analysis, Tableau for visualization, and Notion for documentation — combining all three in a single Notion-like workspace where SQL query results automatically become Python DataFrames accessible in subsequent code blocks. The built-in AI analyst understands your database schema and notebook context to generate SQL queries, write Python transformations, create visualizations, and fix errors on demand using configurable OpenAI or private LLM backends. Connect directly to PostgreSQL, MySQL, BigQuery, Redshift, Snowflake, and Amazon Athena as data sources, or upload CSV files for immediate analysis. Native point-and-click visualizations produce charts, tables, and dashboards without writing code, while interactive data apps use inputs, dropdowns, and date pickers to create parameterized reports for non-technical stakeholders. Scheduled execution runs notebooks and dashboards periodically with results delivered via Slack integration or public shareable links. Write-back queries modify production data directly from notebooks for ad-hoc pipeline testing. The architecture runs as three Docker containers — web frontend, API server, and optional AI service — backed by PostgreSQL and a Jupyter server for Python execution, deployable via single Docker command, Docker Compose, or Helm charts for Kubernetes. Running on a dedicated VPS on RepoCloud with guaranteed CPU, RAM, and SSD, full root SSH access, and a browser serial console. AGPLv3 licensed.
Metabase
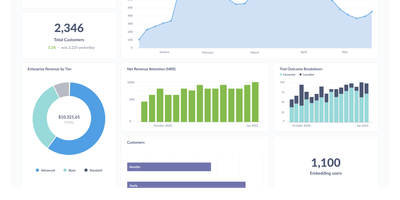
The most widely deployed open-source BI tool, Metabase is a visualization and query layer that sits on top of your existing databases without ingesting or copying data. Non-technical users ask questions through a visual query builder with drill-through menus that answer follow-ups like "broken down by month" without writing a new query, while analysts use the native SQL editor with variables and templates for complex work. Questions assemble into interactive dashboards with filters, auto-refresh, fullscreen mode, and custom click behavior, and dashboard subscriptions email or Slack scheduled reports to stakeholders. It connects to 20+ data sources including PostgreSQL, MySQL, MongoDB, SQL Server, BigQuery, Snowflake, Redshift, and ClickHouse - always querying in place, so there is no second data store to secure, sync, or pay for, and results are always current. Models and metrics let a data team define official, reusable starting points so self-service stays consistent, collections with permissions organize content, and alerts fire when a metric crosses a threshold. The practical effect is cutting the ad-hoc query queue that lands on the data team, since non-technical staff can answer their own questions. Written in Clojure, licensed AGPL, and shipped as a single JAR or Docker image with an embedded application database - a working BI instance runs before most tools finish their installer - the open-source edition has no limits on users, dashboards, or connected databases, where commercial BI platforms price per viewer as well as per creator.
Tick Stock Panel
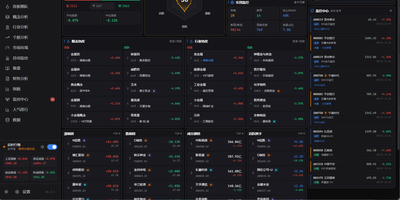
Screen equities against dozens of technical indicators, backtest algorithmic trading strategies, and spot intraday market anomalies using Tick Stock Panel, a self-hosted quantitative analysis workbench. Traders can filter entire exchanges across technical indicators including moving averages, relative strength index, and Bollinger bands with near-instantaneous execution. The platform provides a full backtesting environment where users test customized entry and exit rules, account for simulated slippage and commission fees, and review streamed performance metrics. Dedicated monitoring modules track intraday volume spikes, price breakouts, and multi-day limit streaks with automated alert dispatching to messaging channels and voice announcements. Users can explore individual stock profiles featuring multi-dimensional technical breakdowns, financial balance sheets, and automated event post-mortems generated via integrated language models. Visual factor mining tools allow analysts to discover uncorrelated signals and assemble composite portfolio screens without external database overhead. An interactive dashboard aggregates sector rotations, hot concept heatmaps, and customizable watchlists into modular operational views. Running on a dedicated VPS on RepoCloud with guaranteed CPU, RAM, and SSD, full root SSH access, and a browser serial console. MIT licensed.
Frappe Insights
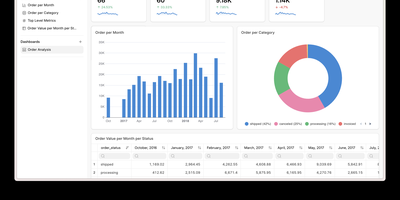
Frappe Insights delivers a self-hosted business intelligence platform where non-technical users build complex analytical queries without writing SQL. The visual query builder uses Ibis under the hood to compose optimized SQL from drag-and-drop column selections, filters, aggregations, and group-by operations — translating point-and-click interactions into performant database queries across MySQL, PostgreSQL, DuckDB, and BigQuery. The join editor provides a graphical interface for defining multi-table relationships, letting analysts connect data across schemas without understanding foreign keys or join types. The chart builder renders interactive visualizations using Apache eCharts with support for bar, line, area, pie, scatter, funnel, and pivot table chart types — each configurable with axes, colors, legends, and formatting options. Dashboards combine multiple charts into shareable views with layout customization, auto-refresh intervals, and filter propagation across widgets. Data source management handles connection pooling across multiple databases simultaneously, enabling cross-database analysis in single queries. Server scripts extend query capabilities with custom Python transformations for complex business logic that visual tools cannot express. Built on the Frappe Framework's full-stack architecture, deployment uses Docker via the official easy-install script that provisions the complete stack including MariaDB, Redis, and Nginx. Running on a dedicated VPS on RepoCloud with guaranteed CPU, RAM, and SSD, full root SSH access, and a browser serial console. AGPL-3.0 licensed.
Glance
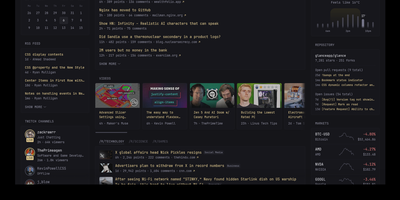
With over 35,000 GitHub stars in just two years, Glance has become the most popular self-hosted dashboard project on GitHub, outpacing established alternatives like Homarr and Homepage. Built as a single Go binary under 20MB with minimal JavaScript and zero external dependencies, Glance delivers a blazing-fast personal information dashboard that consolidates your entire digital morning routine into one beautiful page. Configure everything through clean YAML files that support modular includes and environment variable interpolation, with automatic hot-reload that applies changes without restarting the server. The widget ecosystem covers RSS and Atom feeds, Reddit and Hacker News frontpages, YouTube channel subscriptions, GitHub release timelines, weather forecasts from Open-Meteo, stock market quotes, Docker container status, Twitch live streams, calendar events via iCal, site monitor uptime checks, and custom HTML or iframe embeds. A community widgets repository extends functionality even further with user-contributed integrations. The theming system provides light, dark, and custom color schemes with multiple layout options including slim and wide column configurations. Authentication support added in 2025 secures access with username and password protection. Preconfigured page templates let you get started in seconds with curated layouts for development, homelab monitoring, news reading, and entertainment tracking. Deploy via Docker Compose or as a standalone binary on Linux, macOS, or Windows across AMD64 and ARM64 architectures. Running on a dedicated VPS on RepoCloud with guaranteed CPU, RAM, and SSD, full root SSH access, and a browser serial console. AGPL-3.0 licensed.
Redash
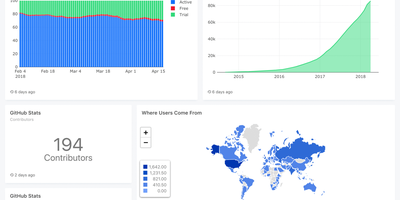
Used by millions of users at thousands of organizations worldwide and holding 29,000+ GitHub stars, Redash is the most established open-source SQL-first business intelligence tool — enabling anyone from analysts to executives to query databases, visualize results, and share dashboards without writing a single line of application code. The browser-based query editor supports SQL and NoSQL with schema browsing, auto-complete, query snippets, and parameterized queries that turn static reports into interactive data applications. Native connectors span 35+ data sources including PostgreSQL, MySQL, Amazon Redshift, Google BigQuery, Snowflake, ClickHouse, MongoDB, Elasticsearch, Databricks, Apache Presto, Microsoft SQL Server, and REST APIs — with an extensible data source API for custom integrations. Visualization types cover line, bar, area, pie, scatter, box plot, funnel, cohort, sankey, sunburst, choropleth map, and pivot tables, all draggable onto shared dashboards with cross-filtering parameters. Scheduled refreshes automatically update query results at configurable intervals, while threshold-based alerts notify teams via email, Slack, or webhook when metrics cross defined boundaries. SAML and Google OAuth SSO integration, role-based access control, API key management, and query-level permissions ensure enterprise-grade security for sensitive datasets. The self-hosted stack deploys via Docker Compose with PostgreSQL for metadata storage, Redis for job queuing, and Celery workers for background task execution. Running on a dedicated VPS on RepoCloud with guaranteed CPU, RAM, and SSD, full root SSH access, and a browser serial console. BSD 2-Clause licensed.
Dockpeek
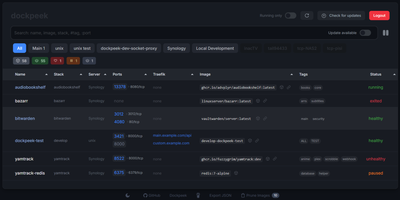
Fleet-wide container discovery, live log streaming, and Traefik reverse-proxy routing converge into Dockpeek, a lightweight Docker dashboard built for multi-host server environments. System administrators can launch web applications with one click through automatic port binding detection and integrated Traefik label parsing that extracts public routing hostnames directly from container configurations. The platform monitors multi-host environments through encrypted Docker socket proxies, letting operators inspect running containers, query published network ports, and trigger image updates from a unified control panel. Native Docker Swarm integration auto-detects active cluster managers, mapping swarm services and replicated tasks alongside standalone workloads while flagging degraded service replicas. Built-in log inspectors stream stdout and stderr outputs in real time with line-filtering controls to diagnose crashed services without opening remote SSH terminals. Operators can track image registries for newer digest tags, review pending updates across container fleets, and trigger graceful rolling container recreations directly from the dashboard. Running on a dedicated VPS on RepoCloud with guaranteed CPU, RAM, and SSD, full root SSH access, and a browser serial console. MIT licensed.
ILLA Builder
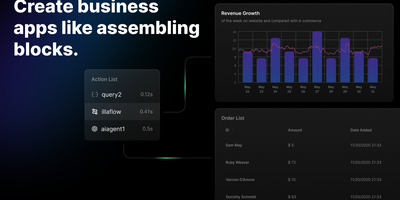
ILLA Builder turns internal tool development from weeks of custom frontend work into hours of drag-and-drop assembly, combining a visual canvas of 60+ UI components with direct connections to over 20 data sources. The TypeScript frontend, powered by ILLA Design, offers data grids backed by MUI X Data Grid Premium, charts, forms, rich-text editors, PDF viewers, QR code scanners, calendar widgets, map embeds, and video players. Each component supports Handlebars-style expression bindings that reference query results, widget state, or global variables, while the reactive execution tree resolves dependencies in topological order and re-evaluates downstream properties whenever upstream values change. Data connectors provide GUI-driven access to PostgreSQL, MySQL, MongoDB, MSSQL, Supabase, Redis, Firebase, CouchDB, Airtable, Google Sheets, Stripe, AWS S3, Hugging Face models, and REST or GraphQL endpoints without writing connector code. Real-time collaboration through WebSocket lets multiple developers edit the same application simultaneously with live cursor tracking and synchronized Redux state. ILLA Flow adds workflow automation triggered by schedules or webhooks, chaining actions across data sources. The Go backend handles application state, resources, and attribute-based access control using PostgreSQL for persistence, Redis for caching, MinIO for file storage, and Envoy for API ingress. Deploys as a single Docker container on port 2022 or scales horizontally on Kubernetes. Running on a dedicated VPS on RepoCloud with guaranteed CPU, RAM, and SSD, full root SSH access, and a browser serial console. Apache 2.0 licensed.
Ghostfolio
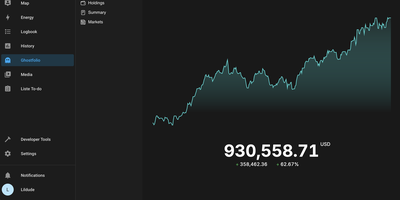
Stocks, ETFs, crypto, bonds, precious metals, and cash across every account and currency, in one privacy-first dashboard: Ghostfolio is open-source wealth management software. The deliberate design decision is no brokerage linking: positions enter by manual entry, CSV import, or the REST API, so your holdings never pass through a data aggregator. Performance is measured as return on average investment across Today, WTD, MTD, YTD, 1Y, 5Y, and Max timeframes, with benchmark comparison against indices like the S&P 500, dividend tracking, and allocation breakdowns by asset class, region, and sector. A static X-ray analysis flags concentration and other portfolio risks, and a FIRE calculator projects progress toward financial independence. Multi-currency support converts holdings using historical exchange rates, market data comes from Yahoo Finance and CoinGecko among other pluggable providers, and everything exports back out as CSV or JSON. Built with Angular and NestJS on PostgreSQL and Redis, shipped as Docker images for amd64 and ARM, with a mobile-first PWA interface, dark mode, and a distraction-free Zen mode. AGPL-licensed.
Chartbrew
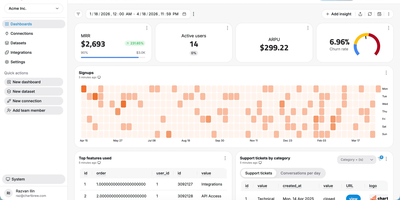
Chartbrew transforms raw database queries and API responses into polished, shareable dashboards without requiring a data engineering team. Connect to MySQL, PostgreSQL, MongoDB, Firestore, or any REST API, then build datasets using the visual query editor with syntax highlighting and auto-completion. Charts render through Chart.js with line, bar, pie, donut, radar, polar, KPI card, and table visualizations, each customizable with colors, legends, filters, and goal indicators. An AI assistant accelerates dashboard creation by generating queries and suggesting chart configurations from natural language descriptions of the metrics you want to track. Reusable datasets let teams prepare data transformations once and share them across multiple charts, while automatic scheduling through BullMQ and Redis refreshes data at intervals from every 10 minutes to monthly. The embed feature generates standalone chart URLs for insertion into external websites, internal tools, or customer portals, and the Reporting API enables programmatic dashboard management and automated report delivery. Team workspaces with role-based permissions control who can view, edit, or manage data connections. Nearly 4,000 GitHub stars reflect steady community adoption. The platform runs on Node.js with Express and Sequelize ORM, supporting MySQL or PostgreSQL as its application database. Running on a dedicated VPS on RepoCloud with guaranteed CPU, RAM, and SSD, full root SSH access, and a browser serial console. FSL-1.1-MIT licensed (converts to MIT two years after each release).
Homepage
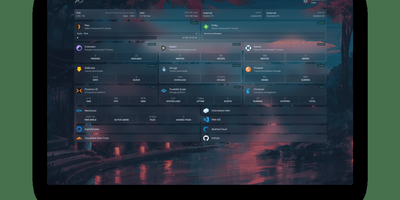
With over 31,000 GitHub stars and 430 contributors, Homepage has become the definitive self-hosted dashboard for homelab enthusiasts and server administrators who want a single, elegant landing page for all their services. The dashboard renders as a fully static site at build time for instant page loads, while a Node.js backend securely proxies all API requests to prevent exposing service credentials to the browser. Docker integration automatically discovers running containers through label-based configuration, populating the dashboard with service status indicators, health checks, and real-time statistics without manual URL entry. Over 100 native service widgets display live data from popular applications including Plex, Jellyfin, Radarr, Sonarr, Home Assistant, Pi-hole, Portainer, Proxmox, Nextcloud, Gitea, and dozens more, each showing relevant metrics like active streams, download queues, or system health directly on the dashboard. Information widgets provide weather forecasts, system resource utilization, search bars, and date/time displays. The layout system supports multiple columns, tabs, and custom CSS for pixel-perfect arrangement of service groups and bookmarks. Built-in authentication options include OIDC integration and password protection. Quick search functionality enables instant access to bookmarks and services with keyboard shortcuts. Internationalization covers 40+ languages with community-maintained translations. Configuration lives entirely in YAML files for version-controlled, reproducible dashboard setups. Deploy on a dedicated VPS on RepoCloud with guaranteed CPU, RAM, and SSD, full root SSH access, and a browser serial console for complete control. GPL-3.0 licensed with an active community and bi-weekly releases.