Categories
Documentation DevOps Tools Service Discovery Start Page Service Directory Homelab DashboardStars
Forks
Watchers
Developer links
Compass
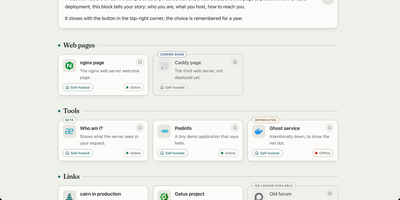
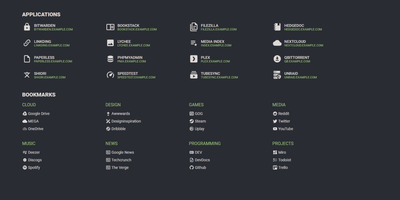
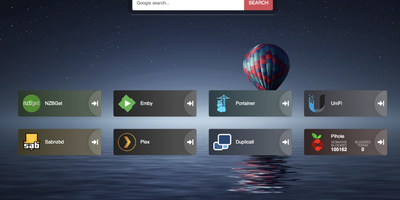
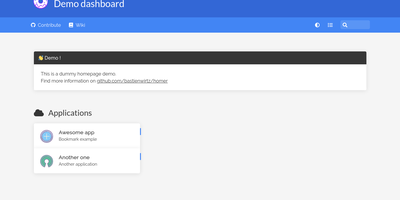
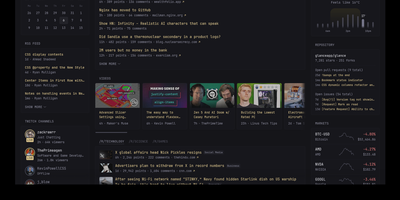
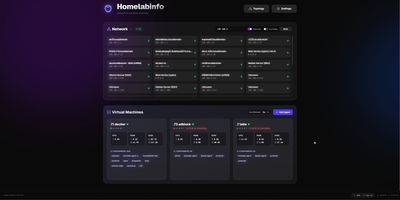
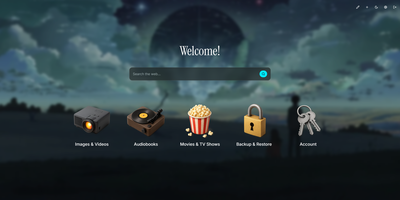
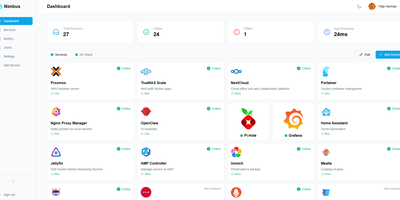
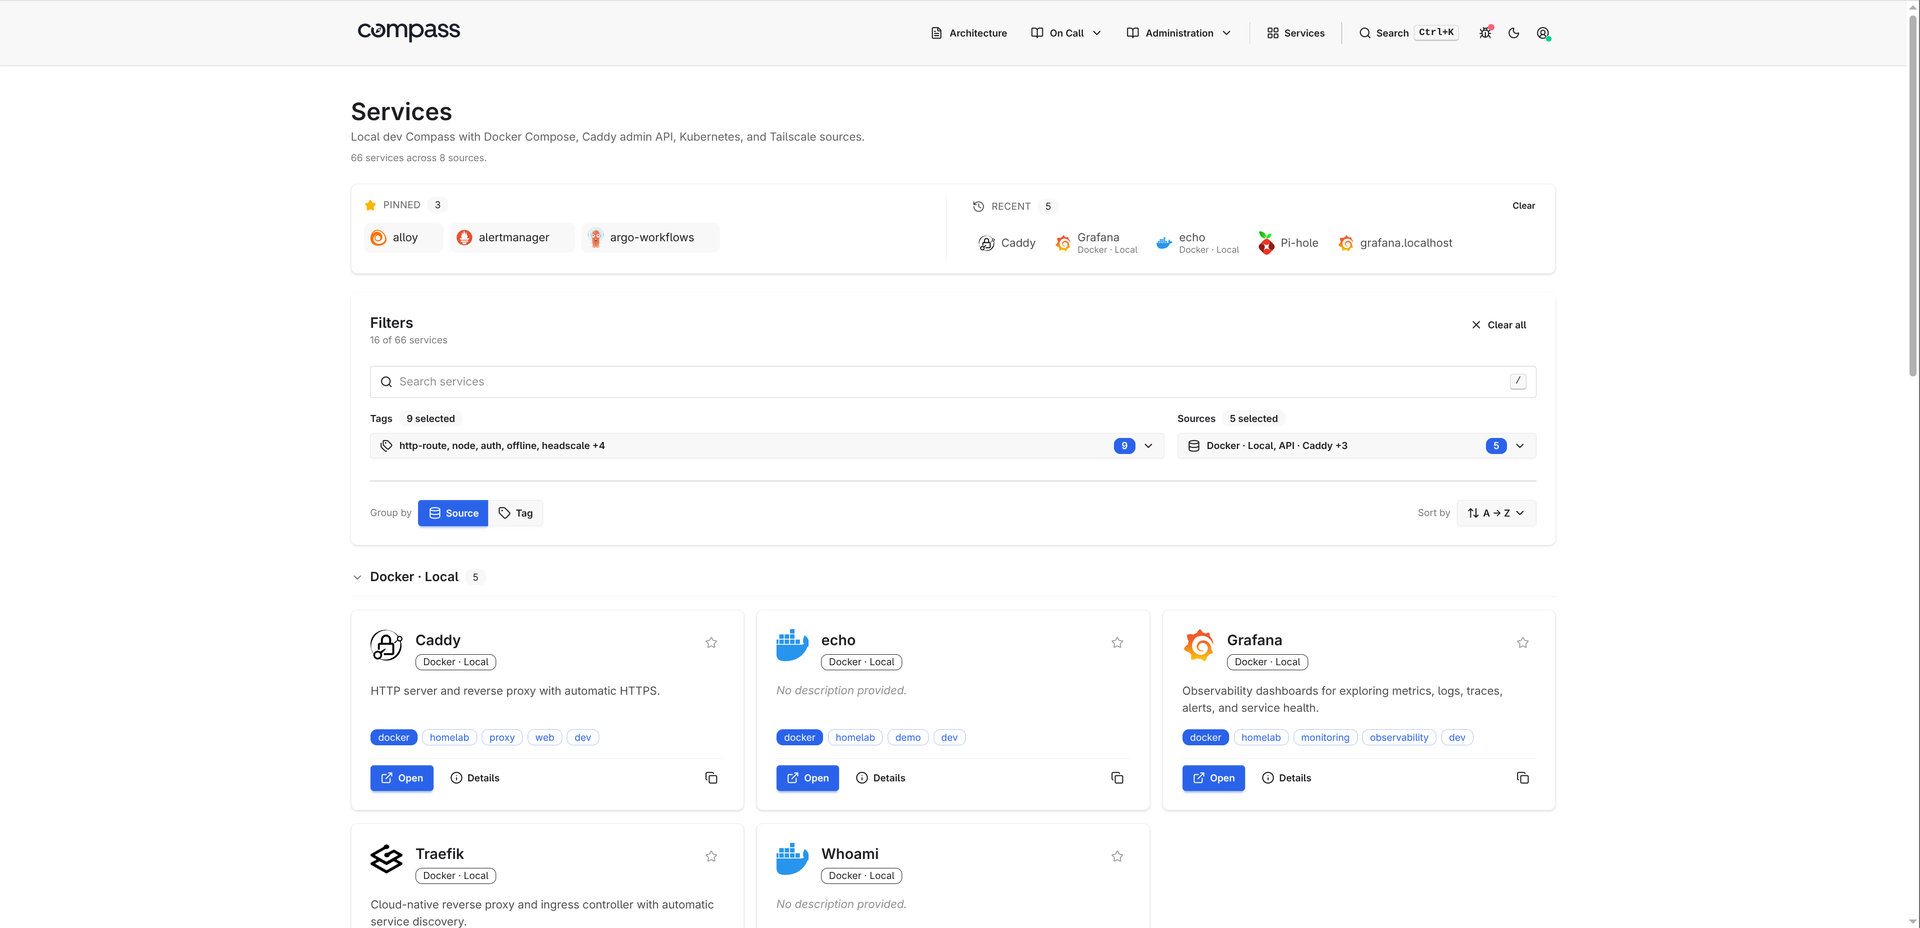
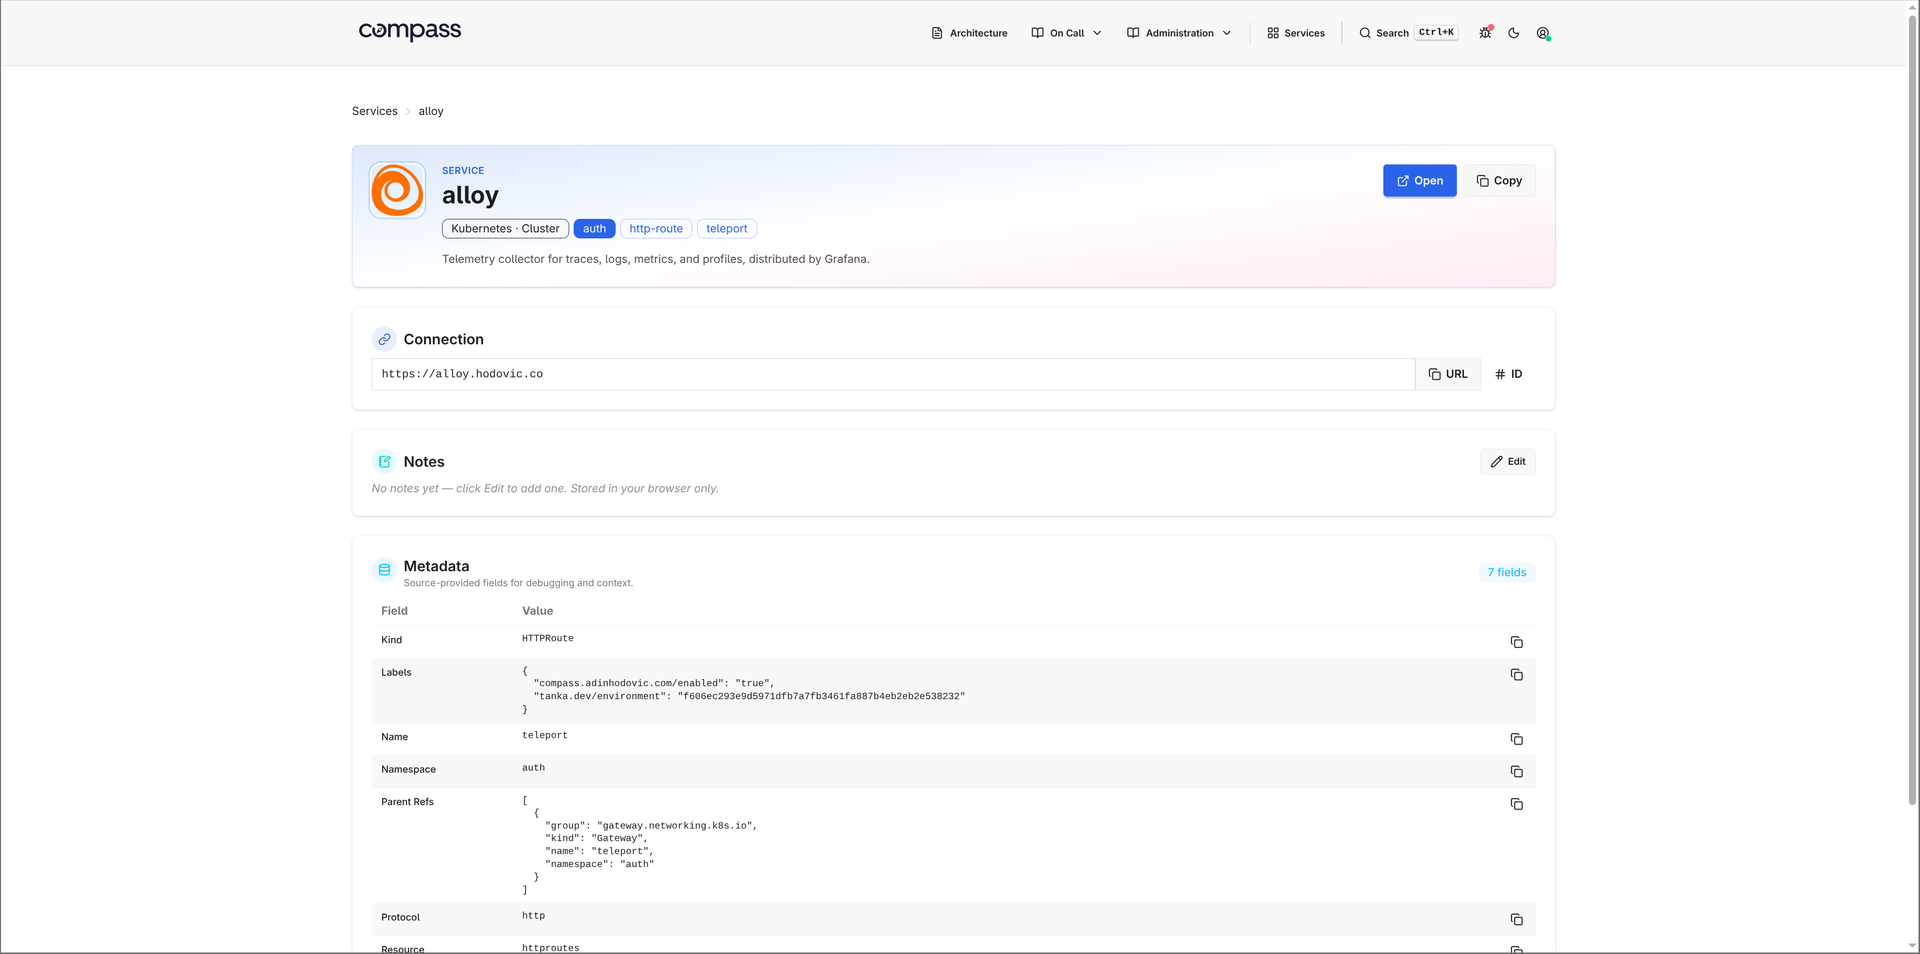
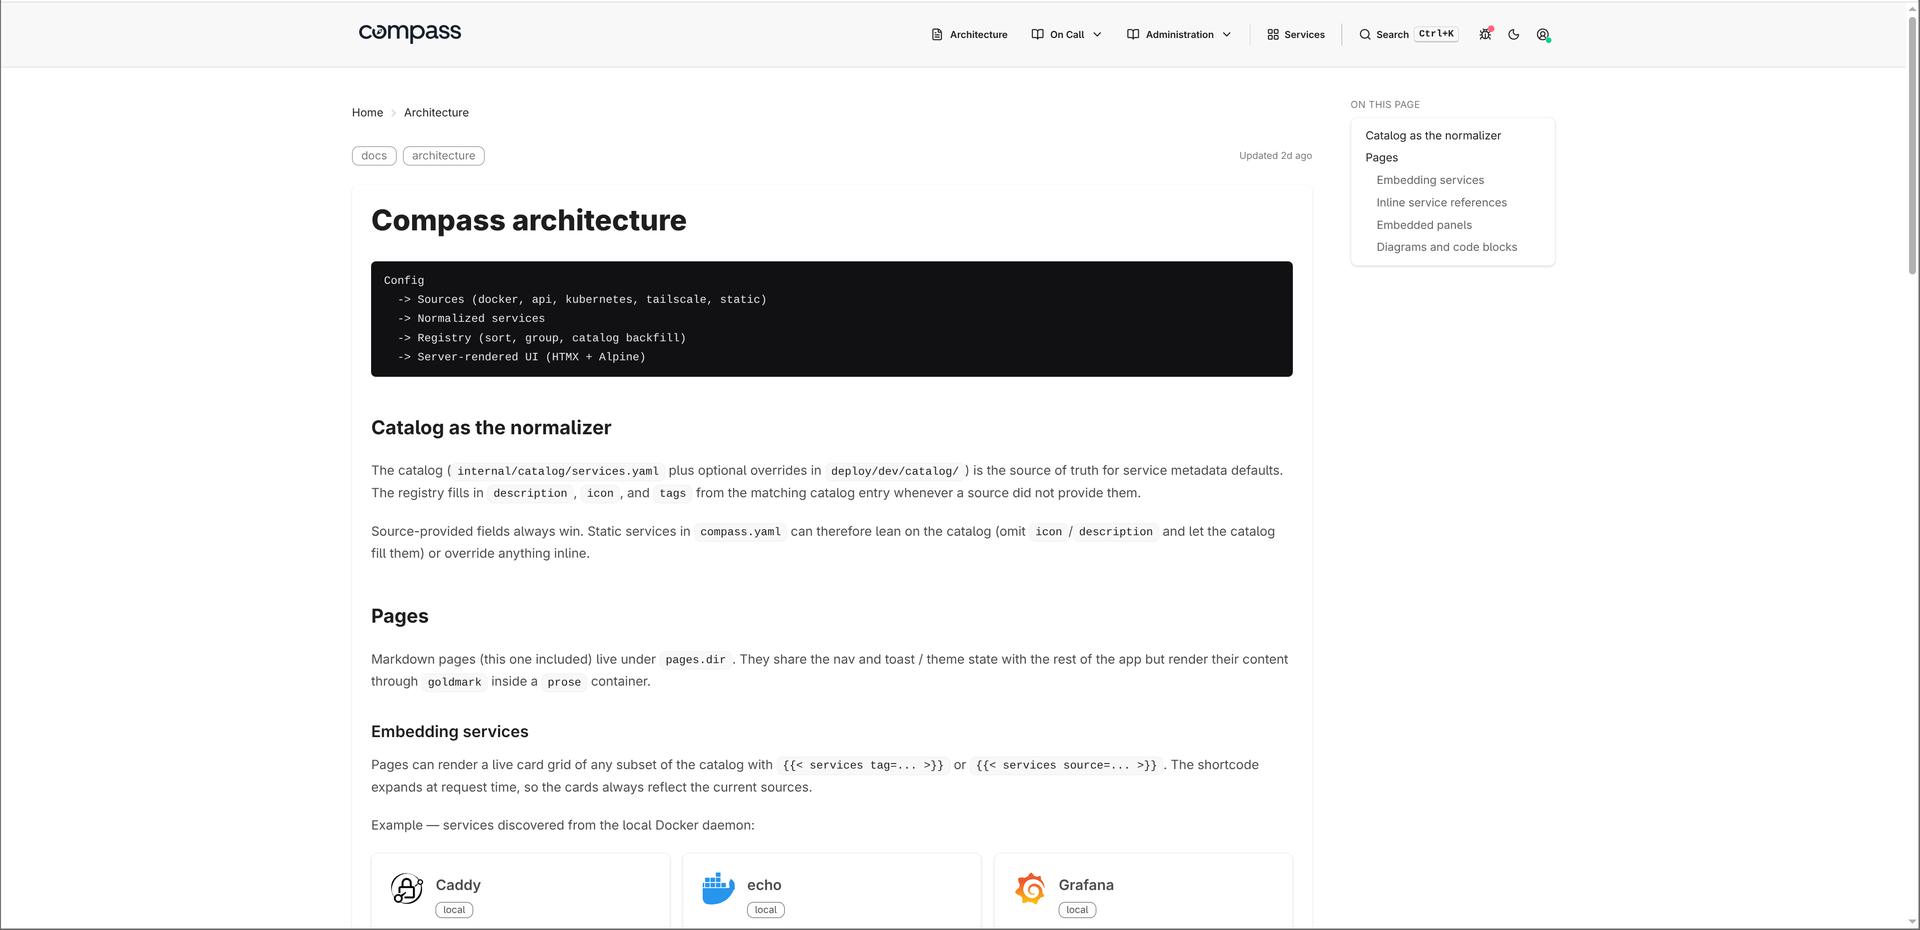
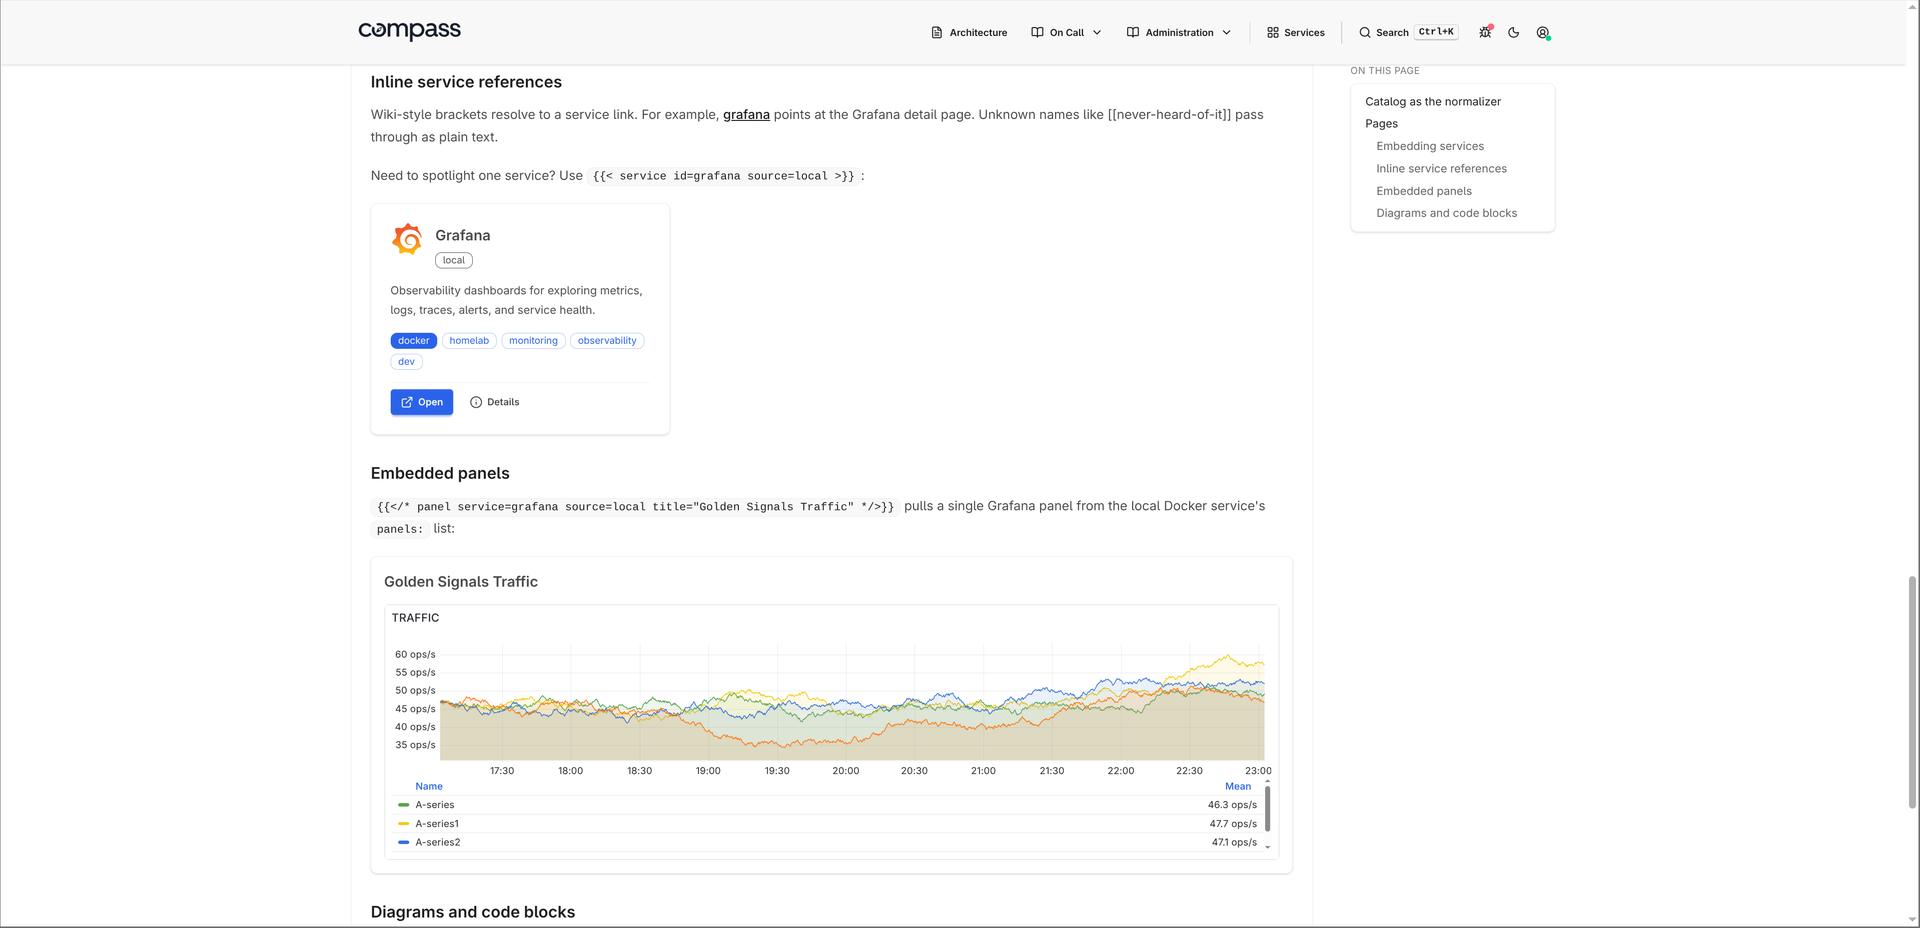
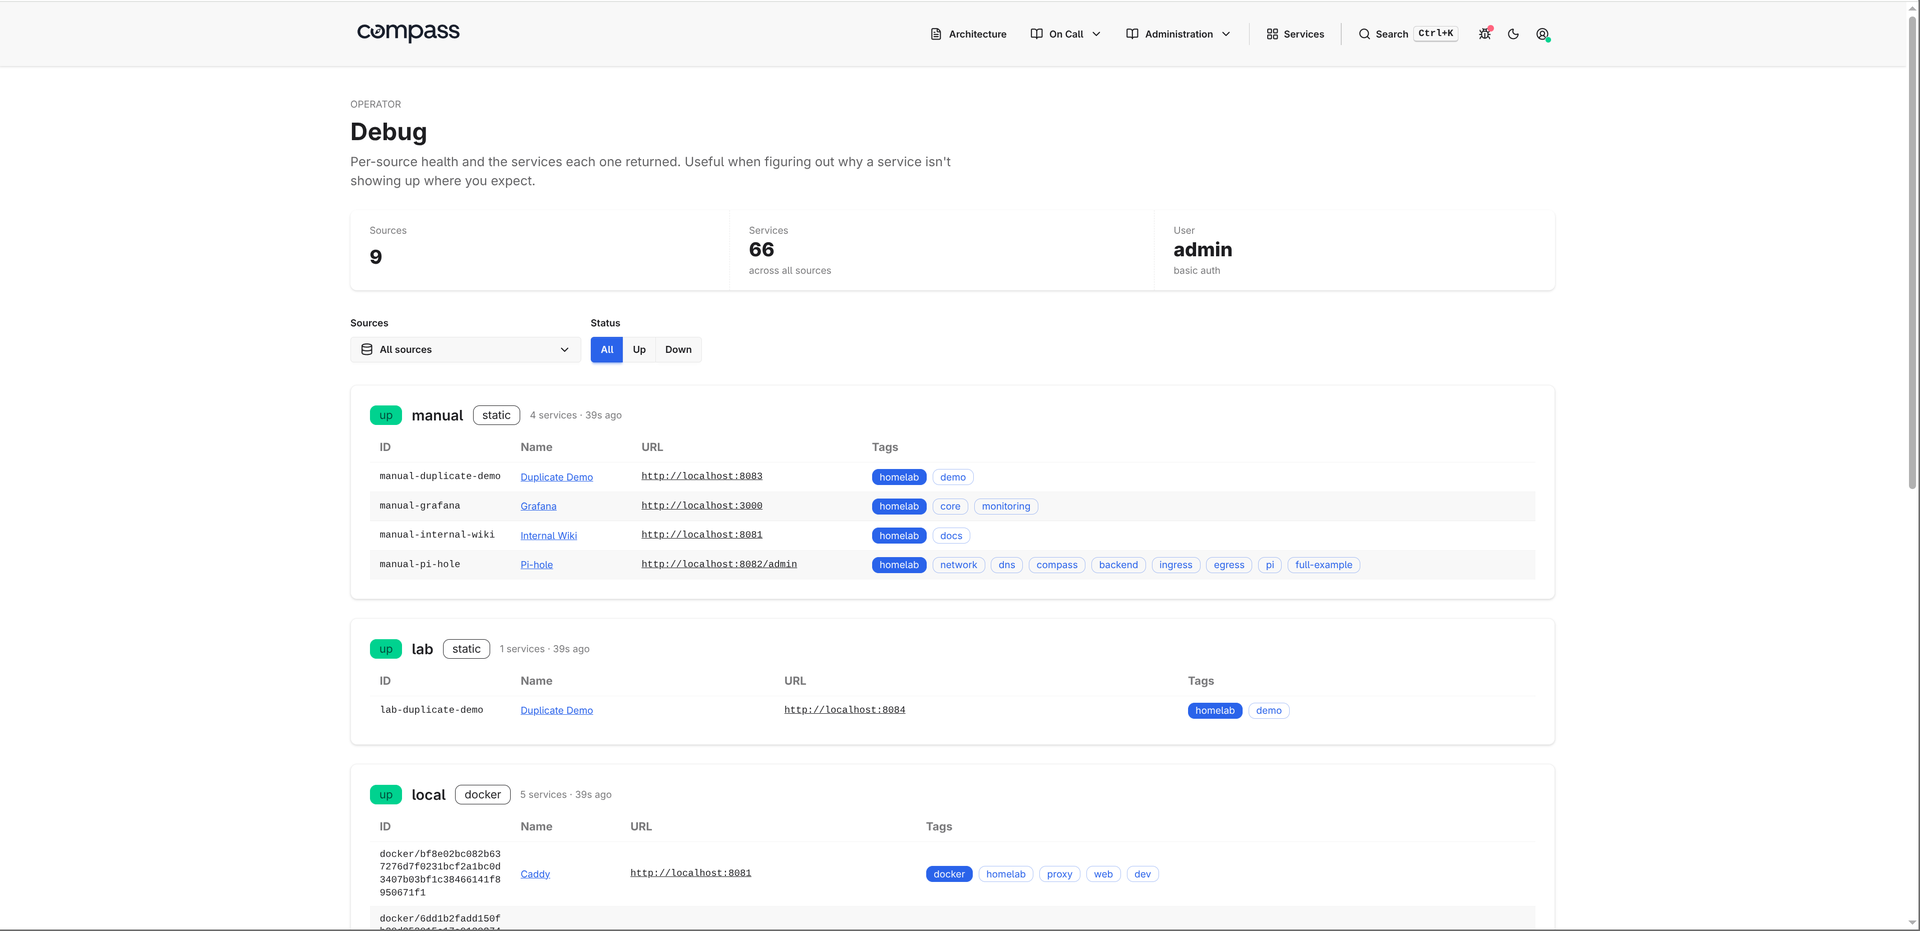
Every homelab outgrows the browser bookmark folder, and Compass answers by building the front page for you, discovering your services automatically instead of asking you to maintain cards by hand. Point it at Docker, Kubernetes, Tailscale, Headscale, NetBird, DNS records, a JSON API, or a plain static list, and it renders everything it finds as a searchable directory with icons, descriptions, and tags filled in from a catalog when a source leaves them blank. Each card shows whether the service is actually up, using the Prometheus or Gatus monitor you already run, and pinned and recent services keep daily tools one click away. Opening a service reveals its connection details, source metadata, extra links such as runbooks and health endpoints, and panels you embed from Grafana. Markdown pages live beside the directory, so architecture notes and on-call runbooks sit in the same navigation, with live service cards and charts embedded directly inside the prose. A debug view shows per-source health, what each source returned, and why a service you expected is missing, while group-based access decides which sources each person can see. Running on a dedicated VPS on RepoCloud with guaranteed CPU, RAM, and SSD, full root SSH access, and a browser serial console. Apache License 2.0 licensed.
Benefits
- A Directory That Maintains Itself
- Services appear and disappear as Docker containers, Kubernetes resources, and tailnet nodes change, so the landing page stays accurate without anyone editing a list of cards by hand.
- Status On Every Card
- Up and down state comes from the Prometheus, Gatus, or JSON status endpoint you already run, so visitors see whether a service works before they click through to it.
- Documents Beside The Services
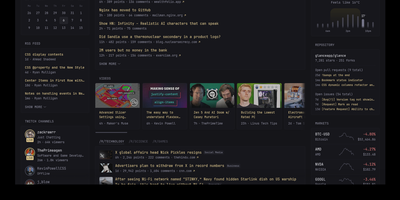
- Markdown pages for architecture, runbooks, and on-call notes render in the same navigation, and can embed live service cards and Grafana panels that always reflect current sources.
- Debug Why Something Is Missing
- A per-source debug view shows health, refresh times, discovered services, and the exact reason a service was filtered or dropped, ending the guesswork when the page looks wrong.
Features
- Automatic Service Discovery
- Sources for Docker, Kubernetes, Tailscale, Headscale, NetBird, DNS service discovery, JSON APIs, and static YAML feed one normalized registry without manual card upkeep.
- Catalog Metadata Backfill
- When a source omits a description, icon, or tags, a built-in catalog fills them in, and inline overrides in the configuration win whenever you disagree.
- Live Status Providers
- Prometheus, Gatus, or any JSON endpoint you already operate supplies up and down status shown on cards, detail pages, and search results across the directory.
- Markdown Pages With Embeds
- Files dropped in a pages directory become navigation entries that can embed live service cards, wiki-style service references, and single Grafana panels in the text.
- Group-Based Source Access
- Each source can require membership in named groups from basic auth or forwarded headers, hiding sensitive services from people who should not see them.
- Operator Debug And API
- A debug route reports per-source health and discovery decisions, while a JSON API returns the current normalized service registry for your own tooling.