Stars
Forks
Watchers
Developer links
Perses
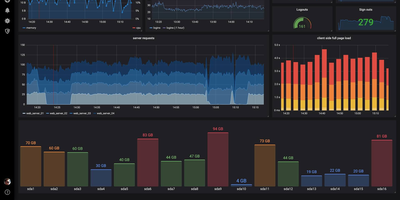
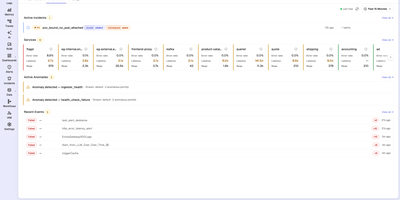
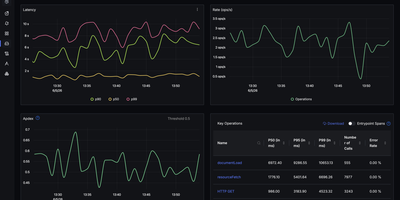
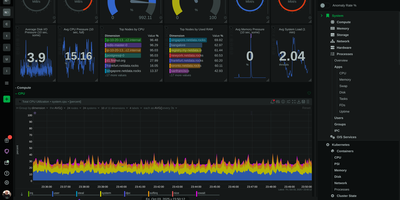
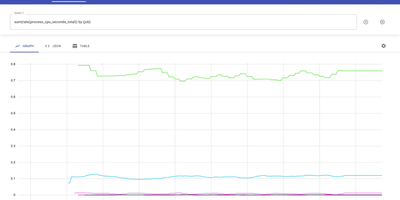
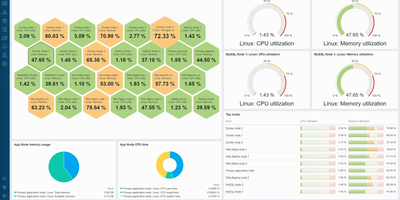
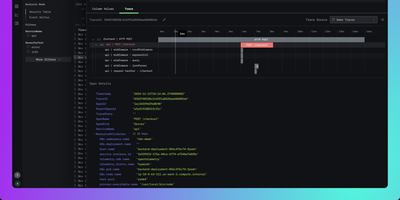
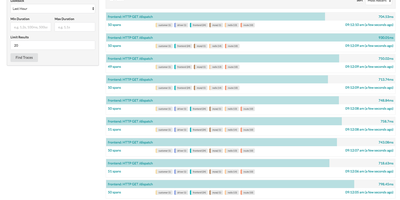
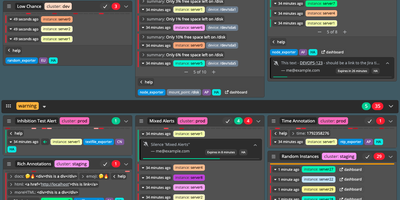
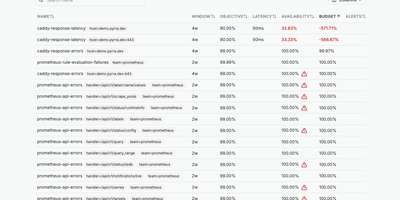
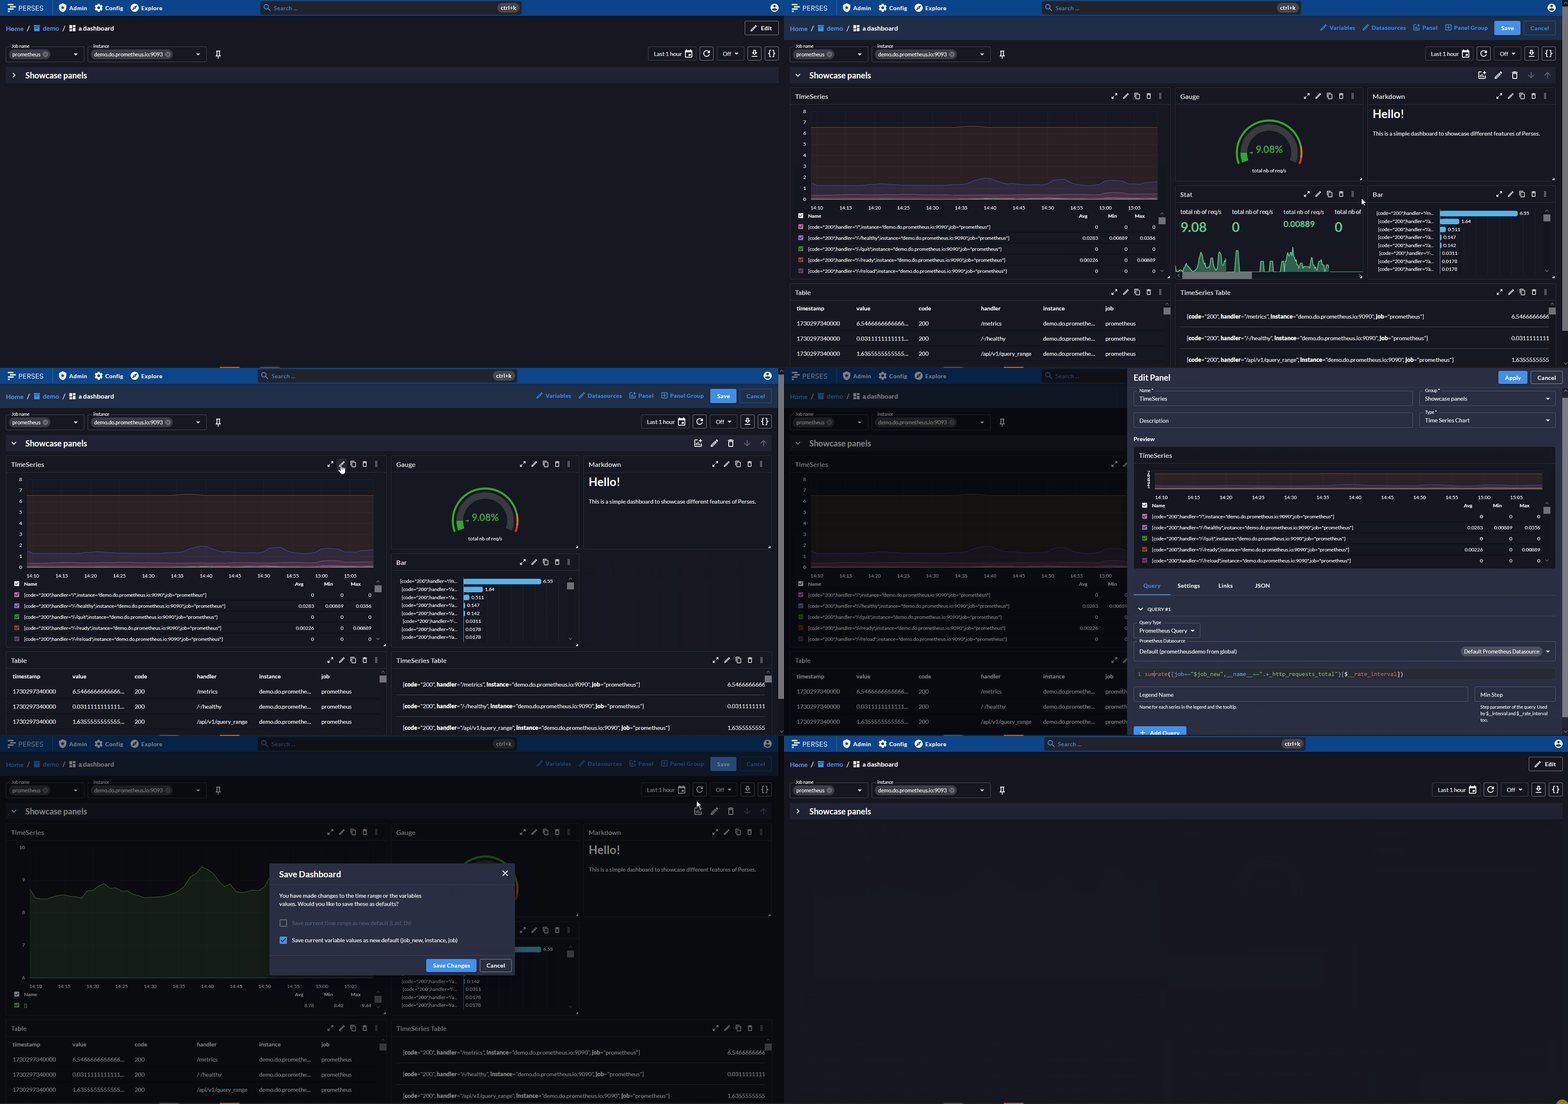
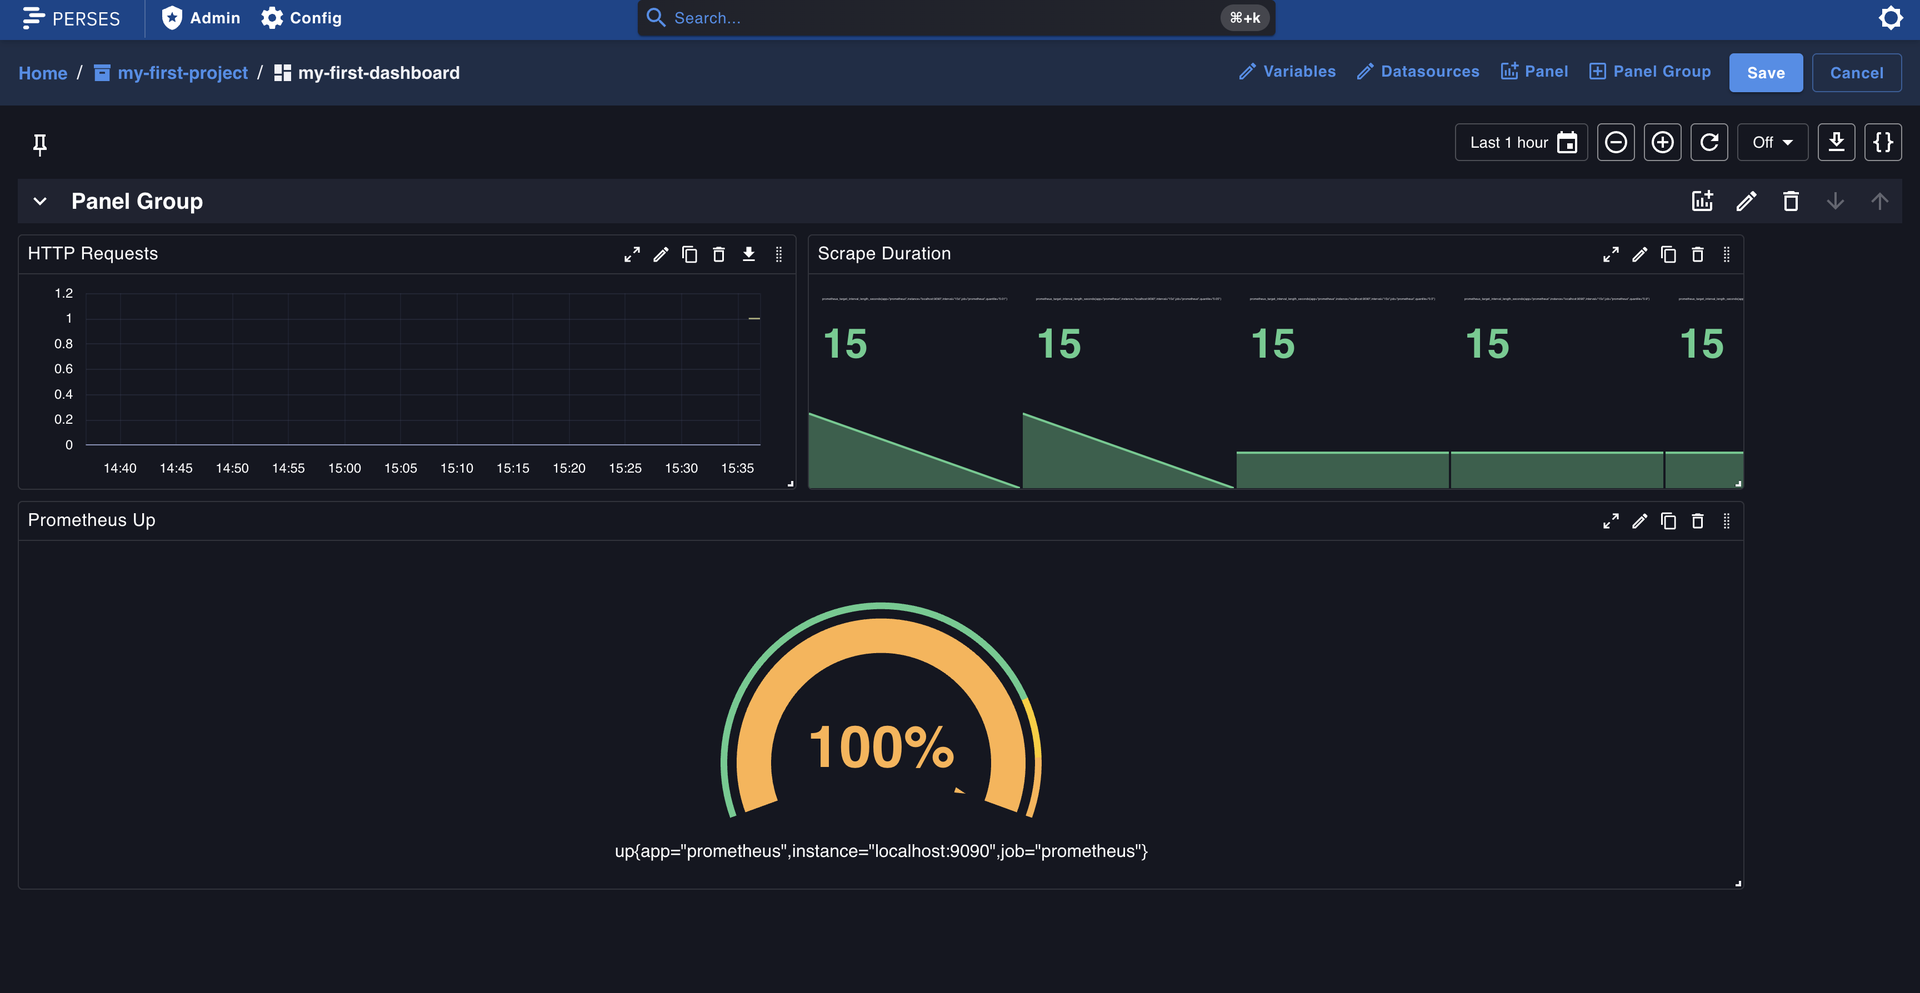
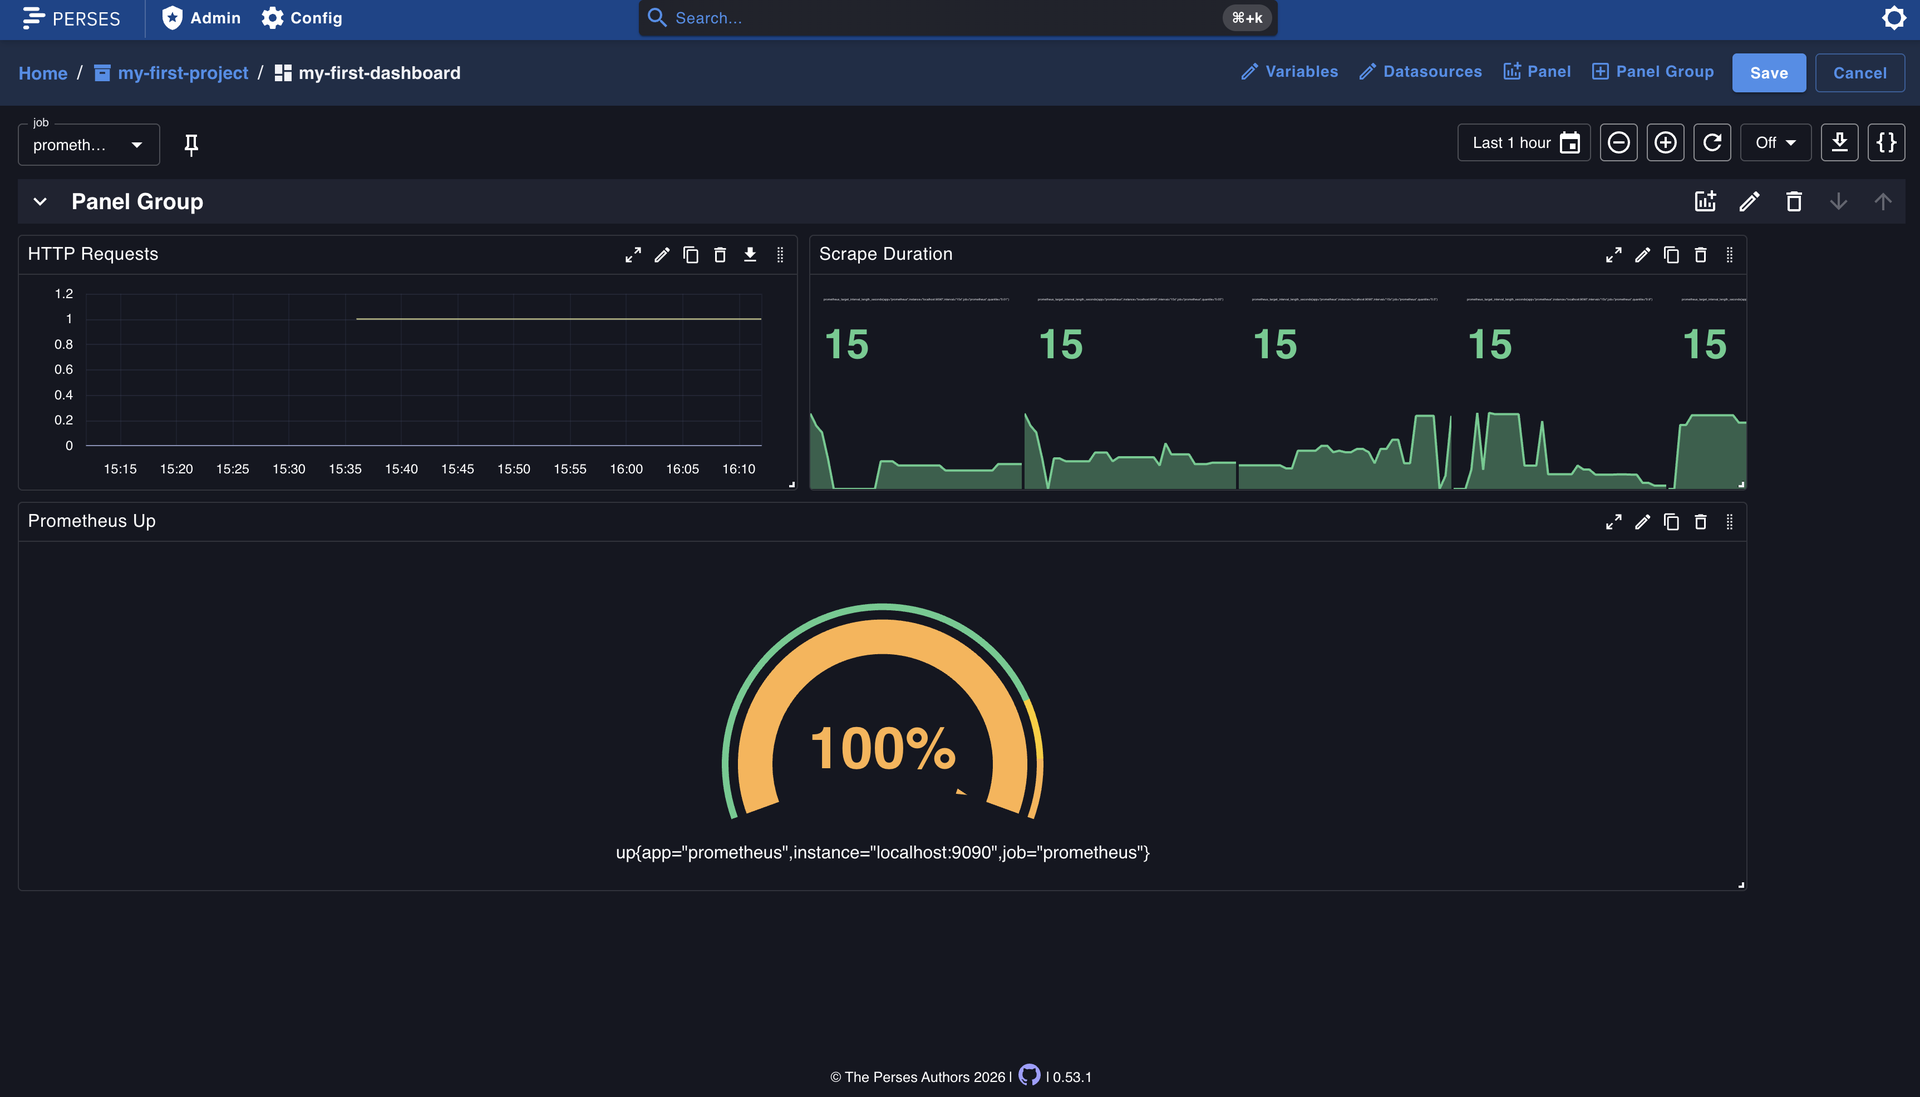
Dashboards stop being screenshots of someone's browser and start being code your team reviews. Perses is an open-source dashboard platform for observability data, displaying Prometheus metrics, Tempo traces, Loki logs, and Pyroscope profiles in one interface, with more datasources arriving through plugins. Teams build dashboards in the visual editor, organising panels into groups with variables that retarget every chart at a new job, instance, or environment; the same dashboards can be written with Go or Cue SDKs, validated in CI, and applied through the CLI or API, so a hundred services keep a hundred consistent dashboards under version control. Projects organise ownership, role-based access controls who can edit what, and authentication connects to the identity provider you already run. Because the dashboard model is an open specification, definitions stay portable instead of locked in one vendor's JSON dialect, and the panel libraries can even be embedded inside your own product's interface. A Kubernetes operator mode stores dashboards as custom resources inside application namespaces, so the team that owns a service owns its dashboard next to its deployment. Time ranges, refresh controls, and explore views make it as useful during an incident as it is as long-lived documentation of how a system behaves. Running on a dedicated VPS on RepoCloud with guaranteed CPU, RAM, and SSD, full root SSH access, and a browser serial console. Apache-2.0 licensed.
Benefits
- Dashboards Under Version Control
- Go and Cue SDKs, static validation, and a CLI make dashboards reviewable code in pull requests, ending the era of production dashboards nobody can reproduce or roll back.
- Four Signals, One Surface
- Metrics, traces, logs, and profiles sit in the same dashboard through Prometheus, Tempo, Loki, and Pyroscope plugins, so an incident needs one tab, not four tools.
- An Open Dashboard Specification
- Dashboard definitions follow a published model rather than a vendor dialect, keeping years of observability work portable as tooling and teams change around it.
- Embeddable In Your Product
- Published packages let developers mount Perses panels and dashboards inside their own interfaces, reusing the editor and rendering work instead of rebuilding charts.
Features
- Visual Dashboard Editor
- Panel groups, time-series, gauge, and stat panels, plus variables that retarget entire dashboards by job, instance, or environment, all edited in the browser.
- Plugin Datasource Architecture
- Prometheus, Tempo, Loki, and Pyroscope ship as core plugins, and external plugins add datasources and panel types without forking the platform.
- Projects And Access Control
- Resources organise into projects with role-based permissions and authentication providers, giving platform teams per-team ownership of dashboards and datasources.
- Kubernetes Operator Mode
- Dashboards and datasources can be stored as custom resources in application namespaces and reconciled by the Perses operator alongside deployments.