Marketing Dashboard
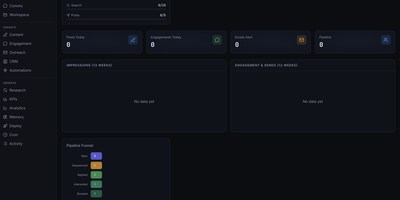
This is a marketing operations control center that replaces fragmented CRM, outreach, content, and analytics tools with a unified self-hosted interface designed for AI agent-assisted go-to-market teams. The CRM module manages leads through a configurable pipeline funnel with stages from New through Sequenced, Replied, Interested, and Booked, tracking source attribution, industry segments, company size, lead quality scores, and LinkedIn URLs per contact. Outreach sequencing supports email campaigns with pause controls, audit endpoints, suppression workflows, and engagement tracking. The content operations surface provides calendar views, content item management, performance metrics, and approval queues for editorial control. Analytics and KPI dashboards show impressions, engagement, and send volumes over configurable time periods, with optional connectors to Plausible, Google Analytics 4, X, and LinkedIn for cross-platform reporting. The OpenClaw-native agent runtime enables dynamic agent and squad discovery, workspace management, session monitoring, and communications surfaces. Automation scheduling uses cron job templates with OpenClaw-compatible schedule variants including cron expressions, every intervals, and at timestamps. The tech stack combines Next.js 16 App Router with React 19, Tailwind CSS 4, Recharts, and Zustand for state management. Authentication supports session cookies, API keys, and optional Google OAuth with role-based access controls. All state persists locally in SQLite via better-sqlite3 with no required external infrastructure. On RepoCloud, deploy Marketing Dashboard on a dedicated VPS with persistent SQLite storage, root SSH access, and complete control over your marketing operations data, all under the MIT license.
Parseable
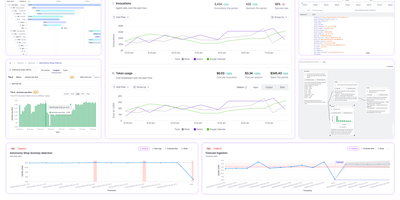
Parseable replaces expensive Elasticsearch clusters and fragmented monitoring stacks with a single Rust binary that ingests, queries, and stores logs, metrics, and traces on commodity object storage at a fraction of the cost. The data lake architecture decouples stateless compute from S3-compatible storage, enabling independent scaling of ingestion throughput and query capacity while cutting storage costs by up to 90% compared to indexed alternatives. OpenTelemetry-native OTLP ingestion accepts telemetry from existing OTel collector pipelines, Prometheus Remote Write endpoints, Kafka consumers, eBPF probes, and popular logging agents including Fluentd, Fluent Bit, and Vector without proprietary format conversions. The SQL-first query interface enables cross-signal analysis across all telemetry types, while native PromQL support with 50+ functions and 12 aggregation operators provides Prometheus-compatible metrics querying that works directly with Grafana dashboards. Built-in features include customizable dashboards, real-time alerting with Webhook, Slack, and Alertmanager targets, role-based access control, OpenID single sign-on integration, LogIQ automatic unstructured-to-structured log transformation, smart caching for frequently accessed data, and retention policies for lifecycle management. AI-powered Keystone Q&A provides natural language to SQL conversion and dataset summarization. All data stored as standard Apache Parquet on object storage remains accessible to any Parquet-compatible engine (DuckDB, Spark, Trino), ensuring zero vendor lock-in. Deploys on AWS S3, Azure Blob, Google Cloud Storage, MinIO, Wasabi, and DigitalOcean Spaces. Running on a dedicated VPS on RepoCloud with guaranteed CPU, RAM, and SSD, full root SSH access, and a browser serial console. Apache 2.0 licensed.
Traggo
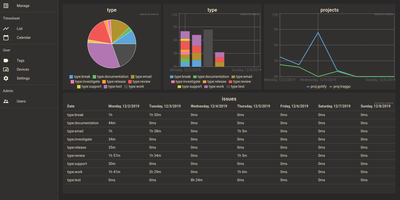
With over 1,600 GitHub stars and a design philosophy that fundamentally rethinks how time tracking should work, Traggo abandons the traditional project-task hierarchy that forces your work into rigid categories and instead lets you tag time spans with arbitrary key-value pairs — project:website, type:coding, client:acme, billable:yes — enabling cross-dimensional analysis that conventional trackers cannot replicate. The Go backend compiles into a single binary that runs alongside a SQLite database and embedded web UI in under 10MB total, consuming approximately 50MB of RAM at runtime and starting in seconds on even the smallest VPS. Tags are the fundamental data model: create any tag key with any set of values, then apply multiple tags to each time span simultaneously to track by project, client, task type, energy level, or any other dimension your workflow demands. Customizable dashboards render pie charts, bar charts, and line graphs from tag-aggregated data, letting you visualize time distribution across any combination of dimensions over configurable date ranges. The calendar view displays time spans as colored blocks across days and weeks, while the list view provides chronological entry browsing with inline editing. Multiple themes including light and dark modes adapt the interface to personal preference, and simple user management with role-based access supports small team deployments. Docker deployment runs a single container exposing port 3030 with multi-architecture support for amd64, arm64, and arm v7. Running on a dedicated VPS on RepoCloud with guaranteed CPU, RAM, and SSD, full root SSH access, and a browser serial console. GPL-3.0 licensed.
Meteroid
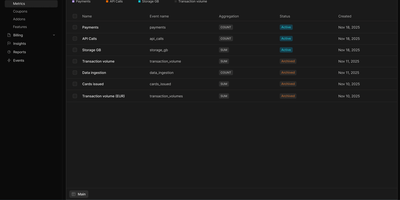
Meteroid delivers the billing infrastructure that SaaS companies need when Stripe Billing gets too rigid and building in-house gets too expensive. The Rust backend ingests usage events via REST API or Kafka with deduplication by event ID and customer ID, storing time-series data in ClickHouse for sub-second aggregation queries across billions of events. Billable metrics transform raw events — API calls, compute time, tokens, storage, transactions — into accurate charges using configurable aggregation functions, dimensions, and filters without pre-aggregation. The plan builder supports any pricing structure: flat rate, per-unit, tiered graduated, tiered volume, package, and hybrid combinations with multiple price components per plan. Versioned plans enable pricing changes without affecting existing subscribers through grandfathering, while experiments let you A/B test pricing with controlled rollouts. Subscription management handles the full lifecycle — creation, upgrades, downgrades, mid-cycle proration, scheduled changes, and cancellation with configurable grace periods. The TypeScript frontend provides a complete web dashboard for managing customers, plans, subscriptions, invoices, and revenue analytics with MRR tracking, churn analysis, and cohort insights. Automated invoice generation handles complex scenarios including usage-based line items, credits, discounts, and tax calculations with PDF rendering. Stripe Connect integration enables payment collection directly through the platform. Running on a dedicated VPS on RepoCloud with guaranteed CPU, RAM, and SSD, full root SSH access, and a browser serial console. AGPL-3.0 licensed.
DAC
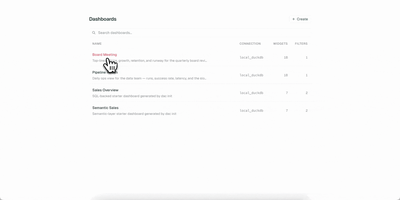
Your dashboards deserve version control, code review, and reproducible builds, just like the rest of your stack. DAC lets you define interactive data dashboards in YAML or TSX, validate them in CI, and serve them from a single Go binary that embeds a full React frontend. Choose from 21 chart types including line, bar, area, pie, scatter, bubble, funnel, sankey, heatmap, calendar, sparkline, waterfall, gauge, treemap, radar, and candlestick, plus metric cards, data tables, text blocks, and image widgets. The built-in semantic layer lets you define metrics and dimensions once in reusable model files, then reference them from any widget while DAC generates the SQL automatically. Connect to Postgres, MySQL, Snowflake, BigQuery, Redshift, Databricks, and DuckDB through standard Bruin connection configs. Interactive filters with date pickers, dropdowns, multiselects, and search inputs inject values via Jinja templating and re-execute only affected widgets. Live reload via Server-Sent Events refreshes connected browsers instantly when you save a file. Export dashboards as self-contained static HTML with baked-in query results for S3, GitHub Pages, or offline sharing, and render slide decks via the Google Slides export command. On RepoCloud, deploy DAC on a dedicated VPS with root SSH access and persistent storage for your dashboard definitions and database connections under the AGPL-3.0 license.
TradingAgents GUI
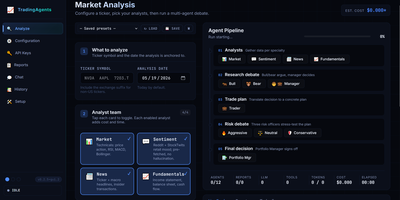
Built atop the TauricResearch TradingAgents framework with nearly 100,000 GitHub stars, TradingAgents GUI transforms a CLI-only multi-agent LLM stock analysis pipeline into a polished web application accessible at localhost:5000. The system deploys twelve specialized AI agents — fundamental analysts, sentiment experts, technical analysts, bull and bear researchers, a trader, risk management team, and portfolio manager — who collaboratively debate market conditions through structured LangGraph workflows before producing a final BUY, SELL, or HOLD recommendation. The interface supports ten LLM providers including OpenAI, Anthropic, Google, OpenRouter, DeepSeek, Ollama, xAI, Qwen, GLM, and MiniMax, with a first-run wizard that auto-detects configured API keys and tests connections. A live pipeline visualization shows each agent's status with real-time progress bars, while the tabbed output area separates Live Feed, Reports preview, and Tool calls into dedicated panes. The three-pane Reports tab provides searchable indexing, table-of-contents navigation, and export to Markdown, HTML, or PDF formats. Report length control across Concise, Standard, and Comprehensive modes saves up to 50% on token costs. Multi-session chat allows pinning past reports as grounding context with live token counting and context-window warnings. Three built-in themes — Terminal, Modern, and Bloomberg — persist per browser. Docker Compose deployment maps port 5000 with persistent report storage. Running on a dedicated VPS on RepoCloud with guaranteed CPU, RAM, and SSD, full root SSH access, and a browser serial console. Apache 2.0 licensed.