Highlight
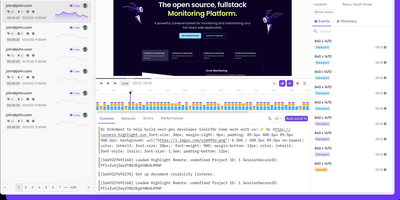
With over 9,000 GitHub stars and a focus on developer experience over legacy monitoring complexity, Highlight.io delivers a unified observability platform that correlates frontend user behavior with backend performance data in a single interface. The session replay engine captures high-fidelity DOM recordings showing exactly what users experienced, including console logs, network requests, page transitions, and user interactions, with configurable privacy redaction for sensitive content. Error monitoring automatically groups and deduplicates errors, surfaces affected user sessions, and provides full stack traces with source map support for minified production code. The logging pipeline ingests structured and unstructured logs from any backend service with automatic property extraction, full-text search, and configurable alerting thresholds. Distributed tracing tracks request flows across microservices with embedded links to associated sessions, errors, and logs for complete request lifecycle visibility. The metrics system collects custom application metrics alongside built-in web vitals and performance data for trend analysis and anomaly detection. Search across all telemetry types uses a unified query language with automatic attribute discovery and saved views for recurring investigations. Integrations connect with Slack, Discord, Linear, Jira, Vercel, and dozens of other developer tools for notification routing and workflow automation. SDKs cover React, Next.js, Vue, Angular, Python, Go, Ruby, Java, PHP, and Elixir with framework-specific instrumentation. Self-hosted deployment runs via Docker Compose with ClickHouse for analytics storage. Running on a dedicated VPS on RepoCloud with guaranteed CPU, RAM, and SSD, full root SSH access, and a browser serial console. Apache 2.0 licensed.
Fail2Ban UI
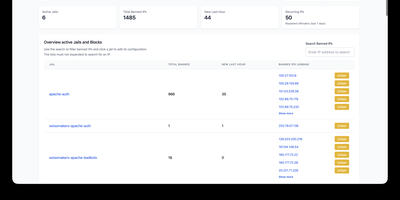
Manage Fail2Ban on every Linux server from one browser dashboard instead of logging into each host to check jails and unban addresses. The dashboard lists active jails and banned IPs and updates live as bans and unbans arrive, while one search box finds an address across every jail of every server so you can unban it in the right place. Servers connect through a local socket, key-based SSH, or a lightweight HTTP agent, and each one shows Healthy, Degraded, or Down status. Jails and filters are edited in the browser, with log path tests, a regex debugger that runs sample log lines through a filter, and a configuration check before Fail2Ban reloads. Ban Insights draws a zoomable ban and unban timeline, compares two incidents to expose repeat attackers, exports IP lists as CSV or JSON, and maps countries on an interactive 3D globe. Recurring offenders can be blocked permanently on MikroTik, pfSense, OPNsense, or UniFi Network firewalls. Alerts go out by email, webhook for ntfy, Slack, Mattermost, or Telegram, or Elasticsearch, filtered by country, and clicking any IP opens AbuseIPDB or AlienVault OTX reports. Sign-in works through Keycloak, Authentik, Pocket ID, or any OIDC provider, and the interface speaks nine languages. Running on a dedicated VPS on RepoCloud with guaranteed CPU, RAM, and SSD, full root SSH access, and a browser serial console. AGPL-3.0 licensed.
Munin
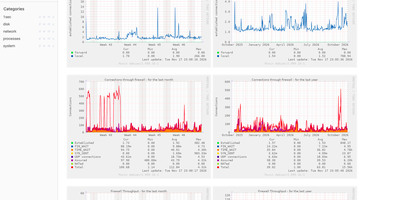
Point Munin at your computers, and this plug-and-play monitoring tool graphs what they are doing, keeps the history, and serves it all in a web interface. A central master polls a small agent on every host every five minutes. That works for a home Raspberry Pi and for a cluster of more than 100 nodes. A default install switches on a large set of plugins on its own. Load, disk, network, and process graphs start filling in with no setup per metric. Plugins are standalone executables that answer a config call with metadata and a plain call with values. Plain shell scripts count. Computers, networks, SANs, applications, even weather measurements: all graphable. The project gallery lists more than a thousand community-supported plugins. No agent on a device? SNMP plugins fetch its values remotely. With supersampling, selected plugins record readings every ten seconds. Every data field can carry warning and critical ranges. Cross one, and Munin can send email, write to syslog, run any script, or notify Nagios or Icinga. Graphs are drawn on demand through CGI or FastCGI. They are grouped by host and category, with hour, day, week, month, and year views side by side. Several masters can watch the same nodes, each keeping its own data. A rewritten node agent covers machines that cannot run the standard one. Running on a dedicated VPS on RepoCloud with guaranteed CPU, RAM, and SSD, full root SSH access, and a browser serial console. GPL-2.0 licensed.
Pipedash
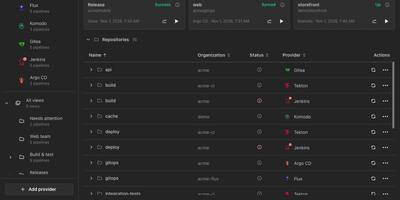
Pipedash unifies pipelines from twelve CI/CD providers into one self-hosted dashboard for watching statuses, reading job logs, and triggering, rerunning, or cancelling runs without opening each provider's site. Connect GitHub Actions, Gitea Actions, GitLab CI, Azure DevOps, Bitbucket, Buildkite, Jenkins, Tekton, ArgoCD, FluxCD, Komodo, or Prow, and every workflow lands in one list grouped by repository. Filters narrow by status, provider, organization, or time range, and saved views with rules, sub views, and pins give each team its own shortlist. Run history records each attempt with its commit, branch, actor, and duration, and opening a run reveals its jobs and a searchable log viewer that streams live output. Trigger forms load the workflow's own inputs, pipeline variables, or job parameters from the provider, so parameterized runs start with real values. Reruns reuse the original inputs, GitHub runs can restart only failed jobs, and stuck builds can be cancelled singly, in bulk, or by repository. Metrics charts track duration, success rate, and run counts per pipeline by hour, day, week, or month with P95 and P99 values. A notifications inbox gathers failures, degraded workloads, long running builds, and provider outages, while health panels place status pages beside the pipelines they describe. Every dashboard action is a REST API route under /api/v1 with bearer authentication, provider tokens stay encrypted at rest, and the server sends no telemetry. Running on a dedicated VPS on RepoCloud with guaranteed CPU, RAM, and SSD, full root SSH access, and a browser serial console. GPL-3.0 licensed.
ReadyLLM
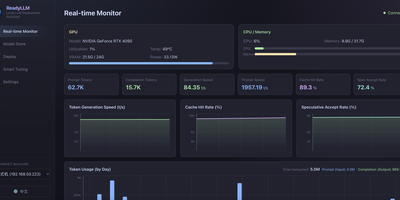
Your inference server should not sit mostly idle while a model crawls along at ten tokens per second, so ReadyLLM gives you a visual way to deploy, watch, and tune LLMs until the hardware is actually earning its keep. Add the machine under your desk or a remote box over SSH, let hardware detection read its GPU, VRAM, CPU, and memory, and get model recommendations that fit what you own instead of wishful downloads. A model store catalogs text, image, and video models with parameter counts, precision, resolutions, and real weight filenames, background downloads from multiple sources, and integrity checks when they land. One click starts or stops llama.cpp, vLLM, or SGLang services, installs a missing engine matched to your GPU backend, and leaves runtime parameters open for manual tweaks. Live curves track GPU utilization, memory, throughput, and latency as requests flow. When speed disappoints, two-phase auto tuning searches the knobs that matter, checks VRAM feasibility before it wastes your time, and benchmarks honestly against latency, throughput, or prefill goals; an AI tuning mode can reason through the same loop across several rounds. Beyond chat models, ComfyUI generation covers text-to-image and text-to-video, storyboards, shot-by-shot long video, and upscaling, with prompts optionally expanded first. Running on a dedicated VPS on RepoCloud with guaranteed CPU, RAM, and SSD, full root SSH access, and a browser serial console. MIT licensed.
Supercheck
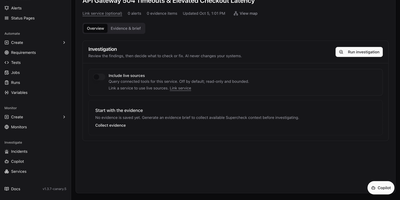
Browser tests, load tests, uptime checks, public status pages, and an AI incident investigator all live in one self-hosted dashboard called Supercheck. Write browser, API, database, custom, and k6 performance tests in a built-in code editor, or record a flow with the Chrome and Edge Recorder extension and save it as a Playwright script. Group tests into scheduled jobs, trigger them from CI with trigger keys, and review run logs, screenshots, traces, and reports. Five monitor types cover HTTP endpoints, website SSL expiry, ping, TCP and UDP ports, and scheduled synthetic browser journeys, with administrator-defined check locations and alerts to email, Slack, Discord, Telegram, Microsoft Teams, or webhooks. Status pages publish component health with 90-day uptime, incidents, scheduled maintenance, badges, and subscriber notifications under a subdomain or custom domain. When something breaks, the incident workspace collects evidence, drafts an evidence brief, and runs a read-only AI investigation across connectors such as GitHub, Prometheus, Grafana, and Kubernetes, while Copilot answers questions about that evidence. Requirements link expectations to tests and show coverage, and AI can extract them from a PRD. Organizations, projects, six roles, API keys, and audit trails keep teams in their lanes, and the CLI pulls, diffs, and deploys resources as code. Running on a dedicated VPS on RepoCloud with guaranteed CPU, RAM, and SSD, full root SSH access, and a browser serial console. AGPL-3.0 licensed.

PH Intercept
A blocklist working silently in the background is hard to appreciate, so PH Intercept turns your DNS traffic into a live arcade battle: every allowed query flies by as a friendly ship, and every blocked query spawns as an invader your interceptor shoots down. It streams query events live from the API of your existing Pi-hole v6, AdGuard Home, or Technitium server, so the battle on screen is your network's real traffic the moment it happens. Repeat domains level up on screen: friendly shuttles grow into heavy transports and gold capital ships, while blocked domains mutate from crab invaders into orange drones and purple bosses. The interceptor hunts by itself, launching a support drone at five on-screen threats and a second at ten, and it swaps among seven selectable ships, from the Falcon and the Enterprise to the Normandy. The bottom HUD doubles as a control panel: pause blocking for ten seconds, thirty seconds, or five minutes with a synced countdown, watch totals climb, and trigger a gravity list update in place. Client and domain labels can ride beneath each entity, noisy domains disappear through regex ignore patterns, a second DNS server can join in split-screen two-player mode, and viewer settings persist per browser. The backdrop ranges from a starfield plotted from about 12,200 real stars to nebula, synthwave, and custom image modes. Running on a dedicated VPS on RepoCloud with guaranteed CPU, RAM, and SSD, full root SSH access, and a browser serial console. MIT licensed.
Bencher
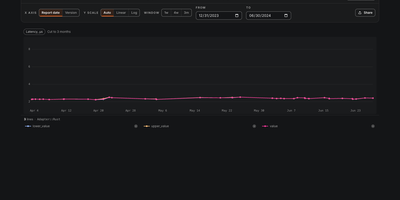
Bencher keeps a continuous record of your benchmark results and flags performance regressions in its web console before they merge into your main branch. Keep the benchmarks you already have: the bencher CLI runs your harness, collects its output through adapters for tools including Criterion, Iai, pytest-benchmark, Go benchmarks, and hyperfine, and ships the numbers to your server. Run the same command on your laptop and in CI, so a pull request compares against a baseline built by the same measurement pipeline instead of a fresh guess. The console plots every benchmark across branches, testbeds, and measures, turning months of runs into lines you can read at a glance. Set thresholds on any measure and Bencher applies statistical tests to separate a genuine slowdown from ordinary machine noise. When a result crosses a threshold, an alert fires and the CI run can fail, so the regression conversation happens on the pull request rather than in production. History stays queryable through the API and console, so you can pin down when a specific function got slower and which change did it. Self-host the Console and API servers with Docker next to the code they measure, and keep every result on machines you control. Running on a dedicated VPS on RepoCloud with guaranteed CPU, RAM, and SSD, full root SSH access, and a browser serial console. Apache-2.0 or MIT licensed.
LAN Sheriff
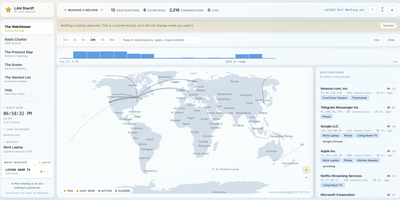
Self-hosted and account-free, LAN Sheriff watches where your devices send their traffic, plots each destination on a live world map, and flags anything that looks suspicious. Click a destination on the Watchtower for its country and city, owning organization, reverse DNS, protocol, port, byte counts, duration, and responsible app or device; filter by device, app, country, organization, or protocol, or scrub back through history. Radio Chatter streams the DNS lookups it can see, surfaces first-seen domains, and labels tracker, ad, telemetry, and malware domains without ever blocking them. The Precinct Map diagrams observed traffic, while the Roster inventories every device by IP, MAC, manufacturer, hostname, inferred type, and services, and alerts you when an unrecognized one joins. The Wanted List applies eight rules, including beaconing, machine-generated domains, port scans, plaintext credentials, and volume anomalies, and explains each finding in a plain sentence rather than a mystery score. Deputy Mode needs no privileges and names the application behind each connection, while Patrol Mode adds packet capture for DNS lookups and traffic volumes. Pair installations with a code to widen your view, export any view as CSV or JSON, and send alerts to webhook, ntfy, Discord, or Slack. Running on a dedicated VPS on RepoCloud with guaranteed CPU, RAM, and SSD, full root SSH access, and a browser serial console. AGPL-3.0 licensed.
Pinpoint
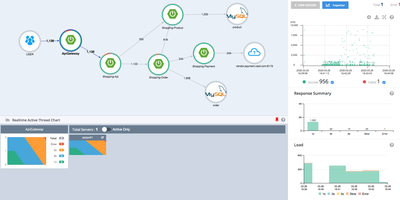
When checkout slows to a crawl somewhere across forty services, Pinpoint draws you the map of what is actually talking to what and where the time went. The ServerMap renders your whole topology live: services, databases, message queues, and external APIs as nodes whose edges carry transaction counts and error rates, so the unhealthy dependency announces itself visually. Click a node and the scatter chart plots every request against its response time; drag across the suspicious cluster and the CallStack opens those exact transactions at code level, method by method, SQL statement by SQL statement, until the bottleneck has nowhere to hide. The Inspector watches each application's CPU, memory, garbage collection, TPS, and JVM arguments, while realtime active-thread charts show stuck work as it happens. Agents attach to Java, PHP, and Python applications without changing a line of code, and applications already instrumented with OpenTelemetry send their traces straight in over OTLP. Group applications into services so each team sees its own Service Map, then arm alarm templates for slow counts, error rates, and thread saturation before users notice. Error Analysis gathers exceptions and error logs grouped by route, and URI metrics rank your hottest endpoints by cost. Running on a dedicated VPS on RepoCloud with guaranteed CPU, RAM, and SSD, full root SSH access, and a browser serial console. Apache-2.0 licensed.
Nimbus
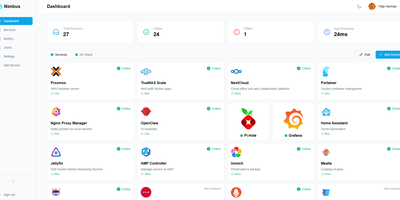
Nimbus is a self-hosted homelab dashboard that turns your scattered pile of services into a polished, organized command center with real-time health monitoring for every endpoint you care about. The dashboard displays live status cards for each registered service, tracking response times down to the millisecond and graphing uptime history so you can spot degradation before it becomes an outage. Health checks run on configurable intervals with smart self-signed certificate handling, meaning your internal services with self-issued TLS do not trigger false alarms. Multi-user support comes standard: local accounts authenticate via JWT, while OAuth2 integration with Google, GitHub, and Discord lets team members sign in with existing credentials. Role-based access control and a built-in admin panel give you granular authority over who sees what. Each user personalizes their view with custom backgrounds, light or dark mode, accent color themes, and drag-and-drop service tile arrangement. Services group into named categories and cards resize to fit your preferred layout, with both grid and list view modes available. Prometheus metrics export feeds your existing Grafana stack, and webhook notifications alert you instantly when a service goes offline. Custom service icons upload directly or auto-fetch from the Dashboard Icons collection. Zero-config Docker deployment gets you running in under 30 seconds with a single docker-compose command. Running on a dedicated VPS on RepoCloud with guaranteed CPU, RAM, and SSD, full root SSH access, and a browser serial console. AGPL-3.0 licensed.
Telescope
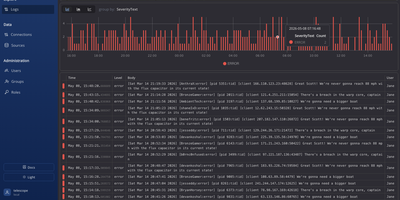
Four log stores should not mean four tools open during an outage, and Telescope is a web log viewer that explores ClickHouse, StarRocks, Docker, and Kubernetes logs in one place. Connect multiple sources, decide which fields each one exposes, mark fields as suggested or hidden, and enable autocompletion so everyday lookups start with structured filters rather than query syntax. When filters are not enough, drop into raw SQL with full WHERE expressions, choose the columns and formatting you want, and narrow results with a time selector that understands relative ranges. Group logs by any field, including nested JSON, map, and array values, and read the interactive chart to spot spikes and anomalies without hand-writing aggregation queries. Save the filter combinations your team reaches for during incidents, share those views, and jump straight to the logs that matter next time. Control who sees what with per-source user and group permissions, GitHub authentication with organization checks, and role-based access for querying. Collapse the sidebar into focus mode when the screen should belong to log lines alone, whether you are chasing container output locally or production records at scale. Running on a dedicated VPS on RepoCloud with guaranteed CPU, RAM, and SSD, full root SSH access, and a browser serial console. MIT licensed.
NUT WebGUI
When the power blinks at 3 a.m., NUT WebGUI is the page that tells you whether the UPS in the closet is coasting or dying, without a serial cable in sight. Point it at one or several Network UPS Tools servers and it polls charge, load, input voltage, and estimated runtime, refreshing critical status every couple of seconds while background variables update on a calmer thirty-second cadence. The dashboard renders device cards, gauges, sparklines, and a topology view of how units chain together, and it stays readable on a phone when you are standing in front of a humming rack. Authorized users can issue instant commands, set variables, or trigger a forced shutdown from the browser, while everyone else gets a strictly read-only view. A JSON API under /api serves device lists, variables, and instant commands to your own scripts, health and readiness probes fit container orchestrators, and OpenMetrics output feeds Prometheus without extra exporters. The whole thing is a single small binary that runs happily on a Raspberry Pi, an old ARM board, or a RISC-V box, reads one TOML file, and supports multi-user sign-in with scoped API keys when you share it with a team. Running on a dedicated VPS on RepoCloud with guaranteed CPU, RAM, and SSD, full root SSH access, and a browser serial console. Apache-2.0 licensed.
Betterlytics
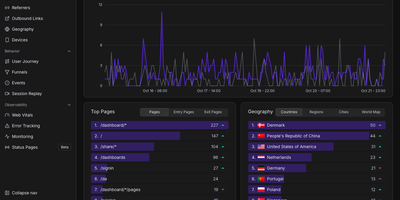
Page views, funnels, session replays, error reports, Core Web Vitals, and uptime checks share one cookieless dashboard in Betterlytics, so teams stop stitching several tools together. The overview charts visitors, page views, bounce rate, and visit duration against the previous period, and annotations mark launches or campaigns right on the timeline. Breakdowns cover referrers, channels, UTM campaigns, browsers, devices, and operating systems, with visitor locations on a world map once an optional MaxMind key is added. Custom events, global properties such as plan or app version, and outbound link tracking show what visitors actually do, while user journey diagrams and funnels reveal where they drift away. Session replay is opt-in per tracking script, masks text and form inputs by default, and can keep recordings in your own S3-compatible bucket. Error tracking groups JavaScript errors with stack traces, a session trail, and a link to the matching replay. Uptime and SSL monitors alert through Slack, Discord, Teams, or webhooks and feed public status pages on your own domain. Teammates join by invitation, two-factor login is available, and a built-in MCP server lets Claude, Cursor, or Codex answer traffic questions. A script of about 3.5 KB or a WordPress plugin handles installation. Running on a dedicated VPS on RepoCloud with guaranteed CPU, RAM, and SSD, full root SSH access, and a browser serial console. AGPL-3.0 licensed.
Lab Dash
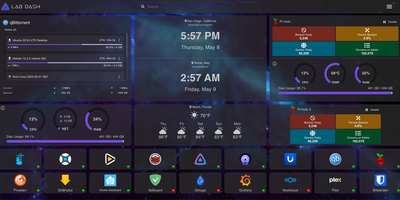
Every homelab deserves a control center that looks as good as the services it manages. Lab Dash gives you a customizable, drag-and-drop dashboard where every tile earns its spot. Add shortcut widgets linking to your Plex, Grafana, Nextcloud, or any service with automatic health check indicators showing green or red status at a glance. The system monitoring widget displays real-time CPU usage, memory consumption, network throughput, disk utilization, and temperature readings by mounting the host /sys directory as a read-only volume. Integrate Pi-hole stats, qBittorrent download progress, and media server widgets for Jellyfin, Plex, or Emby directly on your grid. Multiple pages let you organize services by category, and the search bar finds any tile instantly. Customize the background image from a local upload or URL, set a custom title and tab name, and choose your preferred search provider including self-hosted options like SearXNG. All sensitive configuration data is encrypted locally with AES-256-CBC, and only administrator accounts can modify the layout. Install Lab Dash as a Progressive Web App on desktop, phone, or tablet for a native app experience with offline capability. Configurations export as backup files for easy migration between instances. On RepoCloud, deploy Lab Dash on a dedicated VPS with root SSH access and Docker socket connectivity under the GPL-3.0 license.
nextDash
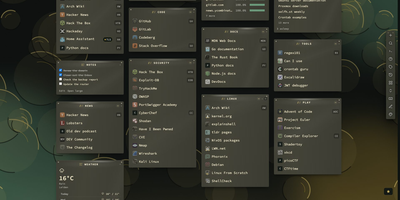
A bookmark bar that also knows if your homelab is on fire is the pitch behind nextDash. Links live on pages and categories with tags, notes, an inbox for unsorted finds, and one search panel for bookmarks, commands, and containers. Mark any link as Monitor and the server checks it every few minutes, keeping 30 days of uptime, certificate and domain expiry dates, and drift warnings, with alerts to ntfy, Slack, Discord, Telegram, Gotify, Apprise, or a phone push. A Containers view lists every Docker container with logs, start, stop, and update with automatic rollback, each matched to its bookmark. Dashboard widgets cover weather, feeds, CPU, memory, disks, Unraid, Jellyfin, Plex, Sonarr, Radarr, qBittorrent, and Home Assistant. A theme studio offers 390 themes and 267 backdrops in six languages, and an optional assistant answers in plain words when you switch it on. Imports arrive from every browser, Pocket, Raindrop, and linkding, and automatic backups with a 30-day trash protect the collection. The weekly digest sums up broken links, expiring certificates, and pending container updates. Running on a dedicated VPS on RepoCloud with guaranteed CPU, RAM, and SSD, full root SSH access, and a browser serial console. MIT licensed.
AIUsage
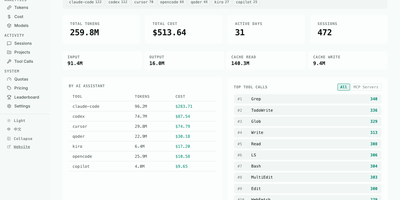
AIUsage shows where your AI coding spend actually went: it reads the session logs that Claude Code, Codex, Cursor, OpenCode, Copilot, Gemini CLI, and many other assistants leave behind, then turns them into one dashboard with tokens, estimated dollars, and activity. The Overview page totals tokens, cost, active days, and sessions for today, this week, this month, or all time, and filters by tool or device. Cost and Tokens pages chart daily spending and input, output, cache, and thinking usage, and Models ranks every model by share. The Sessions table lists duration, tool count, and cost per session, and a detail view walks through each API call and the tools it triggered. Tool Calls shows which built-in, MCP, and skill actions agents use most, Projects ranks directories by spend, and Quotas tracks subscription limits. Optional sync through GitHub, S3, R2, or MinIO merges several machines, and a public leaderboard accepts aggregate totals only. Running on a dedicated VPS on RepoCloud with guaranteed CPU, RAM, and SSD, full root SSH access, and a browser serial console. MIT licensed.
Knock-Knock
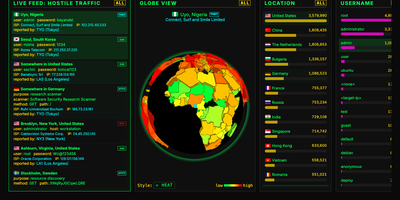
Bots that knock on your server's login ports are always turned away by Knock-Knock, a multi-protocol honeypot that shows every attempt on a live dashboard. Honeypots answer on the standard ports for SSH, Telnet, FTP, RDP, SMB, SIP, HTTP, and SMTP, with MQTT, Node-RED, Modbus, S7, and SNMP as optional extras. Authentication is always rejected, so no bot ever gets a shell. Who is knocking? The live feed shows each attempt's country, username, password, ISP, IP, and protocol. From where? A 3D globe marks the origin in one of six styles, including an extruded country heat map. Trying what? Leaderboards rank countries, usernames, passwords, ISPs, and IP addresses, and a trivia panel explains why bots favor certain credentials. A protocol filter re-slices the feed, globe, and leaderboards together; SIP shows dialed numbers and toll-call destinations, and RDP shows hostnames and accounts. Too fast? Press the space bar to pause, right-click any knock for details, or switch on a virtual Geiger counter that clicks as attacks arrive. Want to fight back? Download hourly 30-day and 365-day blocklists with recipes for CSF, CrowdSec, ipset, nftables, and pfSense, or query the optional API for any IP, CIDR range, or ASN. Several honeypot servers can stream into one aggregated dashboard. Running on a dedicated VPS on RepoCloud with guaranteed CPU, RAM, and SSD, full root SSH access, and a browser serial console. MIT licensed.