Categories
Self-Hosted Developer Tools Dashboard Cost Tracking LLM Observability Coding Assistants AI Usage Analytics Token MonitoringDeveloper links
AIUsage
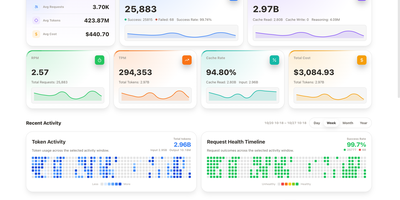
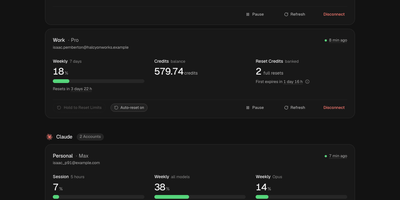
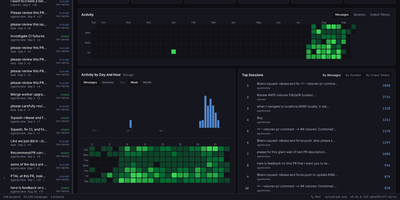
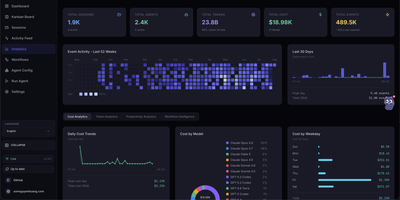
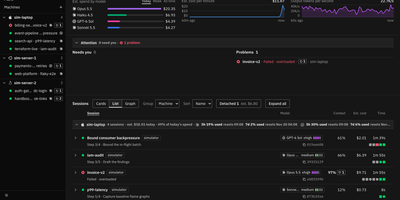
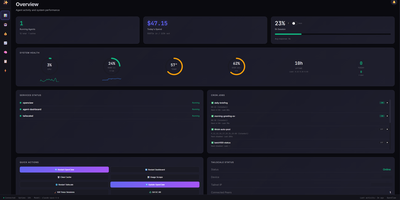
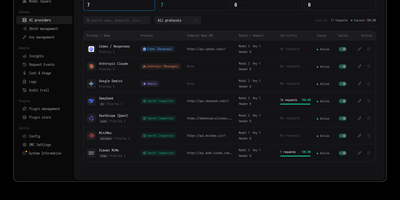
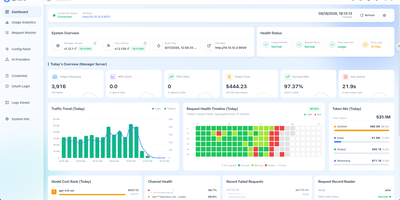
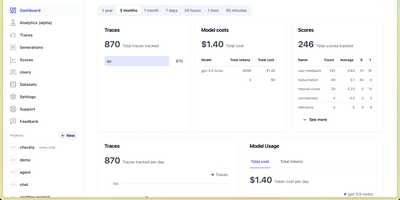
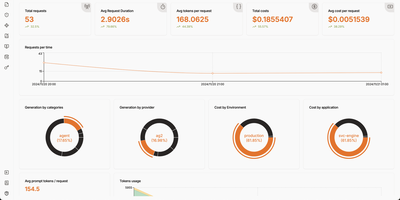
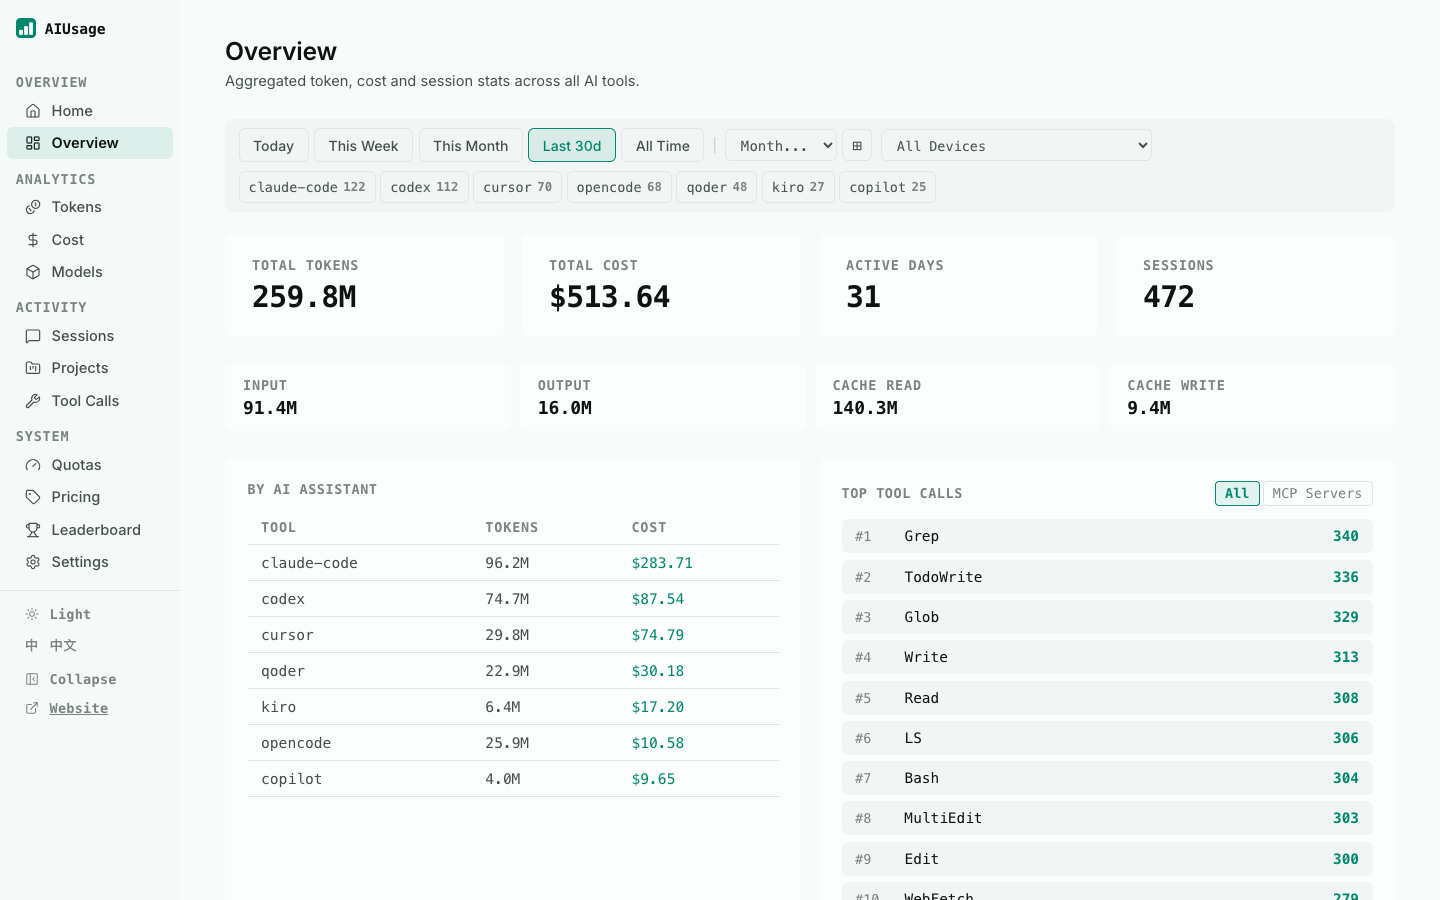
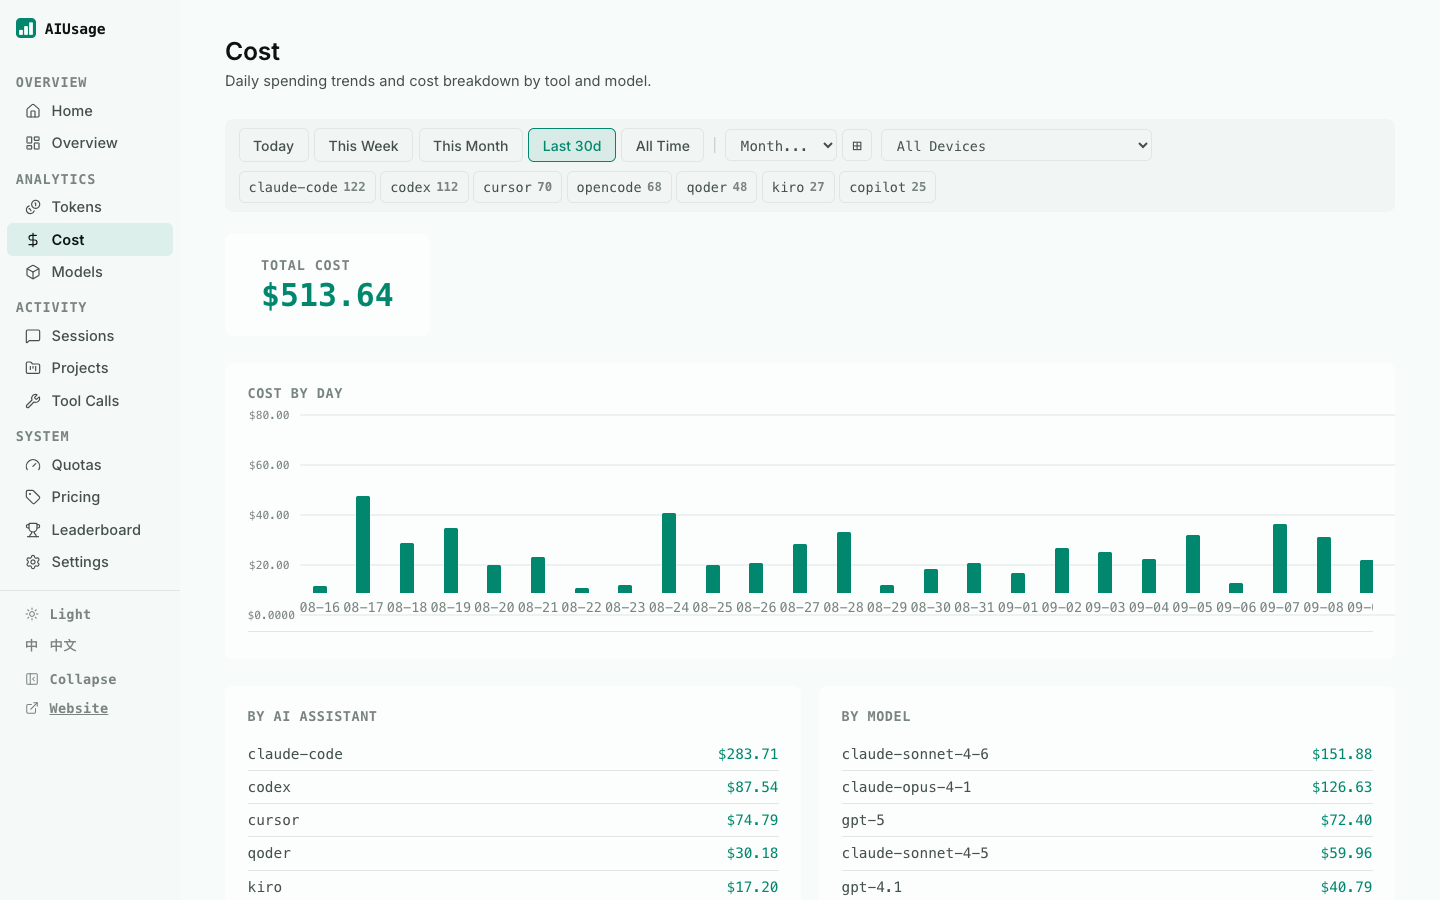
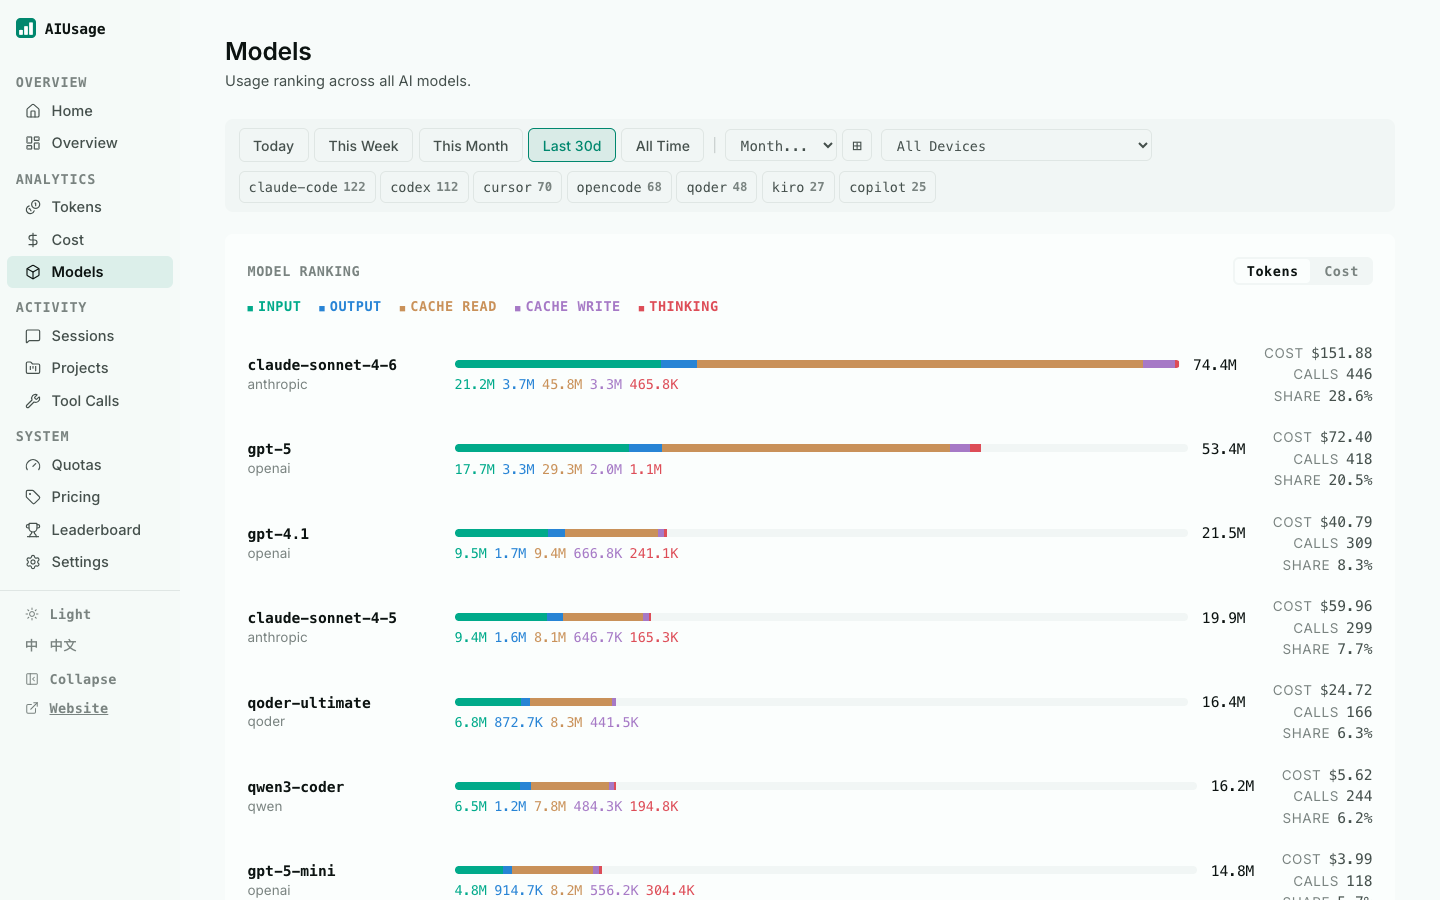
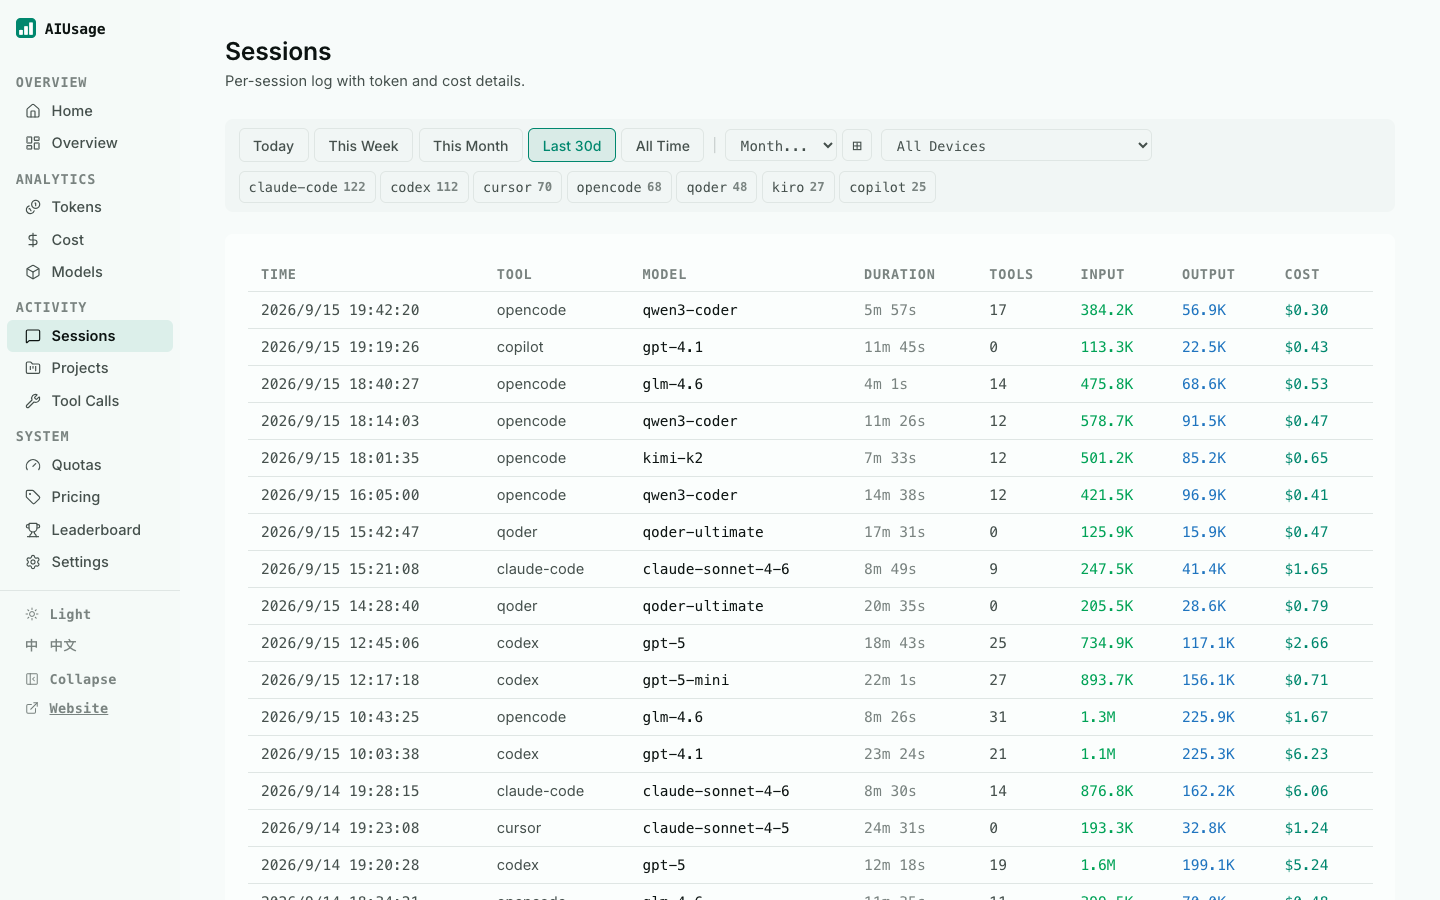
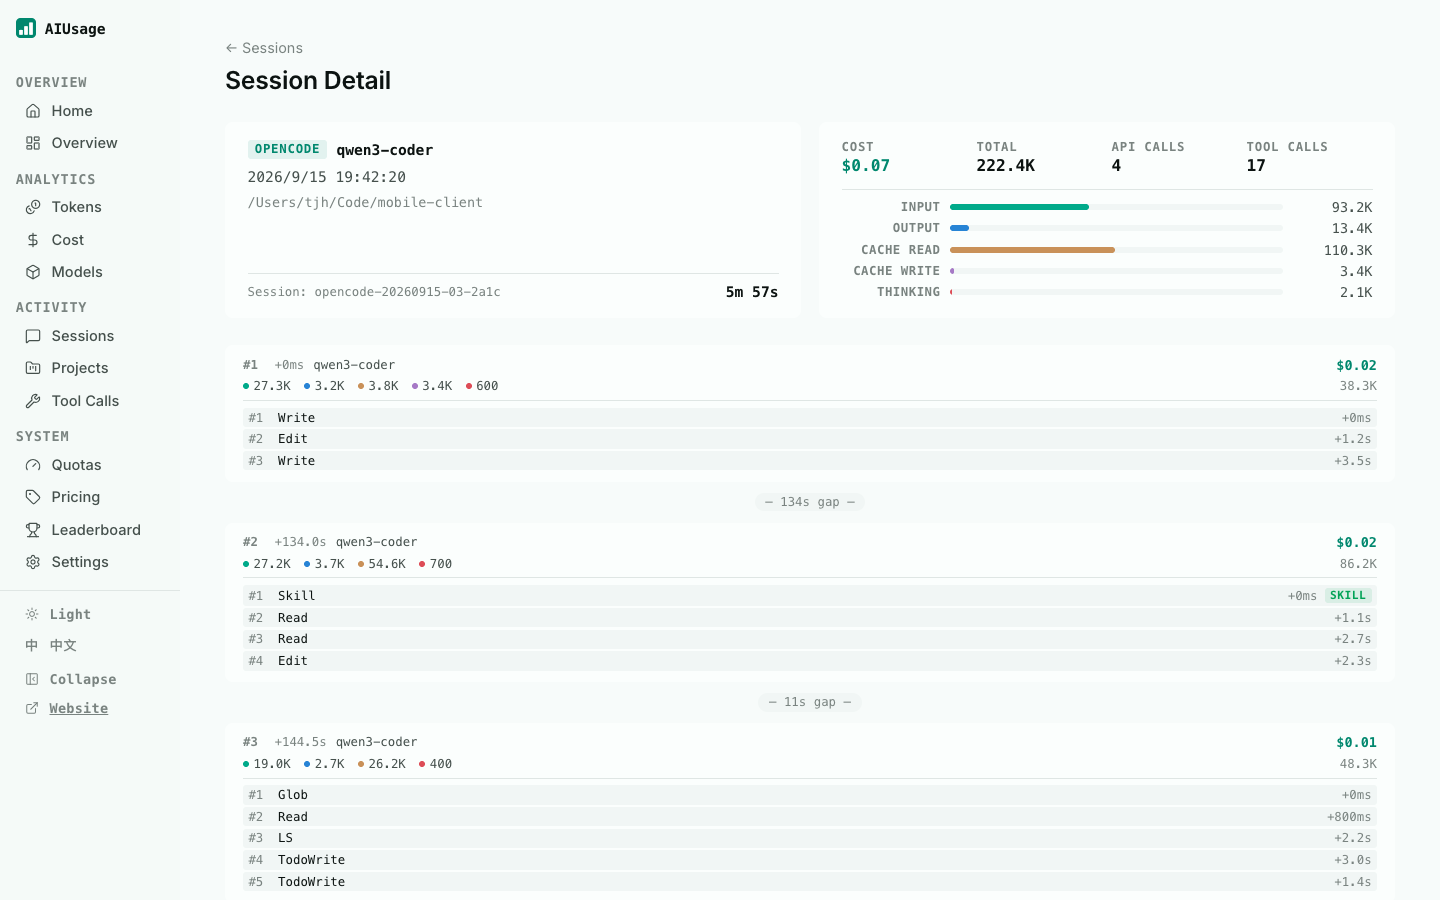
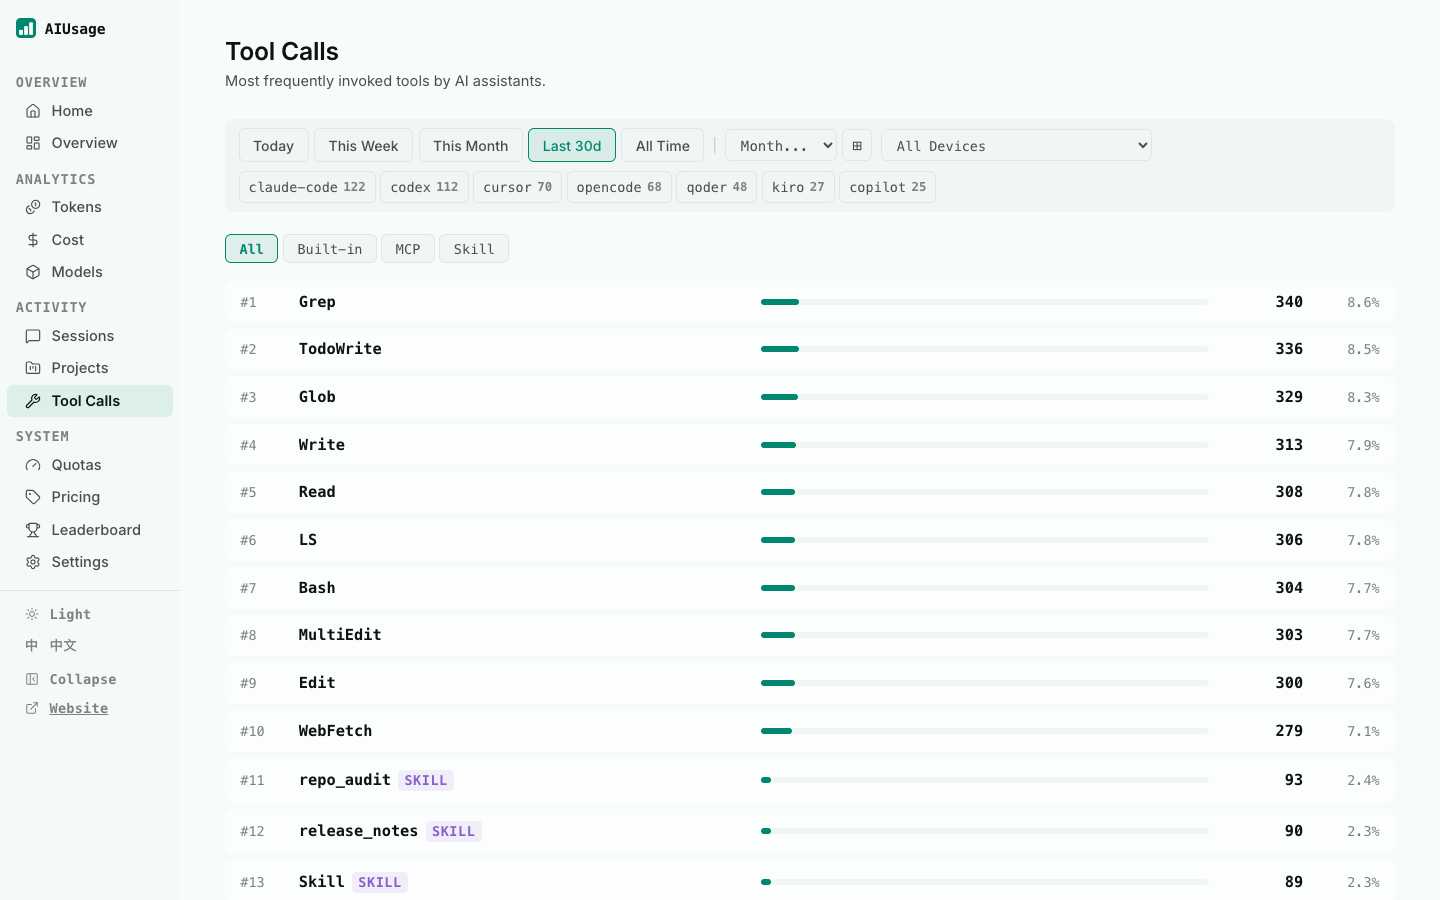
AIUsage shows where your AI coding spend actually went: it reads the session logs that Claude Code, Codex, Cursor, OpenCode, Copilot, Gemini CLI, and many other assistants leave behind, then turns them into one dashboard with tokens, estimated dollars, and activity. The Overview page totals tokens, cost, active days, and sessions for today, this week, this month, or all time, and filters by tool or device. Cost and Tokens pages chart daily spending and input, output, cache, and thinking usage, and Models ranks every model by share. The Sessions table lists duration, tool count, and cost per session, and a detail view walks through each API call and the tools it triggered. Tool Calls shows which built-in, MCP, and skill actions agents use most, Projects ranks directories by spend, and Quotas tracks subscription limits. Optional sync through GitHub, S3, R2, or MinIO merges several machines, and a public leaderboard accepts aggregate totals only. Running on a dedicated VPS on RepoCloud with guaranteed CPU, RAM, and SSD, full root SSH access, and a browser serial console. MIT licensed.
Benefits
- See Where AI Spend Goes
- Cost breakdowns by tool, model, and project reveal which assistants and workloads drive the bill, so engineering leads can adjust subscriptions before surprises arrive at month end.
- One Dashboard For Many Tools
- Usage from more than twenty coding assistants lands in a single view, saving developers from opening separate billing pages for each product they try.
- Private By Design
- Parsing happens on your own server, prompts and source code are never uploaded, and a mandatory dashboard password protects the pages when the container listens on a network.
- Spot Limits Before You Hit Them
- Quota views display subscription windows and percentages used for supported tools, helping heavy users pace work instead of discovering a cutoff in the middle of a task.
Features
- Token And Cost Analytics
- Daily charts split input, output, cache read, cache write, and thinking tokens, with matching cost totals for any chosen date range.
- Model Ranking Table
- Every model is ranked by tokens or cost, with call counts and percentage share, making expensive habits easy to identify and change.
- Session Drill-Down
- Browse sessions by time, tool, model, duration, and cost, then open one to inspect each API call and the tool actions behind it.
- Tool Call Statistics
- See which built-in tools, MCP servers, and skills agents invoke most often, with counts and share of total calls.
- Multi-Device Sync
- Combine usage from several machines through GitHub, S3, R2, or MinIO, and label each device with an alias for clear filtering.
- Quotas And Pricing Tables
- Track subscription windows for Claude Code and Codex, and review the editable pricing metadata used to estimate costs per model.