Categories
Self-Hosted Network Monitoring Alerting Server Monitoring Infrastructure Monitoring Performance Metrics Time-Series Graphs PerlStars
Forks
Watchers
Developer links
Munin
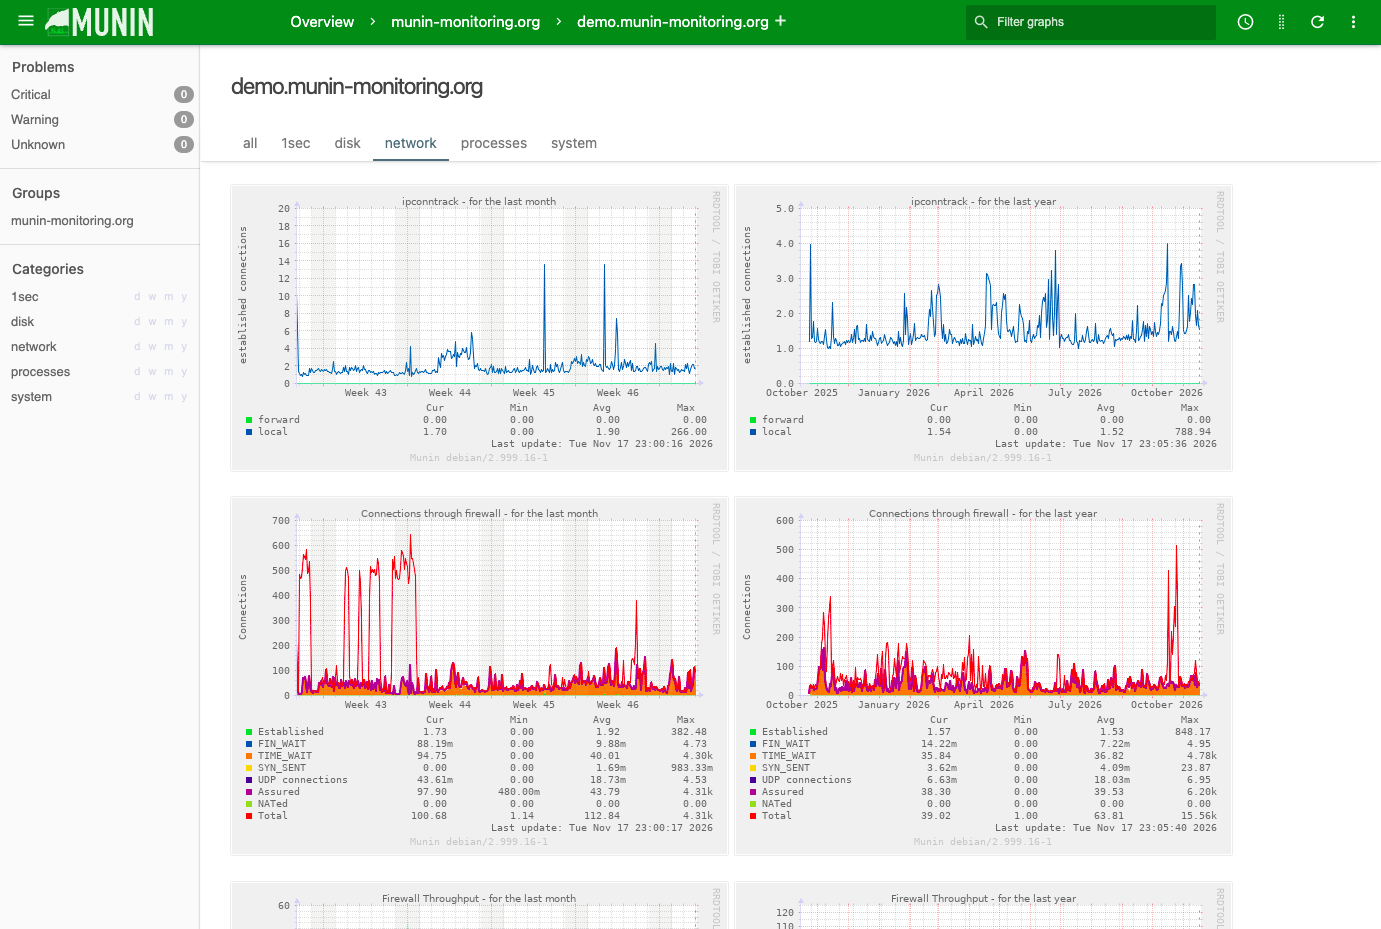
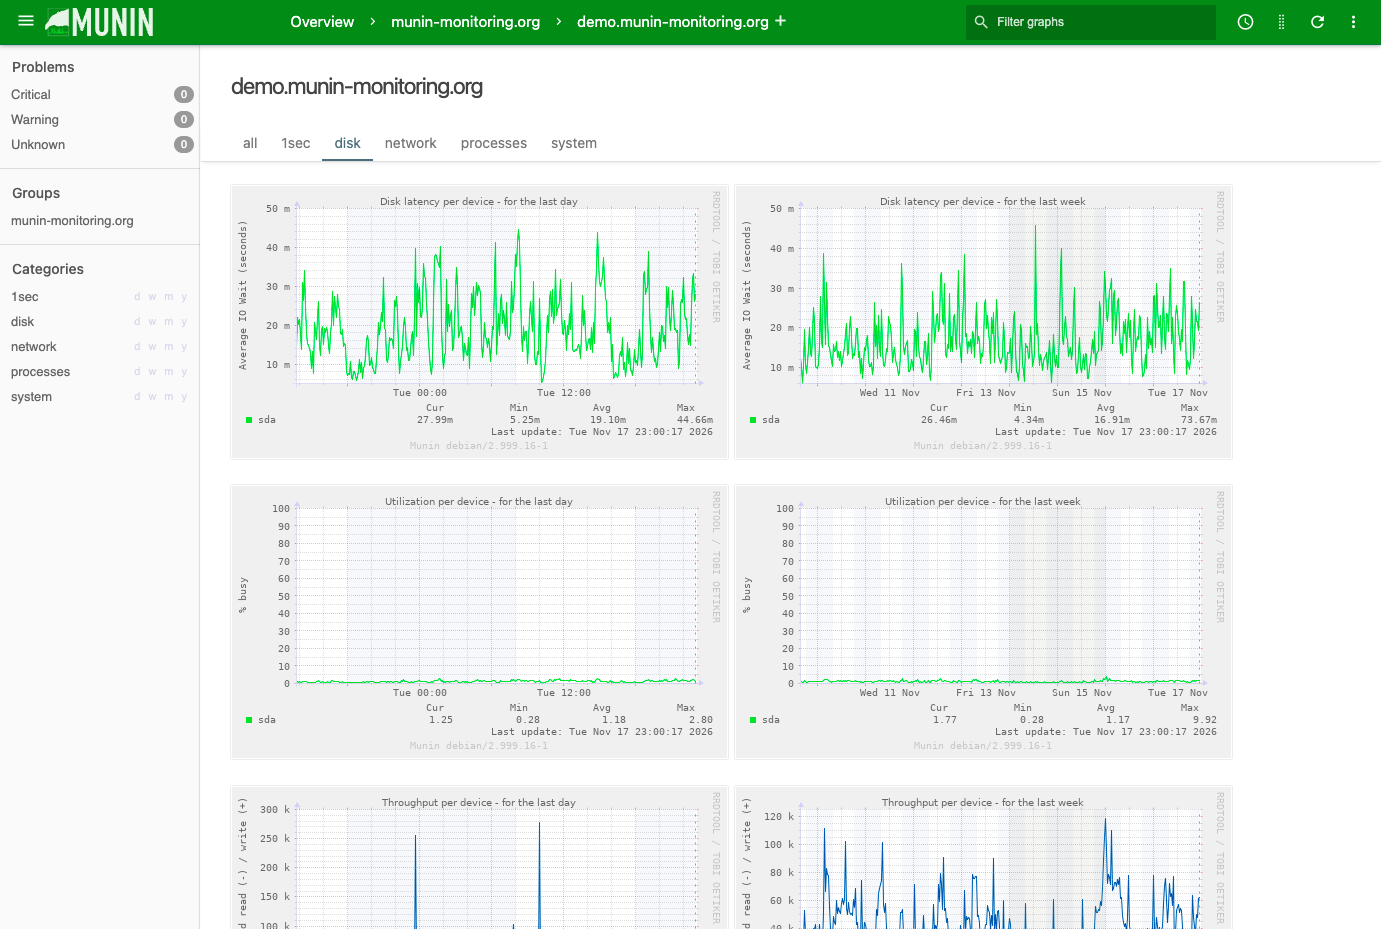
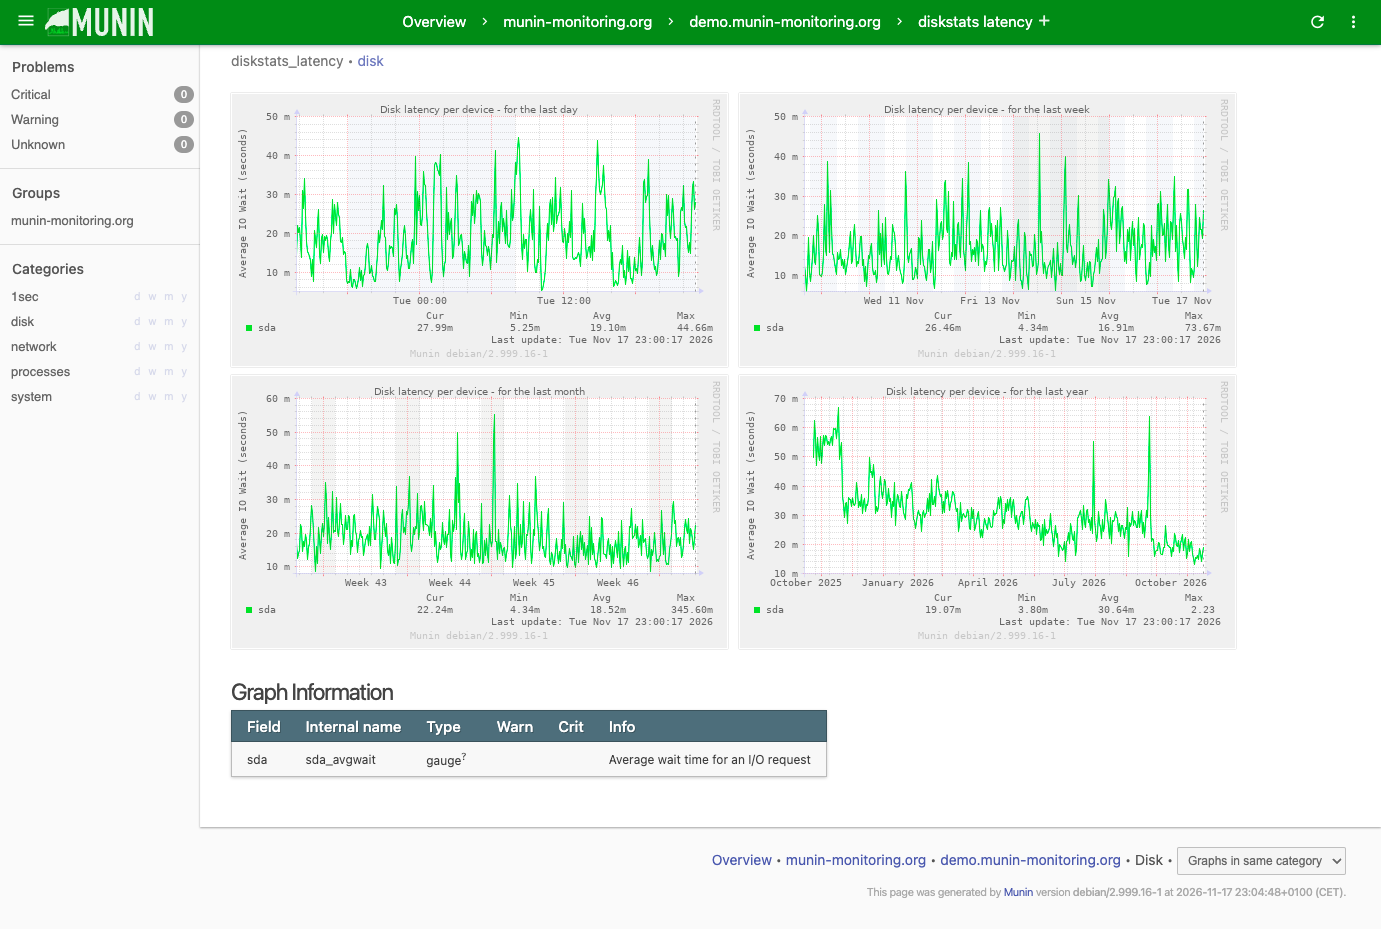
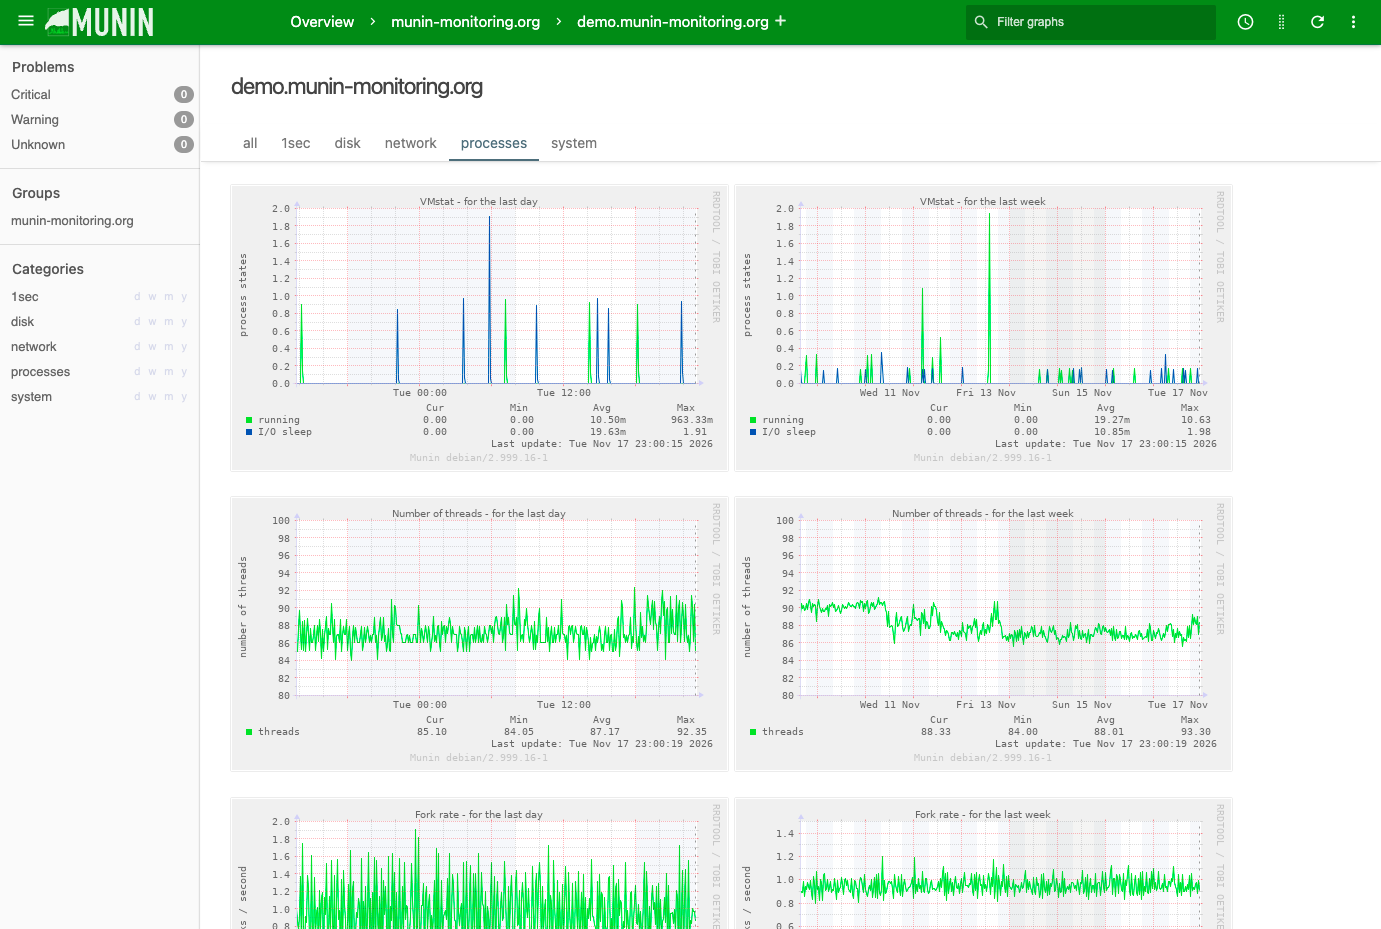
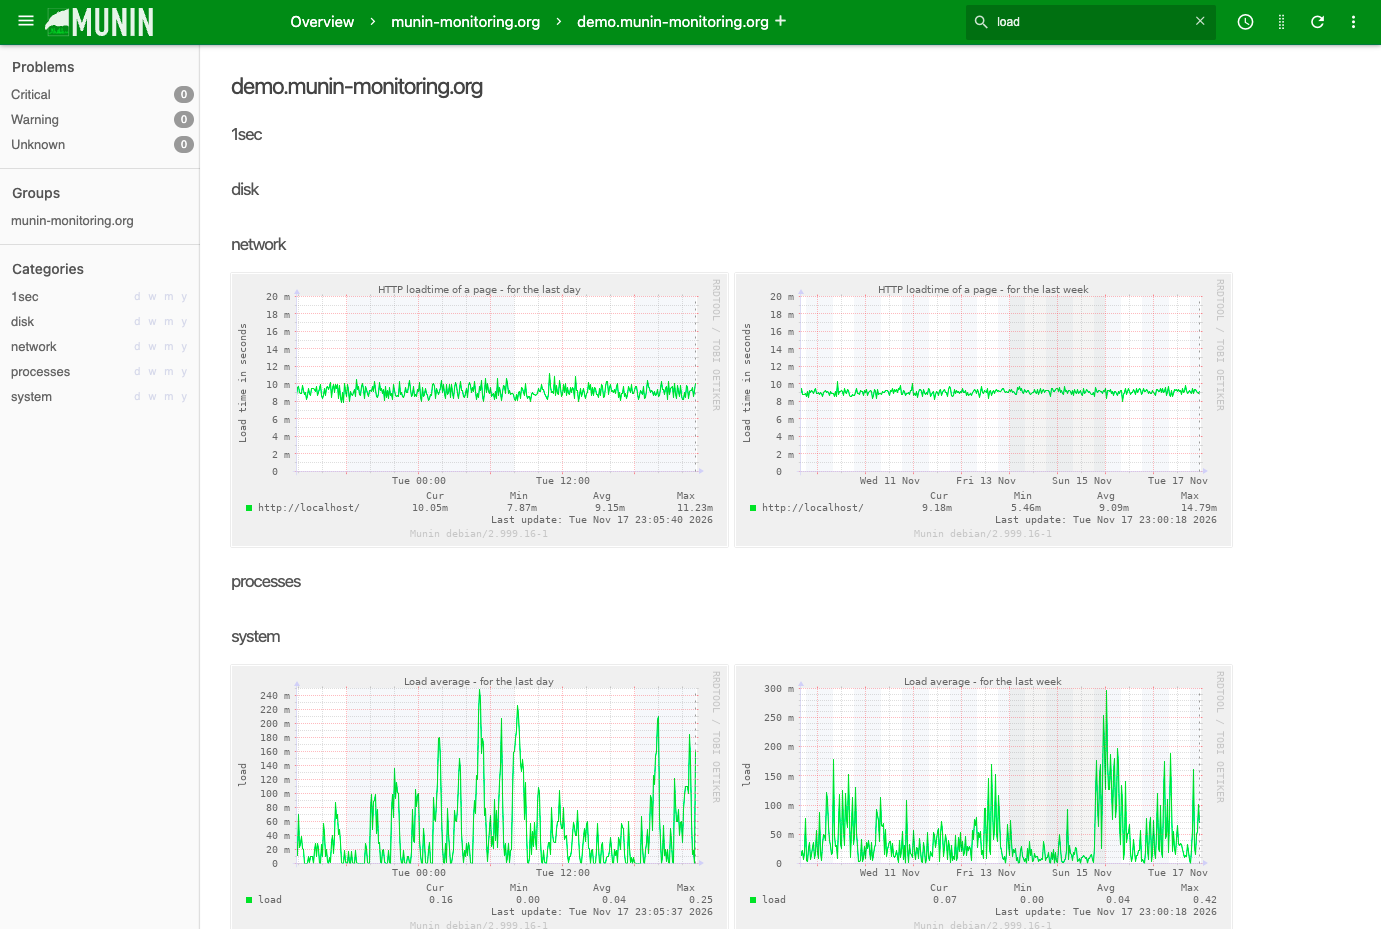
Point Munin at your computers, and this plug-and-play monitoring tool graphs what they are doing, keeps the history, and serves it all in a web interface. A central master polls a small agent on every host every five minutes. That works for a home Raspberry Pi and for a cluster of more than 100 nodes. A default install switches on a large set of plugins on its own. Load, disk, network, and process graphs start filling in with no setup per metric. Plugins are standalone executables that answer a config call with metadata and a plain call with values. Plain shell scripts count. Computers, networks, SANs, applications, even weather measurements: all graphable. The project gallery lists more than a thousand community-supported plugins. No agent on a device? SNMP plugins fetch its values remotely. With supersampling, selected plugins record readings every ten seconds. Every data field can carry warning and critical ranges. Cross one, and Munin can send email, write to syslog, run any script, or notify Nagios or Icinga. Graphs are drawn on demand through CGI or FastCGI. They are grouped by host and category, with hour, day, week, month, and year views side by side. Several masters can watch the same nodes, each keeping its own data. A rewritten node agent covers machines that cannot run the standard one. Running on a dedicated VPS on RepoCloud with guaranteed CPU, RAM, and SSD, full root SSH access, and a browser serial console. GPL-2.0 licensed.
Benefits
- Graphs Appear Right After Install
- A default installation activates a high number of monitoring plugins automatically, so load, disk, network, and process graphs start filling in without a configuration entry for each metric.
- Alerts Reach the Right People
- Warning and critical ranges on any data field trigger contact commands for email, syslog, custom scripts, Nagios, or Icinga, with message text templated from variables such as group, host, plugin, and graph title.
- Scales From One Pi to Clusters
- Monitoring works for installations of every size, from a home Raspberry Pi up to clusters of more than 100 nodes, and several masters can watch the same nodes independently.
- Write Plugins in Any Language
- A plugin is a standalone executable that answers a config call with metadata and a plain call with values, so a short shell script can add a graph for whatever you need to track.
Features
- Master and Node Architecture
- The master connects to a small node agent on each host, fetches metrics every five minutes, stores them in RRDtool files, and checks values against limits on the fly.
- On-Demand CGI Graphing
- munin-cgi-graph runs as CGI or FastCGI behind a web server and draws RRDtool graphs only when a user opens them, saving master resources.
- Community Plugin Library
- Munin chooses from 500+ available plugins for the services running on a server, and the project gallery lists more than a thousand community-supported plugins you can add.
- SNMP and Remote Plugins
- SNMP plugins fetch values from remote machines, so devices without a node agent can be graphed beside regular servers, and multigraph plugins emit several graphs from one run.
- Supersampling for Fast Metrics
- Selected plugins sample themselves at their own rate, such as every ten seconds, and the master fetches every sample collected since the last five-minute poll.