Relay Panel
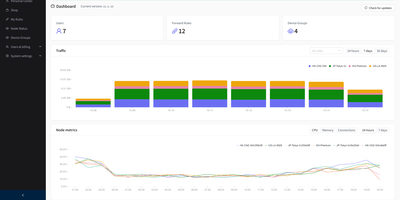
Game servers, home labs behind carrier-grade NAT, and services that need a presence in another region all end up needing the same thing: a cheap entry machine that forwards traffic to the real backend, with rules you can change without opening an SSH session. Relay Panel is the control room for that job, a self-hosted web panel that runs TCP and UDP forwarding across a fleet of lightweight relay nodes from one dashboard. Each rule can fan out to multiple targets with failover or round-robin balancing, follow domain targets as their DDNS records change, and pass the real client IP onward through PROXY protocol, even when relays chain through other relays. Per-rule concurrency caps, scheduled restarts, and automatic target circuit breaking keep one bad upstream from swallowing the whole route. A built-in shop lets users buy plans and top up balances with redemption codes while quotas drain by measured upload plus download, multiplied per line, so premium routes cost more by design. Traffic charts split the last day, week, or month by line, the node page watches CPU, memory, and connection counts, and Telegram or email alerts fire the moment a relay drops offline. Nodes upgrade from the panel in one click, and the first login forces a password change before anything else opens. Running on a dedicated VPS on RepoCloud with guaranteed CPU, RAM, and SSD, full root SSH access, and a browser serial console. Apache-2.0 licensed.
NetPulse
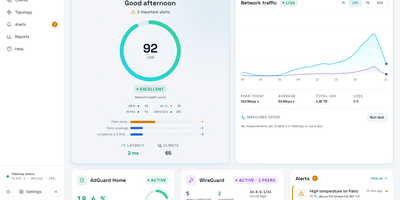
NetPulse is a self-hosted dashboard that turns a pile of routers, switches, and clients into one live picture of how your network is doing. A single score from 0 to 100 condenses latency, loss, uptime, and temperature, and updates every few seconds. The topology map draws itself from bridge and LLDP data, placing wired and wireless clients under the router and port they actually use. Every device is classified by type, with signal strength, band, and first-seen time. Router cards show model, firmware, CPU, memory, temperature, and live traffic. Scheduled WAN speed tests compare results against your contracted plan, and panels for WireGuard peers and AdGuard Home keep VPN and DNS activity in view. Alerts for overheating, new devices, firmware updates, and WAN outages reach you through push notifications, ntfy, Telegram, or webhooks. Admin and viewer accounts share access, a Wi-Fi channel analyzer scores congestion, and OpenWrt firmware upgrades can be started from the browser. MQTT publishing feeds Home Assistant, and an optional read-only MCP endpoint answers questions from your AI assistant. The interface installs as a phone app and speaks English and Spanish. Running on a dedicated VPS on RepoCloud with guaranteed CPU, RAM, and SSD, full root SSH access, and a browser serial console. AGPL-3.0 licensed.
Open SEO Crawler
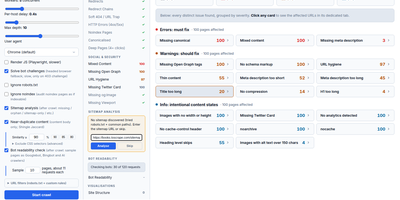
The audit starts with one URL: Open SEO Crawler spiders the entire site from your own server and groups every technical issue by severity. It crawls concurrently with per-host politeness and backoff retries, and presets adapt automatically to WordPress, Shopify, Webflow, and seven other detected CMS platforms. Every page gets checked for missing or duplicate titles, meta descriptions, H1s, and canonicals, plus thin content, redirect chains, broken links, hreflang gaps, and images without alt text. Afterwards, sample pages are fetched again as Googlebot, Bingbot, Applebot, GPTBot, and PerplexityBot, and any page a bot cannot read in full gets flagged. The Summary groups issues into errors, warnings, and info with affected page counts, and the sidebar opens bulk reports for titles, metas, canonicals, duplicates, response codes, and deep pages. Each report exports to an XLSX workbook, and the Crawl Budget page turns parameter traps into ready-to-paste robots.txt rules that stop phantom URLs from eating your budget. One click packs the crawl into a Markdown brief for any AI assistant, and the bundled MCP server lets Claude or Cursor start crawls and read issues directly. Saved crawls reopen any time, dark mode is built in, and a daily auto-update keeps the tool current with rollback if a pull ever breaks it. Running on a dedicated VPS on RepoCloud with guaranteed CPU, RAM, and SSD, full root SSH access, and a browser serial console. MIT licensed.
Nightingale
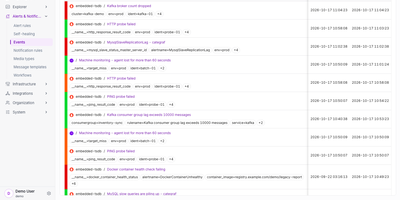
When a query crosses its threshold, Nightingale, a self-hosted alerting engine, decides who hears about it and how, without moving data out of the stores you already run. Rules use PromQL, log queries, or SQL against Prometheus, VictoriaMetrics, Elasticsearch, Loki, ClickHouse, MySQL, or PostgreSQL, graded S1, S2, or S3 with a for-duration that absorbs brief spikes. Existing Prometheus alert rules import from YAML. Business groups give each team its own rules and dashboards, and sign-in works through OIDC, OAuth2, LDAP, or CAS. Once a rule fires, mute rules silence the noise, subscriptions add recipients, and event pipelines rewrite labels or route conditionally. Delivery reaches Slack, PagerDuty, Discord, Telegram, Jira, email, DingTalk, Feishu, WeCom, SMS, and voice calls, plus HTTP webhooks and scripts for anything else. Evaluation records, active and historical events, and notification results show what happened at each step. If an alert misbehaves, the built-in AI agent explains why it fired or never arrived, and it drafts rules, dashboards, and mutes from plain-language requests. Claude Code, Cursor, and other MCP clients can query alerts and manage alerting through /mcp, read-only by default and bound by the caller's own permissions. At remote sites, n9e-edge keeps evaluating and notifying when the link to the center drops. Running on a dedicated VPS on RepoCloud with guaranteed CPU, RAM, and SSD, full root SSH access, and a browser serial console. Apache-2.0 licensed.
Slurm-web
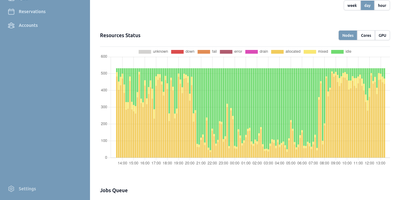
Slurm-web gives HPC cluster operators and users a browser dashboard for watching jobs, nodes, and GPUs across a Slurm cluster instead of living in squeue output. The overview page charts resource and job status with interactive graphs, so a glance tells you whether the machine is busy, idle, or quietly failing. The jobs view filters and sorts instantly, updates live as jobs change state, and uses colored badges so pending, running, and failed work sorts itself out visually at any scale. Node views go deeper: advanced visualizations show node status across racking topology, GPU utilization is tracked alongside CPU resources, and problems surface as highlighted issues rather than a line in a log file. Account trees, quality-of-service settings, and advanced reservations get intuitive graphical views that make fair-share politics legible to everyone involved. Prometheus integration collects and charts timeseries metrics for longer-term capacity questions. Access is enterprise-ready: LDAP and Active Directory authentication, OpenID Connect single sign-on through providers like Keycloak or Authentik, and granular role-based permissions decide who sees which clusters. Several clusters can be monitored from one deployment, the interface supports dark mode and custom branding with your own colors and logos, caching keeps the UI responsive against busy controllers, and integrated help explains each view in place. Running on a dedicated VPS on RepoCloud with guaranteed CPU, RAM, and SSD, full root SSH access, and a browser serial console. MIT licensed.
ServiceRadar
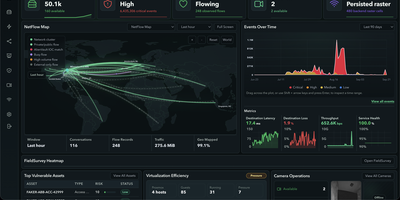
Most teams juggle five consoles to watch one network, and ServiceRadar replaces them with a single operations dashboard for flows, topology, logs, metrics, and alerts. Agents deployed at remote sites keep collecting checks even when the link drops, then deliver their stored records once the connection returns. Discovery over SNMP, LLDP, and CDP builds a topology map that shows traffic between devices, and a NetFlow map traces conversations across the world. Telemetry arrives from OpenTelemetry, syslog, GELF, SNMP polling and traps, BGP, and NetFlow or IPFIX exporters, and a short key:value query language filters any of it. An anomaly engine groups spikes and drift into episodes, so operators get one durable alert instead of a hundred noisy ones. Notification routes with escalation policies page people through Slack, Discord, email, or webhooks, and a delivery log records every attempt. Security views gather scanner findings, threat intelligence matches, and DNS activity, and Ansible playbooks run against inventory devices with live per-host results. Custom checks run as sandboxed plugins, and teams can publish their own dashboards. Managed service providers, multi-site businesses, remote field operations, and homelabs that outgrew a status page are the natural fit. Running on a dedicated VPS on RepoCloud with guaranteed CPU, RAM, and SSD, full root SSH access, and a browser serial console. Apache-2.0 licensed.
CPA Usage Keeper
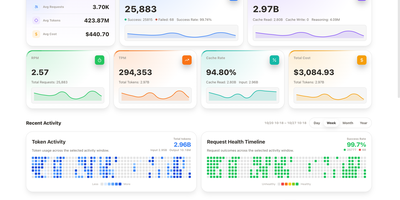
Somewhere between the third coding agent and the fifth model subscription, nobody can say where the tokens went. CPA Usage Keeper keeps the receipts for a CLIProxyAPI gateway, saving every request locally with scheduled backups so history survives restarts. The Overview page shows requests, success rate, tokens, cache hit rate, and estimated cost with sparklines and a calendar heatmap, and Realtime plots time to first token against total latency and shows rolling cache levels and model speed. Analysis breaks usage down by API key, model, credential, or provider with donut charts and ranked lists. The Request Events log filters by model, source, and status, adjusts its columns, and exports records. Credentials cards show success rates, remaining five-hour and weekly quotas, priorities, and enable switches, and quota history charts how many tokens and dollars each percentage point costs over a cycle. Individual API keys can be given a read-only usage view. Deployment uses a Docker Compose file that bundles CPA with Keeper or runs Keeper beside an existing gateway, and the interface switches between English and Chinese and between light and dark themes. Check the dashboard before the invoice arrives and see exactly who spent what. Running on a dedicated VPS on RepoCloud with guaranteed CPU, RAM, and SSD, full root SSH access, and a browser serial console. MIT licensed.
Drydock
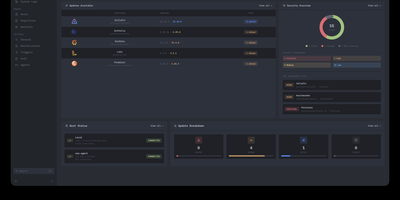
Deploying container updates without blind surprises is what Drydock delivers through a monitor-first inspection plane that evaluates image registries, scans CVE vulnerabilities, and automates rollbacks across distributed Docker infrastructure. Systems engineers track container fleets across twenty-three public and private registries including Docker Hub, GitHub Container Registry, Harbor, and Quay using cursor-based pagination and semver classification. The integrated Update Bouncer runs Trivy and Grype static scanners against incoming candidate layers, blocking deployments that fail configurable CVE severity policies while verifying cryptographic signatures through cosign. Operators configure declarative update schedules with stabilization countdown gates that hold back brand-new releases until defined burn-in periods elapse. When updates execute, Drydock creates pre-upgrade container snapshots and evaluates post-launch container health checks, instantly restoring previous image digests and network configs if failures occur. Distributed Portwing edge agents stream live container output and system logs over encrypted WebSockets, allowing central consoles to coordinate remote daemon updates without opening inbound host firewall ports. Automated event triggers dispatch granular notifications and update payloads across seventeen communication channels including Slack, Discord, Telegram, and Home Assistant MQTT brokers. Running on a dedicated VPS on RepoCloud with guaranteed CPU, RAM, and SSD, full root SSH access, and a browser serial console. AGPL-3.0 licensed.
Headroom
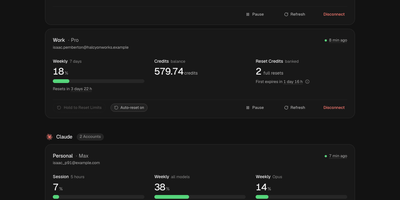
Headroom answers the question every multi-plan AI subscriber asks mid-task: which of my accounts still has room to work? It puts the live limits, reset times, credits, and spend of Claude, Codex, Cursor, Copilot, Grok, Antigravity, and Vercel AI Gateway accounts on one self-hosted dashboard instead of seven provider pages. Connect each account once, through its official CLI sign-in or a credential import, and a background scheduler refreshes every figure on schedule, renews tokens before they expire, and keeps 90 days of readings. Five-hour sessions, weekly pools, per-model limits, credit balances, banked resets, and on-demand spend sit side by side, and unreported figures show as unknown rather than a fake zero. Compare ranks same-provider accounts by the room they have left and names the one to use next, while Timeline lays every reset window on a two-week calendar. Analytics charts when you work, when you run dry, and whether each plan fits, and Wallet totals subscriptions, usage spend, and top-ups in one currency with renewals and budget alerts. In-app notices, Telegram messages, and signed webhooks warn about low limits, expiring resets, and broken sign-ins, and optional automations can spend a banked Codex reset or log a credit top-up the moment it lands. Personal, work, and side-project accounts stay separate under one owner login with passkeys and a Privacy Mode that blurs emails on screen. Running on a dedicated VPS on RepoCloud with guaranteed CPU, RAM, and SSD, full root SSH access, and a browser serial console. MIT licensed.
Airbroke
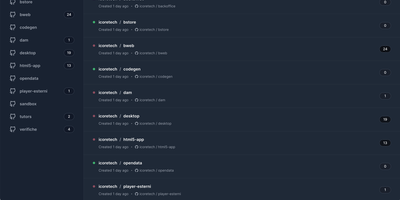
Engineering teams use Airbroke to catch application exceptions in one self-hosted error tracker where they can triage issues, replay failing requests, and debug without a per-event bill. Your existing Airbrake or Sentry clients point at its compatible HTTP collector endpoints, so instrumented applications keep reporting with no new SDK to adopt, and every occurrence lands in storage where the footprint stays small even under heavy ingestion. The web interface groups errors into issues you can triage, bookmark important occurrences for follow-up, and read occurrence charts that show whether a bug is a one-off or a slow-building wave. When an HTTP exception looks suspicious, you can replay the original request directly or copy a generated cURL command that reproduces it exactly, turning vague log complaints into debuggable cases. An AI assistant answers questions about issues in context, an MCP API lets LLM agents query your error data programmatically, and multiple OAuth providers secure sign-in for the team. It runs as a small service needing only a database, a single core, and a few hundred megabytes of memory. Running on a dedicated VPS on RepoCloud with guaranteed CPU, RAM, and SSD, full root SSH access, and a browser serial console. MIT licensed.
Blocky UI
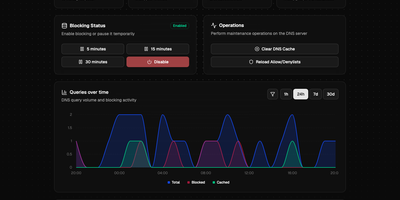
BlockyUI gives your Blocky DNS server a clean browser dashboard for seeing what gets queried, what gets blocked, and how quickly answers come back. Overview cards show total queries, blocked requests, cache hit rate, listed domains, and average response time. Pause blocking for 5, 15, or 30 minutes with one click, or disable it outright, then let it return on its own. Clear the DNS cache and reload allow and deny lists without touching the command line. A queries over time chart switches between 1 hour, 24 hours, 7 days, and 30 days, with filters for a single domain or client. Paginated top lists rank the busiest domains and devices and offer a blocked-only view. The query tool tests how any domain resolves, so a new filtering rule can be checked in seconds. Query logs are searchable and filterable by reason and record type, and they read from MySQL, PostgreSQL, Timescale, SQLite, CSV, or VictoriaLogs. Panels that depend on logging or statistics appear when your Blocky instance supports them, and the dashboard adapts otherwise. Settings live in one YAML file that points at your Blocky server. Running on a dedicated VPS on RepoCloud with guaranteed CPU, RAM, and SSD, full root SSH access, and a browser serial console. MIT licensed.
Berth
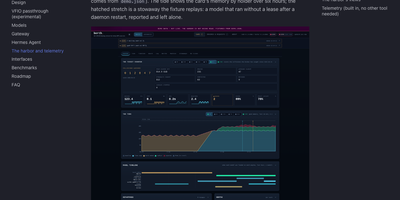
A single GPU can only hold so many models at once, and when a chat server, an image pipeline, and a voice engine all grab VRAM together, somebody runs out of memory and crashes. Berth fixes the scramble by making every engine lease the card: wrap a launch in berth run and the daemon grants memory in turn, queues the rest with an honest place in line and a start estimate, and drains a holder cleanly before the next load begins. The broker learns each engine's real footprint from its runs, so grants are sized by measured peaks instead of guesses, and processes that grab memory without a lease are reported as stowaways, never killed, with contested grants flagged in plain sight. A collisions board counts what the scheduling prevented: avoided collisions, VRAM handed off, drains, stuck releases, and refusals, and every count links back to a gap free event log you can follow live. The Harbor web UI turns that into a departures board of leases, a six hour tide of memory by holder, engine cards with decode throughput and a token ledger, plus a per model leaderboard and thirty days of stored history. Alerts reach your desktop or a webhook, Prometheus scrapes the metrics endpoint, and multi GPU machines can even pass one card through to a VM while the others keep serving. Running on a dedicated VPS on RepoCloud with guaranteed CPU, RAM, and SSD, full root SSH access, and a browser serial console. Apache-2.0 licensed.
MikroDash
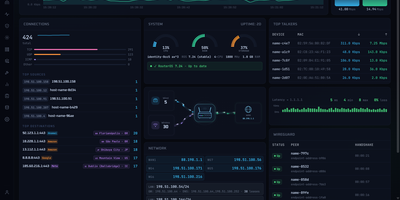
Watching a MikroTik RouterOS v7 router in real time is what MikroDash is for: live traffic, connections, Wi-Fi clients, DHCP leases, and WireGuard peers reach the browser the moment anything changes. Cards drag into any layout, and the arrangement follows your account to every browser. Managing a fleet happens on the Devices page, which shows routers as cards, a list, or a world map with 24-hour connectivity, last backup, open alerts, and pending updates. Rolling out a change starts in Config Management: choose one of 20 ready-made templates or capture your own, then deploy to one router or the fleet with a restore point, a canary router, and an automatic revert if a change cuts MikroDash off. Scheduled backups are kept only when something changed, with a diff and a guarded restore. New sites join through a generated script that calls home over a built-in WireGuard tunnel, even from behind NAT. Alerts reach SMTP, Telegram, ntfy, Discord, Slack, Gotify, Pushover, and Apprise. Troubleshooting stays in the browser with ping, traceroute, torch, bandwidth tests, a packet sniffer, and a RouterOS terminal. Read-only API access covers every page and alert, while roles, OpenID Connect sign-in, and an audit trail of every write govern shared use. Off by default, an optional assistant answers from live router data and asks before changing anything. Running on a dedicated VPS on RepoCloud with guaranteed CPU, RAM, and SSD, full root SSH access, and a browser serial console. MIT licensed.
Laminar
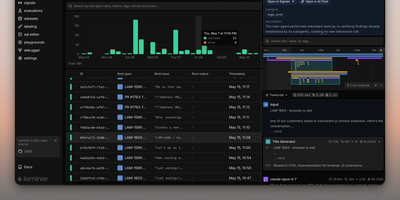
Backed by Y Combinator (S24) and processing traces from thousands of AI agents in production, Laminar is the open-source observability platform that treats agent debugging as a first-class engineering discipline rather than an afterthought. Its OpenTelemetry-native SDK auto-instruments Vercel AI SDK, LangChain, OpenAI, Anthropic, Gemini, Browser Use, Stagehand, Mastra, Pydantic AI, and the OpenAI Agents SDK with a single line of code, capturing every LLM turn, tool call, and sub-agent delegation as nested spans with full input/output data and token costs. The Signals engine lets you describe failures in plain language — "agent is stuck in a loop" or "tool returned empty results" — then reads every trace and alerts via Slack when it detects a match. A built-in debugger records runs and replays them from cache so each iteration takes seconds, designed for Claude Code, Cursor, or Codex to drive the repair loop via the MCP server or CLI. Run code-first evaluations in Python or TypeScript locally or in CI/CD pipelines, build datasets from production traces, and query everything with raw SQL through custom dashboards, the in-app editor, or your coding agent. The Rust backend delivers 20x trace compression, a custom real-time streaming engine, ultra-fast full-text search, and gRPC ingestion, while ClickHouse powers columnar analytics and PostgreSQL stores application state. Running on a dedicated VPS on RepoCloud with guaranteed CPU, RAM, and SSD, full root SSH access, and a browser serial console. Apache 2.0 licensed.
ContainerFlow
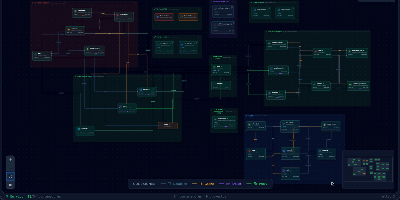
Your database container is probably not at 98 percent memory, whatever docker stats claims, because most of that figure is reclaimable page cache; ContainerFlow subtracts the full cache and shows the memory your containers actually hold. Point it at a Docker socket and it draws the whole estate as a living map: every Compose project discovered automatically, services grouped and colour coded, and the connections between them inferred, app to database, proxy to app, worker to broker. CPU and memory refresh every three seconds, the graph flashes when a container starts, stops, or restarts, and seven days of metric history wait in a local store when you need to know what happened overnight. Click any node and a detail panel opens with live logs you can filter by stream, an inline terminal that runs commands inside the container, and buttons to start, stop, restart, rebuild, recreate, or remove it. The same panel teaches as it works, flagging containers that run with no memory limit, no CPU limit, or no restart policy, while Discord webhooks fire when a container you care about crosses a threshold you set. Running on a dedicated VPS on RepoCloud with guaranteed CPU, RAM, and SSD, full root SSH access, and a browser serial console. AGPL-3.0 licensed.
LaraOwl
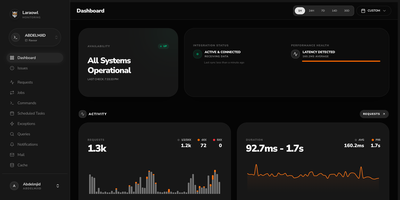
LaraOwl watches your Laravel applications from your own server, streaming every request, exception, slow query, and attack attempt into one live dashboard. Install one Composer package in each app, point it at your LaraOwl server, and requests arrive with method, path, status, duration, and middleware timing attached. Exceptions group themselves by fingerprint with stack traces, occurrence counts, and first and last seen times, so a resolved bug that comes back announces itself. Slow queries and N+1 patterns are flagged with execution times, jobs report failures and retries, and scheduled tasks check in like heartbeats that complain when they stop. A built-in security lens scores threats such as SQL injection, cross-site scripting, and path traversal, tracks hostile IPs, and can push a block into your Cloudflare firewall in one click. Uptime checks run every thirty seconds, alerts fan out to Slack, Discord, Telegram, email, or any webhook, and throttles keep a bad night from becoming a thousand messages. Teams organize multiple projects with their own tokens, thresholds, and retention policies, and daily pruning keeps last quarter's noise from filling the disk. Running on a dedicated VPS on RepoCloud with guaranteed CPU, RAM, and SSD, full root SSH access, and a browser serial console. Apache-2.0 licensed.
IRONSIGHT
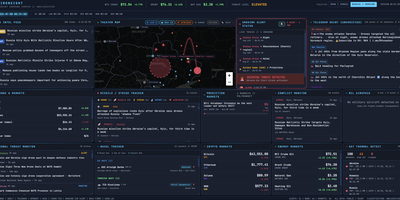
IRONSIGHT fuses over 50 publicly available intelligence sources into a single real-time dashboard that requires zero API keys and zero configuration. The Live Intel Feed aggregates 20+ RSS news sources with keyword relevance filtering from outlets including Reuters, Al Jazeera, and Kyiv Post. The Telegram OSINT module scrapes 27 channels every 60 seconds with automatic translation from Hebrew, Arabic, and Farsi. The interactive Leaflet Theater Map plots military aircraft positions via ADS-B transponder data, naval vessel locations in the Persian Gulf and Eastern Mediterranean, strike markers extracted from news and Telegram, missile trajectory arcs with range rings, and country-border overlays with a distance measurement tool. A header toggle switches the entire dashboard between Iran/Israel and Russia/Ukraine theaters, re-pointing every panel, map layer, and data feed to the selected conflict. The Israel Alert module streams live Pikud HaOref missile alerts with audio notifications, while the Conflict Monitor categorizes events into strikes, defense, diplomatic, and nuclear. Financial panels track defense contractor stocks, S&P 500, VIX, gold, Bitcoin, Ethereum, energy commodities via Yahoo Finance, and Polymarket prediction odds on conflict outcomes. NASA FIRMS satellite thermal detection flags fire and explosion signatures. The Next.js 16 App Router handles server-side data fetching for RSS and API endpoints while client-side React state management drives real-time polling updates. On RepoCloud, deploy IRONSIGHT on a dedicated VPS with persistent storage, root SSH access, and full control over your intelligence monitoring environment, all under the MIT license.
Checkcle
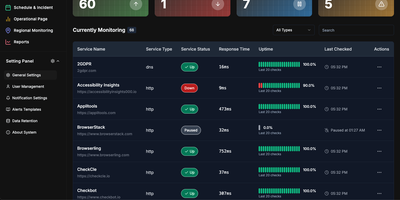
CheckCle provides a complete uptime monitoring and infrastructure observability platform that deploys with a single Docker container and stores all data in embedded SQLite via PocketBase. The Go backend runs three microservices — a service operation engine handling HTTP, HTTPS, DNS, Ping, and TCP checks at configurable intervals, a distributed regional check agent for multi-location network testing, and a server monitoring agent collecting CPU, RAM, disk usage, and network metrics via gRPC. The React frontend built with Vite, TypeScript, Tailwind CSS, and shadcn-ui subscribes to PocketBase WebSocket endpoints for real-time dashboard updates without polling. SSL and domain monitoring tracks certificate issuers, expiration dates, days remaining, and validation status. The incident management system records UP, DOWN, WARNING, and PAUSE states with full history, while scheduled maintenance windows prevent false alerts during planned downtime. Public status pages provide external stakeholders with live service health information. Health heatmaps visualize uptime performance and outage patterns over time. Notification channels include email, Telegram, Discord, and Slack, with multiple alert targets per monitored service. The one-click agent installation script supports Debian, Ubuntu, CentOS, Red Hat, Alpine, and Windows in beta. Docker deployment runs on port 8090 with a single persistent volume at /mnt/pb_data, requiring minimum 1 vCPU and 500MB RAM. On RepoCloud, deploy CheckCle on a dedicated VPS with root SSH access, persistent storage for your monitoring database, and complete control over agent endpoints and notification configurations, all under the MIT license.