Categories
Self-Hosted DevOps Observability Docker Server Management Container Monitoring Infrastructure VisualizationStars
Forks
Watchers
Developer links
ContainerFlow
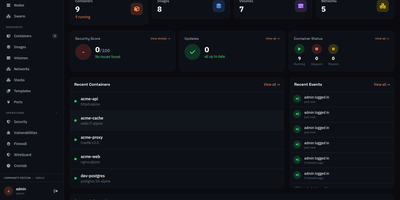
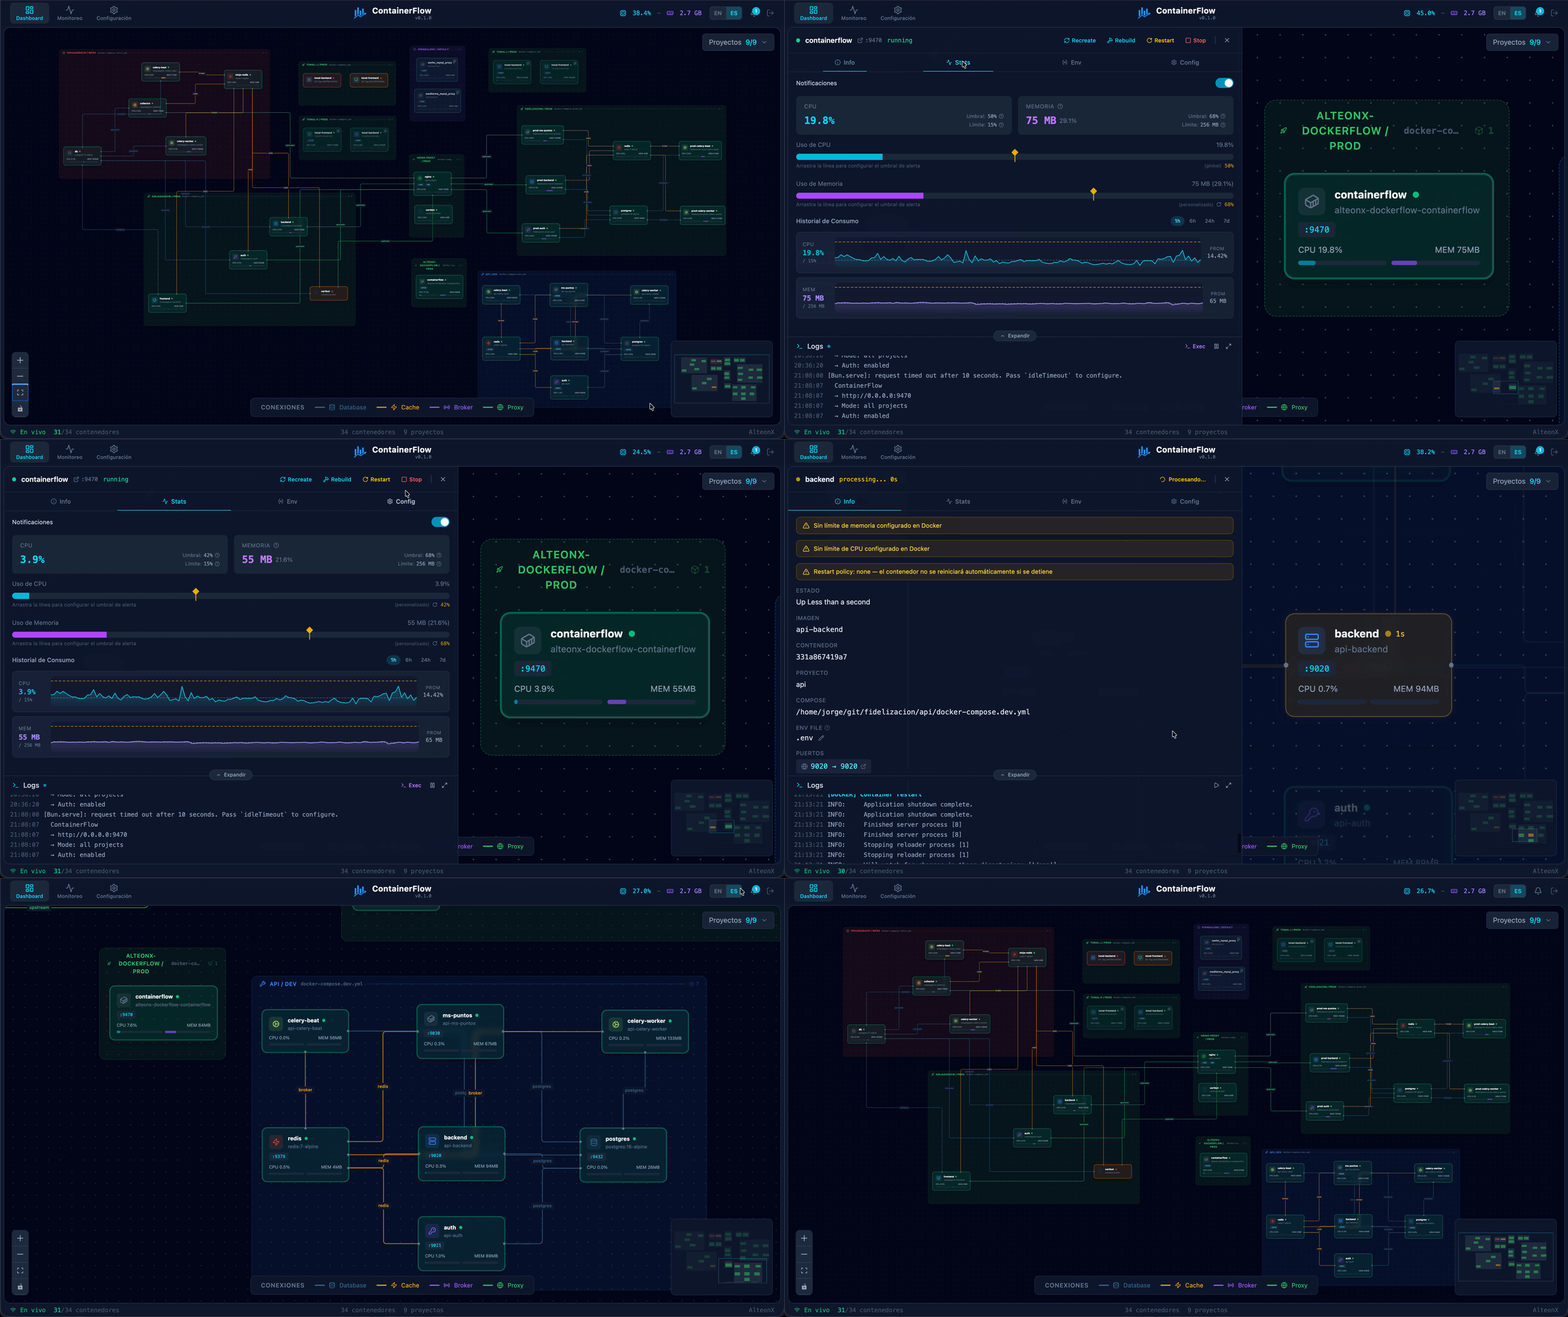
Your database container is probably not at 98 percent memory, whatever docker stats claims, because most of that figure is reclaimable page cache; ContainerFlow subtracts the full cache and shows the memory your containers actually hold. Point it at a Docker socket and it draws the whole estate as a living map: every Compose project discovered automatically, services grouped and colour coded, and the connections between them inferred, app to database, proxy to app, worker to broker. CPU and memory refresh every three seconds, the graph flashes when a container starts, stops, or restarts, and seven days of metric history wait in a local store when you need to know what happened overnight. Click any node and a detail panel opens with live logs you can filter by stream, an inline terminal that runs commands inside the container, and buttons to start, stop, restart, rebuild, recreate, or remove it. The same panel teaches as it works, flagging containers that run with no memory limit, no CPU limit, or no restart policy, while Discord webhooks fire when a container you care about crosses a threshold you set. Running on a dedicated VPS on RepoCloud with guaranteed CPU, RAM, and SSD, full root SSH access, and a browser serial console. AGPL-3.0 licensed.
Benefits
- Memory Numbers That Tell Truth
- ContainerFlow subtracts the full file page cache, active and inactive, from every reading, so a database with hot buffers stops reporting a false 98 percent and shows real anonymous memory.
- Architecture Drawn For You
- Services are discovered through the Docker socket, grouped by Compose project, and connected automatically: app to database, app to cache, proxy to app, worker to broker, without diagramming by hand.
- Manage Without Leaving The Map
- Start, stop, restart, rebuild, recreate, or remove containers from the detail panel, read filtered live logs, and open an inline terminal that executes commands inside any container.
- Alerts And Guardrails Built In
- Discord webhooks fire on per-container thresholds you configure, while warning banners flag missing memory limits, CPU limits, restart policies, and healthchecks before they hurt in production.
Features
- Interactive Service Graph
- A React Flow canvas renders every container as a node with inferred edges, per-project aliases and colour coding, and a visual flash on Docker start, stop, and restart events.
- Three-Second Live Metrics
- Per-container CPU and memory stream in every three seconds, with seven days of history persisted to SQLite so overnight incidents stay inspectable the next morning.
- Inline Container Terminal
- The detail panel runs docker exec with visible output, alongside tabbed info, stats, environment variables, and configuration, so diagnosis never needs a separate SSH session.
- Scoped Multi-Tenant Access
- The ALLOWED_PATHS variable restricts actions to containers whose Compose files live under chosen prefixes; everything else stays visible behind a lock icon on shared servers.
- Featherweight Bun Runtime
- Built on Bun and Hono, the server starts in about half a second and idles near 80 MB of RAM, a fraction of heavier container management suites.