Stars
Forks
Watchers
Developer links
Slurm-web
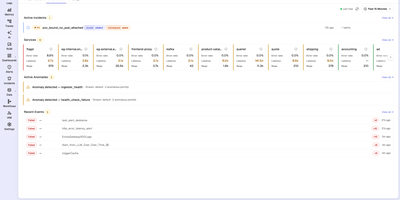
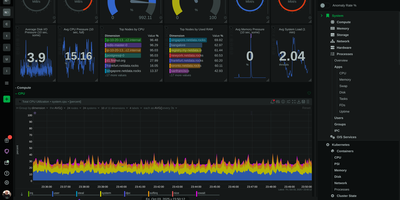
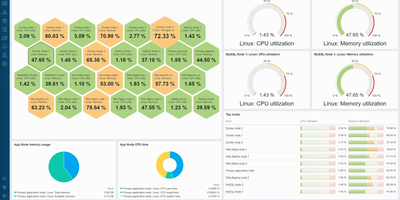
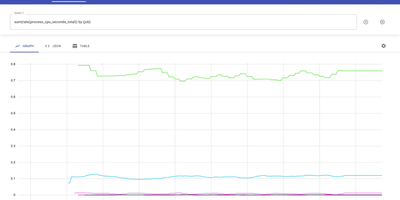
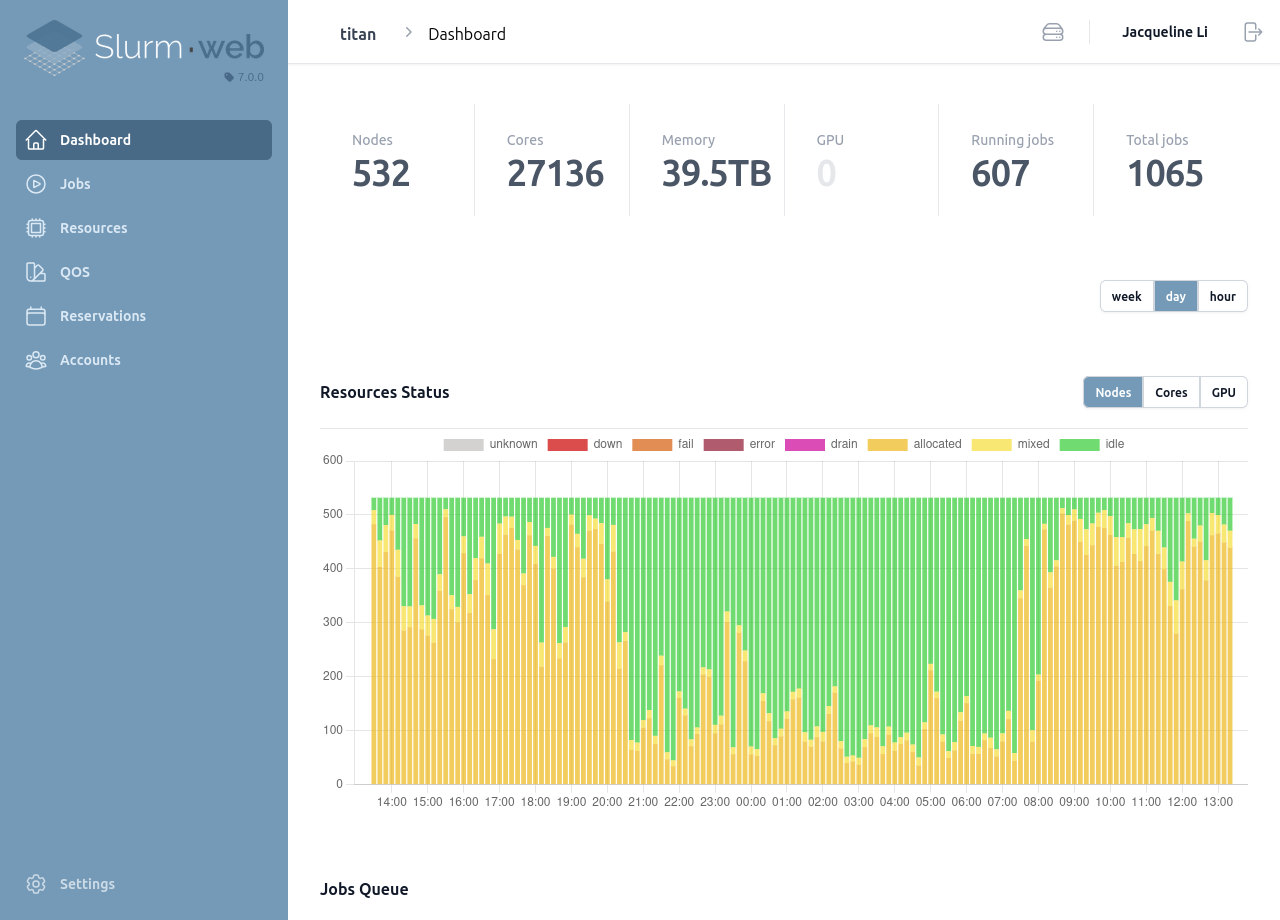
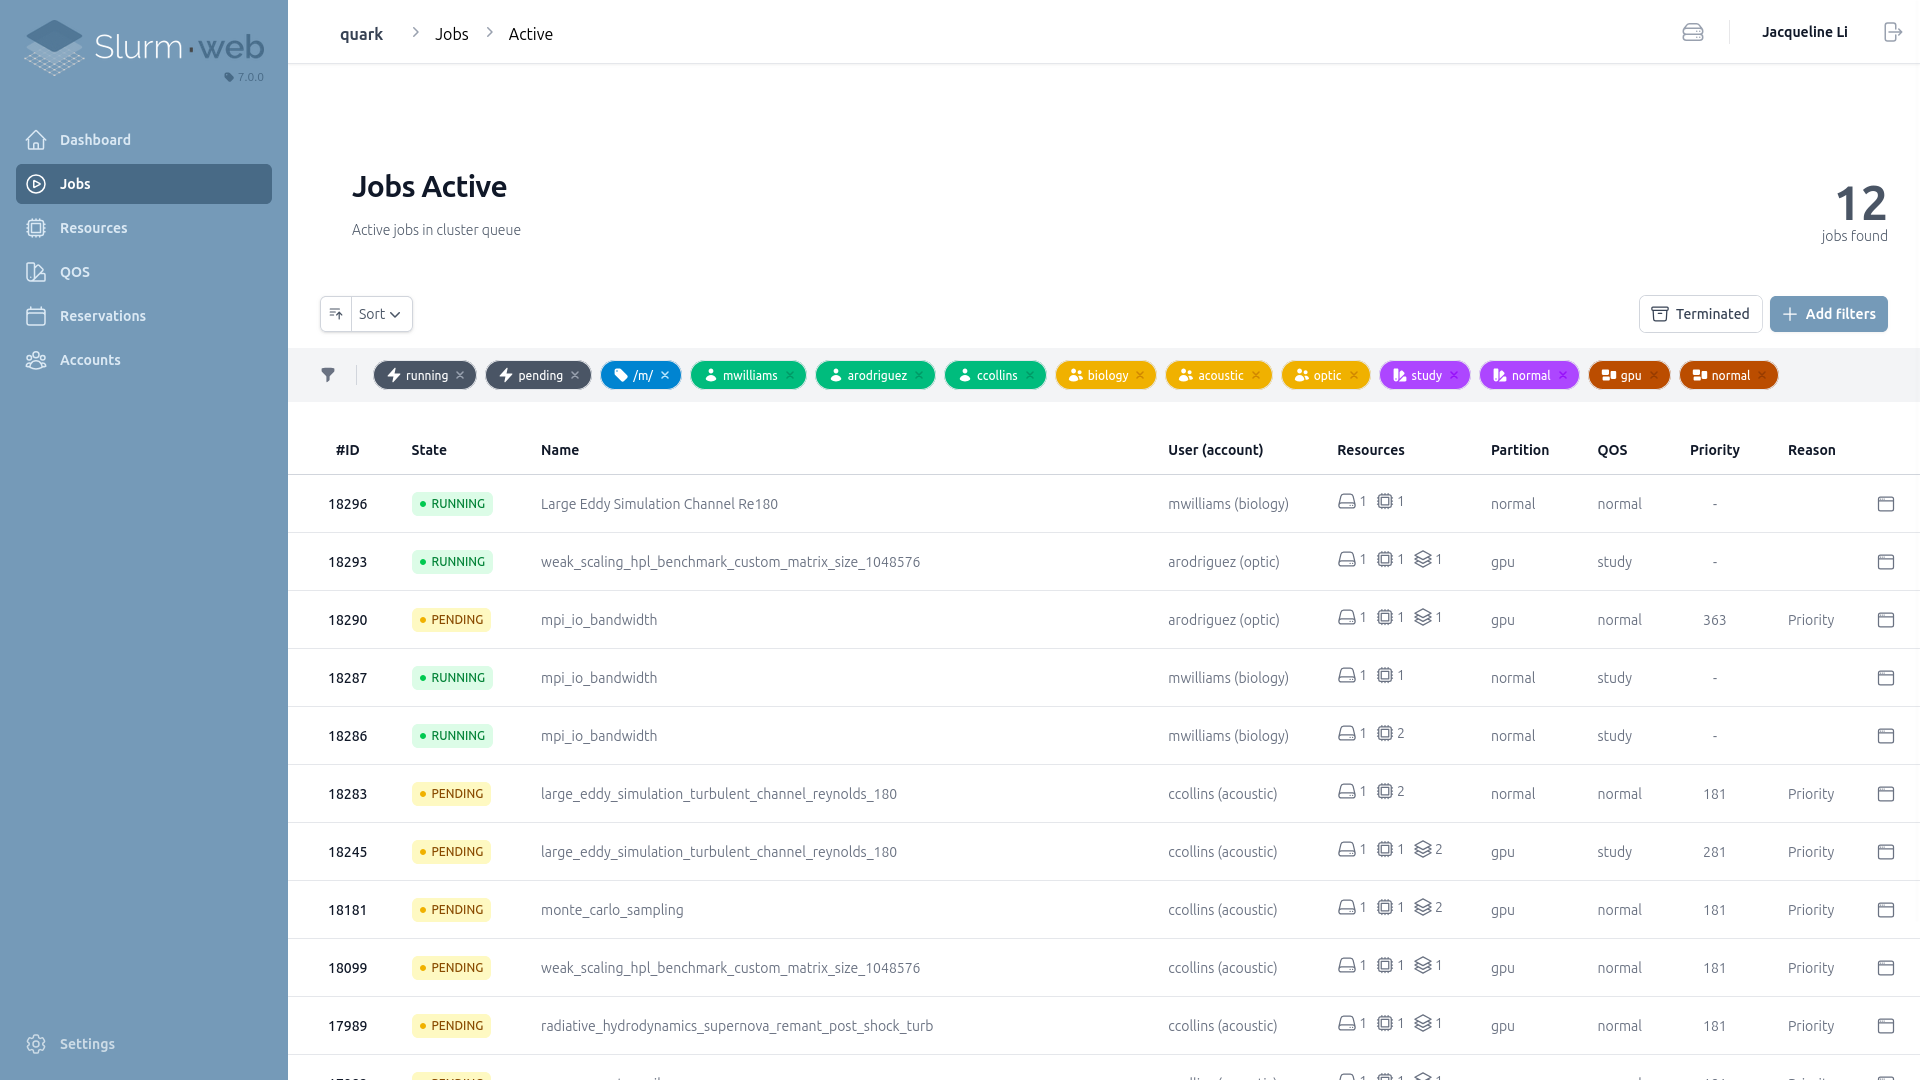
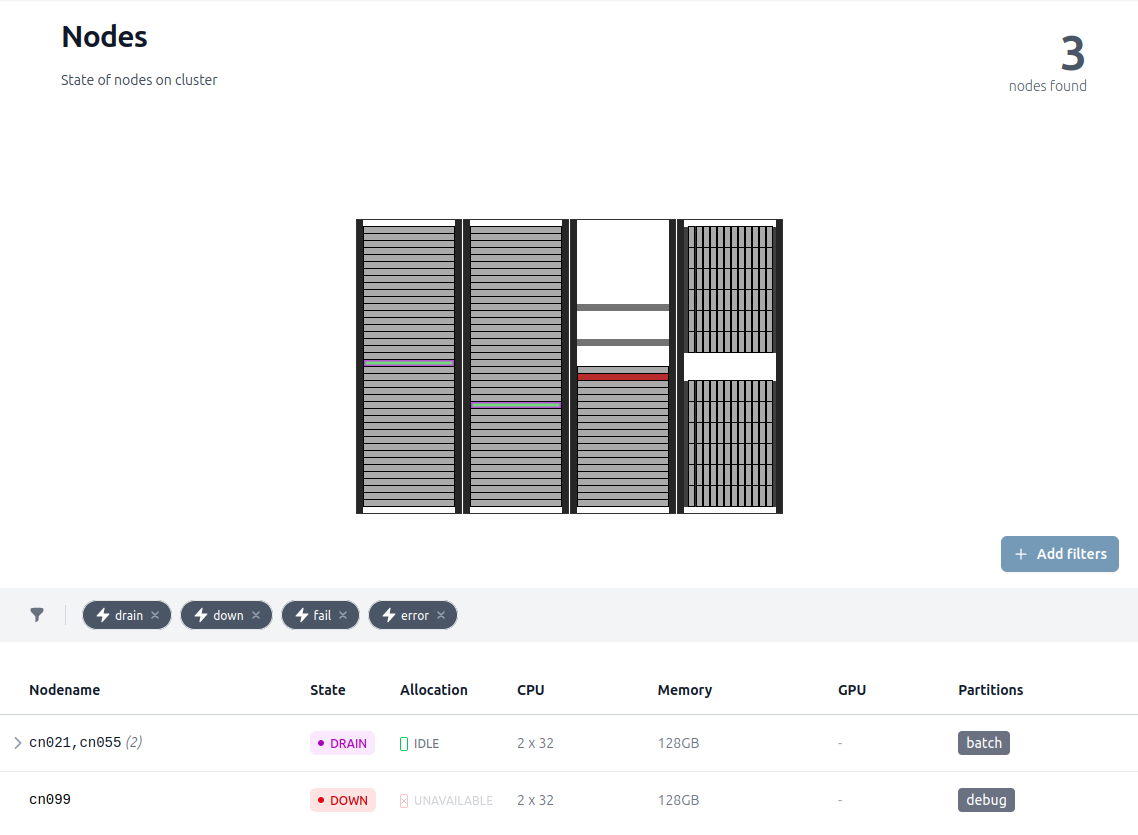
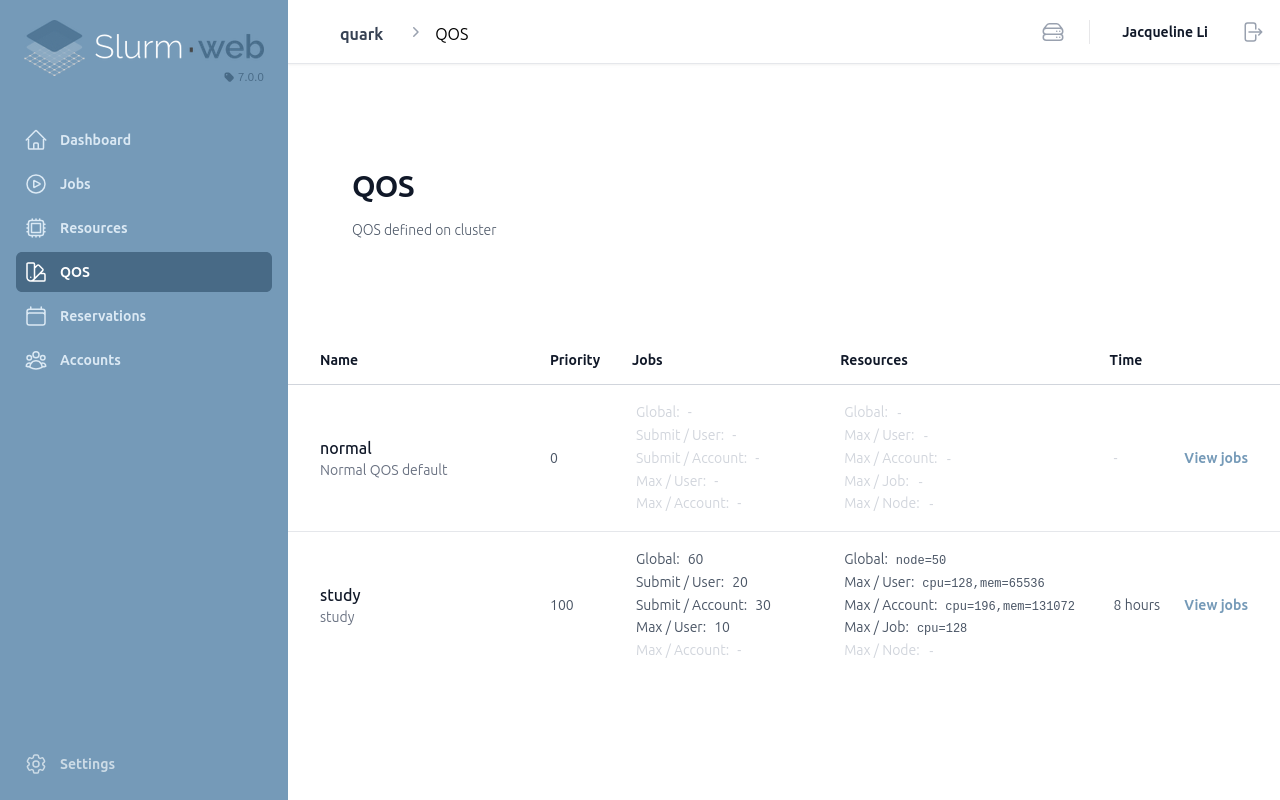
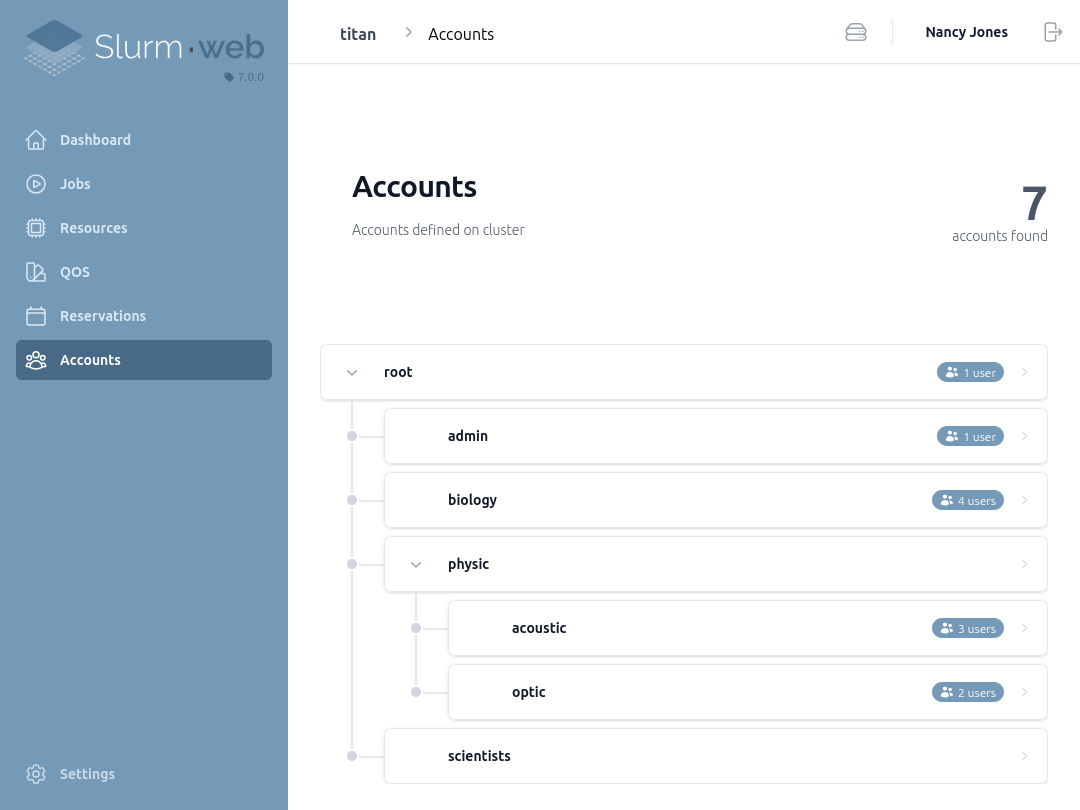
Slurm-web gives HPC cluster operators and users a browser dashboard for watching jobs, nodes, and GPUs across a Slurm cluster instead of living in squeue output. The overview page charts resource and job status with interactive graphs, so a glance tells you whether the machine is busy, idle, or quietly failing. The jobs view filters and sorts instantly, updates live as jobs change state, and uses colored badges so pending, running, and failed work sorts itself out visually at any scale. Node views go deeper: advanced visualizations show node status across racking topology, GPU utilization is tracked alongside CPU resources, and problems surface as highlighted issues rather than a line in a log file. Account trees, quality-of-service settings, and advanced reservations get intuitive graphical views that make fair-share politics legible to everyone involved. Prometheus integration collects and charts timeseries metrics for longer-term capacity questions. Access is enterprise-ready: LDAP and Active Directory authentication, OpenID Connect single sign-on through providers like Keycloak or Authentik, and granular role-based permissions decide who sees which clusters. Several clusters can be monitored from one deployment, the interface supports dark mode and custom branding with your own colors and logos, caching keeps the UI responsive against busy controllers, and integrated help explains each view in place. Running on a dedicated VPS on RepoCloud with guaranteed CPU, RAM, and SSD, full root SSH access, and a browser serial console. MIT licensed.
Benefits
- See the whole cluster at once
- Interactive dashboard charts show resource and job status across the cluster in real time, replacing pages of terminal output with a view anyone on the team can read.
- Jobs you can actually triage
- Instant filtering, sorting, live status updates, and colored job badges let operators and users find stuck, failed, or pending work in seconds instead of grep sessions.
- Hardware problems made visible
- Node status rendered over rack topology plus GPU utilization monitoring turns failing hardware and idle accelerators into highlighted issues instead of silent capacity loss.
- Enterprise access control built in
- LDAP, Active Directory, and OpenID Connect sign-on combine with granular role-based permissions, so multiple clusters can be exposed safely to different teams and user groups.
Features
- Interactive cluster dashboard
- Charts of resources and jobs status update live, giving operators a real-time overview of utilization, queues, and cluster health in the browser.
- Live jobs explorer
- Jobs can be filtered, sorted, and searched instantly, with live status refresh and colored badges that communicate state without reading raw scheduler output.
- Rack topology visualization
- Node status is drawn over the physical racking layout, and GPU utilization is monitored per node so hardware issues and idle accelerators stand out immediately.
- Accounts, QOS, reservations
- Graphical views of the account tree, quality-of-service tiers, and advanced reservations make allocation policy understandable to users and administrators alike.
- Prometheus metrics integration
- Slurm-web collects and charts timeseries metrics through Prometheus, supporting capacity planning and historical analysis beyond the live dashboard view.
- SSO and RBAC
- LDAP, Active Directory, and OpenID Connect authentication pair with advanced role-based permissions, multi-cluster support, custom branding, and transparent caching.