Cockpit
Cockpit puts Linux server administration in a web browser, rendering storage, networking, containers, and virtual machines as visual panels you click through instead of command-line syntax you memorize. It ships in every major Linux distribution and activates through systemd socket activation, consuming zero resources until someone connects on port 9090. What makes it different from other admin panels: every change through the web interface appears instantly at the command line, and every terminal change reflects in the browser in real time. No abstraction layer sits between the UI and the operating system, which means no configuration drift. Storage management covers disk partitioning, RAID arrays, LUKS encryption, LVM volumes, and NFS shares. Network configuration handles bonds, bridges, VLANs, and firewall zones through visual editors. Native Podman integration pulls images, creates containers, manages pods, and provides terminal access into running processes. KVM/libvirt support handles VM creation, cloning, snapshots, and live migration with console access. A built-in terminal provides shell access when the web interface is not enough, and the journal viewer filters systemd logs by severity and unit. Multi-server management connects additional hosts over SSH, presenting a unified dashboard across your entire infrastructure from one browser tab. Runs on a dedicated RepoCloud VPS with full root SSH access and browser serial console. LGPL licensed.
Dagu
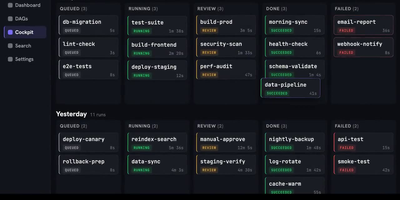
With over 3,700 GitHub stars and growing adoption among teams tired of managing complex orchestration platforms, Dagu delivers a complete workflow engine as a single Go binary that requires no external database, message broker, or framework installation. Define directed acyclic graphs in declarative YAML — specifying dependencies, schedules, retries, timeouts, approvals, and notifications — while keeping existing shell scripts, containers, and tools completely unchanged. The built-in Web UI provides live pipeline visualization, per-step log streaming, run history browsing, artifact previewing, manual retry controls, and workflow YAML editing without SSHing into servers. Execute steps as shell commands, Docker containers, Kubernetes Jobs, SSH remote commands, SQL queries, or HTTP requests, with conditional branching and parallel execution handled natively. The integrated Model Context Protocol server exposes dagu_read, dagu_change, and dagu_execute tools, enabling AI agents like Claude, Codex, and Cursor to inspect workflow state, preview YAML modifications, and control runs through authenticated endpoints. The harness.run executor lets external coding-agent CLIs operate inside DAG steps with full scheduling and approval gate support. Scale beyond a single machine with the distributed worker mode, which dispatches tasks to remote nodes via gRPC with automatic label-based routing and worker selection. Deploy with Docker, the official Helm chart for Kubernetes, or a simple binary download requiring only a Linux, macOS, or Windows host. Running on a dedicated VPS on RepoCloud with guaranteed CPU, RAM, and SSD, full root SSH access, and a browser serial console. GPLv3 licensed.
Apache HertzBeat
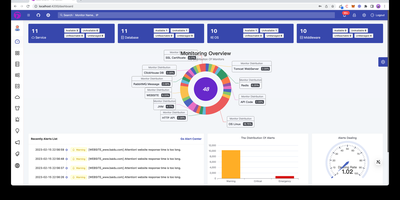
Instead of deploying proprietary background agents across dozens of target nodes, engineers rely on Apache HertzBeat to monitor real-time infrastructure health, metrics gathering, threshold alerting, and public status pages from a central operations platform. Operations teams can poll hundreds of target services without deploying proprietary background daemons, gathering performance data across Linux hosts, Kubernetes clusters, SQL databases, and network switches using native connection protocols. Engineers can define custom monitoring targets directly within the web dashboard by composing declarative YAML templates that specify polling intervals, parsing expressions, and metric extraction rules. The centralized alert engine processes inbound threshold events, suppresses cascading alert storms during maintenance windows, and dispatches actionable incident notifications to Discord channels, Slack rooms, Telegram groups, and webhook endpoints. Telemetry streams flow into interactive charts with customizable refresh cadences, enabling site reliability engineers to inspect latency waterfalls, correlate log spikes against CPU exhaustion, and track disk capacity trends over extended timeframes. Administrators can also publish real-time public status pages that inform external stakeholders about service availability, scheduled downtime, and ongoing incident resolutions. Running on a dedicated VPS on RepoCloud with guaranteed CPU, RAM, and SSD, full root SSH access, and a browser serial console. Apache 2.0 licensed.
Percona PMM
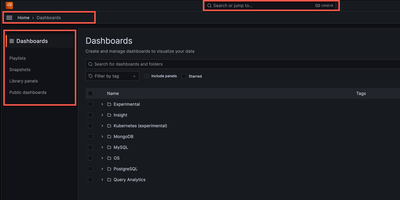
Backed by 1,080+ GitHub stars and maintained by Percona with the latest release v3.8.1 in June 2026, Percona Monitoring and Management delivers the open-source database observability platform that provides a single pane of glass across MySQL, PostgreSQL, MongoDB, Valkey, and Redis databases deployed on-premises, cloud, or hybrid environments. The Go-powered PMM Server collects metrics from lightweight PMM Client agents with minimal performance impact, storing time-series data in ClickHouse for fast querying across configurable retention periods. Query Analytics ranks every query by load across all database engines from one unified dashboard, drilling from fleet-level performance down to individual problematic queries with explain plans, per-query metrics, and anomaly detection. Real-time Query Analytics streams live MongoDB operations updated every 1-5 seconds for immediate troubleshooting of lock contention and long-running queries. Built-in Percona Advisors continuously scan connected databases for security gaps, misconfigurations, and performance problems, distilling decades of DBA expertise into automated actionable recommendations. Percona Alerting integrates with 15+ notification channels including Slack, PagerDuty, email, and webhooks to trigger on custom metric thresholds. Database-specific dashboards visualize InnoDB storage engine details, WiredTiger cache metrics, PostgreSQL tuple activity, replication lag, and cluster health with annotations for root-cause correlation. Deployment options include Docker single-container setup, Podman rootless execution, and Helm charts for Kubernetes with Ingress controller support and ConfigMap management. Running on a dedicated VPS on RepoCloud with guaranteed CPU, RAM, and SSD, full root SSH access, and a browser serial console. AGPL-3.0 licensed.
Grafana OnCall
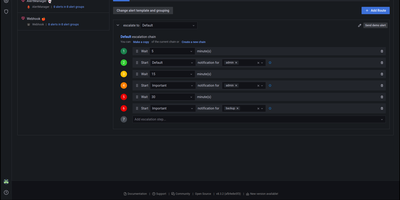
With 3,900 GitHub stars, 140 contributors, and 380 releases since its 2022 launch, Grafana OnCall delivers developer-friendly incident response that routes alerts from any monitoring system to the right engineer at the right time through the right channel. The platform accepts alerts via unique API URLs from Alertmanager, Grafana Alerting, Zabbix, Datadog, Pagerduty-compatible sources, Jira, inbound email, and generic HTTP webhooks, then applies routing templates to direct each alert to the appropriate escalation chain. Escalation chains define notification sequences — notify the primary on-call via Slack, wait 5 minutes, escalate to SMS and phone, wait 10 minutes, page the secondary on-call and notify the engineering manager — continuing until acknowledgment or resolution. On-call schedules support multi-layer rotations with overrides, shift swaps, and timezone-aware handoffs rendered directly inside Grafana dashboards. ChatOps integration publishes alert groups to Slack channels and Telegram groups with interactive buttons for acknowledge, resolve, and silence actions. Template engines based on Jinja2 control alert grouping, appearance rendering, and behavioral automation. The REST API enables programmatic management of integrations, schedules, and escalation policies. Deploy via Docker Compose with PostgreSQL, Redis, and Celery workers alongside your existing Grafana instance. Running on a dedicated VPS on RepoCloud with guaranteed CPU, RAM, and SSD, full root SSH access, and a browser serial console. GNU AGPL v3 licensed.
GPT Load
GPT Load has become the go-to self-hosted AI gateway for teams managing multiple LLM provider credentials behind a single URL. The Go-built proxy transparently preserves native API formats for OpenAI Chat Completions, OpenAI Responses, Anthropic Messages, and Google Gemini — applications swap one base URL and keep their existing SDK integration untouched. Twenty built-in channels cover official APIs (OpenAI, Anthropic, Gemini, xAI), cloud platforms (Azure OpenAI, AWS Bedrock, Google Vertex AI), model services (DeepSeek, Moonshot AI, SiliconFlow, Zhipu AI, Alibaba Cloud, Volcengine, OpenRouter, Groq), and subscription accounts (Codex, Claude, Antigravity, Grok) using the same credential management, scheduling, and health system. The intelligent key pool rotates among valid credentials using atomic counters for fair high-concurrency distribution, automatically blacklists failing keys after configurable thresholds, and recovers them via scheduled health checks — all transparent to clients. Weighted load balancing distributes traffic across multiple upstream endpoints while per-credential proxies route individual keys through different egress paths. The Vue 3 management dashboard provides real-time statistics, group configuration, key testing, request logs with full debugging context, per-model cost estimates, and route inspection. Docker deployment exposes the management interface and proxy on port 3001 with SQLite by default, MySQL or PostgreSQL optional, and Redis for distributed leader-follower cluster scaling. Running on a dedicated VPS on RepoCloud with guaranteed CPU, RAM, and SSD, full root SSH access, and a browser serial console. MIT licensed.
Stormkit
Stormkit delivers a self-hostable PaaS that eliminates vendor lock-in while providing Vercel-class deployment workflows. The Go backend handles build orchestration, hosting, and background job processing while the React frontend provides a complete management dashboard for applications, environments, and team collaboration. Git integration with GitHub, GitLab, and Bitbucket enables push-to-deploy workflows where every commit triggers automated builds with preview links posted directly to pull requests. Serverless functions use filesystem-based routing — each TypeScript or Node.js file in the API directory becomes an endpoint automatically, deploying to AWS Lambda with configurable timeouts. PostgreSQL database schemas ship with automatic migrations, isolated credentials per environment, and secure environment variable injection preventing credential leakage between staging and production. Custom domains provision TLS certificates automatically through Let's Encrypt with support for custom certificates and headers. The environment system creates isolated deployment contexts for production, staging, and development with independent variables, domain bindings, and auto-publish rules per branch. Privacy-respecting server-side analytics track visitors, referrers, and top paths without client cookies or third-party scripts. Role-based access control manages team permissions across applications. Docker Compose deployment provisions the full stack including the API server, hosting service, build runner, and worker server. Running on a dedicated VPS on RepoCloud with guaranteed CPU, RAM, and SSD, full root SSH access, and a browser serial console. AGPL-3.0 licensed.
Vaultwarden
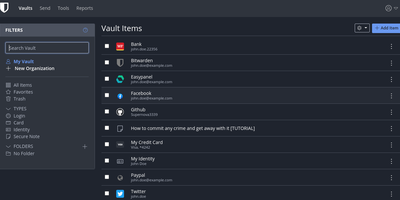
The Bitwarden server, reimplemented in Rust: Vaultwarden (formerly bitwarden_rs) is the unofficial lightweight edition. It speaks the same wire protocol as the official server, so every official Bitwarden client - browser extensions, iOS, Android, desktop, and the bw CLI - connects without modification, while the server itself runs as a single container against SQLite (or MySQL/MariaDB/PostgreSQL) instead of the official multi-container stack that wants gigabytes of RAM. Features Bitwarden gates behind paid tiers ship free: organizations with collections, groups, member roles, and policies; TOTP code storage; file attachments; Bitwarden Send; Emergency Access; event logs; and admin password reset. Two-factor options cover authenticator apps, email, FIDO2 WebAuthn, YubiKey, and Duo, and OIDC-based SSO landed natively in v1.35.0. Zero-knowledge encryption is unchanged - vault data is encrypted client-side and the master password never reaches the server. Attachments and Sends store on local disk or S3-compatible backends, an admin panel manages users and server settings, and backup is copying one data directory. Suited to individuals and teams up to roughly 50 users.
Dockge
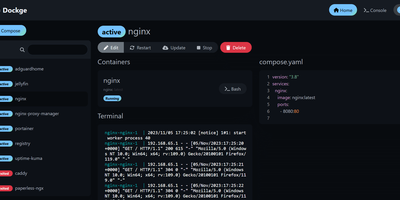
Created by the developer behind Uptime Kuma and carrying over 23,000 GitHub stars, Dockge brings the same clean, reactive design philosophy to Docker Compose stack management with a web interface that makes Portainer's compose handling feel like editing YAML in a terminal over SSH. The interactive editor provides syntax highlighting, inline validation, and a live preview of your compose.yaml files while keeping every stack stored as a standard file on disk in /opt/stacks by default, meaning you can seamlessly switch between the web UI and the docker compose CLI without lock-in or proprietary database formats. Real-time WebSocket updates stream pull progress, container start/stop transitions, and build output directly to the browser with no polling delays. The built-in web terminal opens a shell session inside any running container for quick debugging, while the docker-run-to-compose converter transforms single-container run commands into proper compose.yaml definitions with one click. Multi-agent support introduced in version 1.4.0 connects multiple Docker hosts to a single Dockge dashboard, enabling centralized management of stacks distributed across different servers. Image update detection shows which stacks have newer versions available, and one-click updates pull the latest images and recreate containers without manual intervention. The stack is a single Docker container running on Node.js with Socket.IO for reactivity and stores no external database. Running on a dedicated VPS on RepoCloud with guaranteed CPU, RAM, and SSD, full root SSH access, and a browser serial console. MIT licensed.
Coroot
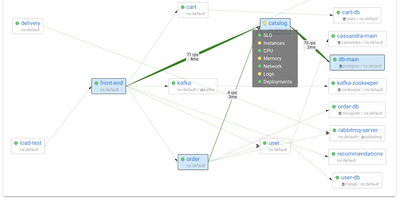
Coroot uses eBPF to capture metrics, distributed traces, logs, and continuous CPU profiles directly from the Linux kernel, delivering full observability without any application code changes, SDKs, or sidecars. From the first minute of deployment, an automatically generated service map covers every microservice, database, message queue, and external dependency with request rate, error rate, and latency measurements. When a service breaches its SLO, AI-powered inspections analyze telemetry across all dimensions to pinpoint the root cause and send a single consolidated alert with findings, replacing the flood of fragmented notifications typical of traditional monitoring. Deployment tracking automatically discovers Kubernetes rollouts and compares each release against the previous one to detect performance regressions, resource spikes, and cost impacts without CI/CD pipeline integration. Continuous profiling captures CPU flame graphs down to the line of code with negligible overhead. Integrated cost monitoring tracks cloud spending across AWS, GCP, and Azure, attributing expenses to individual services and deployments. Coroot supports Prometheus, OpenTelemetry, and ClickHouse as data sources and works identically on Kubernetes clusters, virtual machines, and bare-metal hosts. 7,700+ GitHub stars. Apache-2.0 licensed.
Flipt
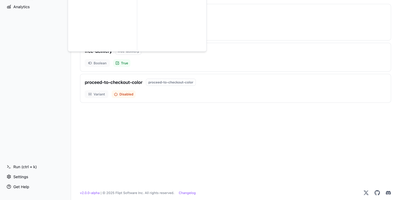
Backed by 4,800+ GitHub stars and trusted by teams replacing LaunchDarkly and Split with a self-hosted solution, Flipt v2 delivers the first truly Git-native feature management platform that treats feature flags as code stored in your own repositories. The architecture eliminates all database dependencies by building immutable in-memory snapshots from YAML flag definitions on every Git commit, delivering sub-millisecond evaluation latency with zero external runtime dependencies beyond the single Go binary. Multi-environment support maps directly to Git abstractions — separate repositories per environment, different directories within the same repository, or different branches — enabling teams to use their existing branching strategy, pull request workflows, and code review processes for flag changes. The evaluation engine supports boolean flags, multivariate string and numeric variants, segment-based targeting with constraint rules, percentage rollouts, and namespace isolation. Native SCM integration with GitHub, GitLab, BitBucket, Azure DevOps, and Gitea creates merge proposals directly from the UI with GPG-signed commits. Flipt implements the OpenFeature Remote Evaluation Protocol with official providers for Go, Node.js, Python, Java, C#, Ruby, and Web SDKs, enabling vendor-agnostic flag evaluation across all services. The gRPC API with REST HTTP gateway exposes flag management, evaluation, and analytics endpoints. Offline mode continues serving flags when the source repository is temporarily unavailable. Running on a dedicated VPS on RepoCloud with guaranteed CPU, RAM, and SSD, full root SSH access, and a browser serial console. Fair Core License (server) / MIT (client SDKs).
SuperPlane
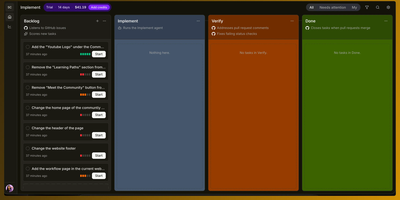
SuperPlane is an open-source engineering automation platform that turns routine backlog tickets into verified, review-ready pull requests while orchestrating complex multi-system workflows across your developer tools. Engineers use the visual infinite canvas to assemble event-driven pipelines with trigger nodes, conditional routing, loops, and human-in-the-loop approval gates. You can delegate pull request code reviews, automated QA testing, documentation generation, and release management to coding agents operating within strictly defined policy boundaries. Custom operational consoles let teams build live monitoring dashboards displaying key delivery metrics, active incident states, and execution histories from connected tools. Integrations connect natively with GitHub, GitLab, Datadog, PagerDuty, Slack, AWS, and leading AI models through webhook events and bi-directional actions. Every automation run maintains durable state persistence across process restarts, ensuring failed steps resume with full input payloads and debugging context intact. Developers can define reusable work orders, configure canvas memory for long-term state retention, and execute fleet commands over SSH or containerized runners. Running on a dedicated VPS on RepoCloud with guaranteed CPU, RAM, and SSD, full root SSH access, and a browser serial console. Apache 2.0 licensed.
Multica
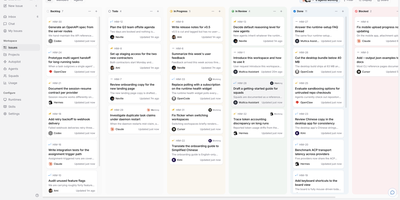
Reaching 45,000 GitHub stars within seven months of launch, Multica is the fastest-growing open-source platform for managing AI coding agents as first-class teammates — assign an issue to Claude Code, Codex, Cursor, Copilot, Kimi, or any of 21 supported agent CLIs and it picks up the work, comments progress in real time via WebSocket, raises blockers, and hands the result back for human review before anything merges. The Go backend (Chi router, sqlc-generated type-safe queries, gorilla/websocket) connects to PostgreSQL 17 with pgvector for semantic search across workspace history, while the Next.js 16 App Router frontend delivers workspace dashboards showing per-agent token spend, execution time, daily cost charts, and runtime status across unlimited connected machines. Agent Skills provide reusable methods, reference material, and supporting files that compound across runs — a persistent knowledge layer that makes each subsequent task faster and more accurate. Squads let a leader agent select the right specialist for subtasks, creating multi-agent workflows without manual orchestration. Review gates ensure no AI-generated code ships to main without explicit human approval. Self-host via Docker Compose or Kubernetes with full Git integration across GitHub, GitLab, Gitea, and Forgejo including self-hosted instances. The CLI and REST API make every surface scriptable, and Autopilot automations trigger agent runs from events. Running on a dedicated VPS on RepoCloud with guaranteed CPU, RAM, and SSD, full root SSH access, and a browser serial console. Apache 2.0 licensed with additional conditions.
Healthchecks
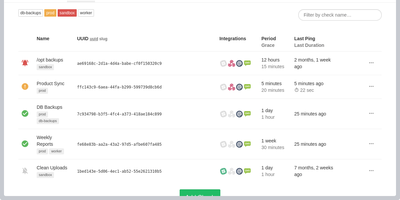
With 10,100+ GitHub stars and 75 releases over a decade of continuous development, Healthchecks is the open-source cron job monitoring service that catches failures your other monitoring tools miss — the jobs that silently stop running, the backups that never completed, the nightly reports that disappeared without error. The dead man's switch architecture requires zero agent installation: your cron jobs, scripts, and services ping a unique URL via HTTP request or email, and Healthchecks alerts you only when a ping does not arrive within the configured Period and Grace Time window. Each check supports cron expression scheduling, optional start, success, and failure signals for measuring execution time, and HTTP body keyword filtering for intelligent alert routing. Twenty-five notification integrations cover every channel teams actually use: Slack, Discord, Microsoft Teams, PagerDuty, Opsgenie, Splunk On-Call, Telegram, Signal, WhatsApp, SMS, email, webhooks, GitHub Issues, Pushover, ntfy, Gotify, Matrix, Mattermost, Zulip, Pushbullet, PagerTree, Spike.sh, and Trello. The web dashboard provides a visual grid showing real-time status with color-coded badges and per-check integration toggles. Monthly, weekly, and daily email reports summarize uptime trends with checks sorted by downtime duration. Team management supports projects with member roles and read-only access. Prometheus metrics expose check health and grace state for Grafana dashboards. WebAuthn and TOTP two-factor authentication secure accounts. Deploy via Docker images available for amd64, arm/v7, and arm64 architectures. Running on a dedicated VPS on RepoCloud with guaranteed CPU, RAM, and SSD, full root SSH access, and a browser serial console. BSD 3-Clause licensed.
Zerobyte
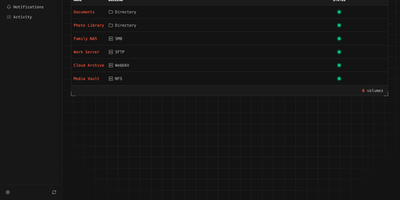
Replace fragile cron scripts and complex terminal commands with Zerobyte, a self-hosted web control center that schedules, monitors, and restores encrypted backups across any cloud or local storage infrastructure. System administrators can connect local drives, NFS shares, SMB exports, WebDAV mounts, and SFTP endpoints as backup sources with custom inclusion and exclusion rules. The visual interface lets you dispatch incremental, client-side encrypted snapshots to local directories, Amazon S3, Google Cloud Storage, Azure Blob, and forty cloud storage providers supported via rclone. You can schedule automated jobs using cron expressions, configure custom retention windows to automatically prune obsolete archives, and run repository health checks directly from the browser. Interactive file trees allow operators to inspect historical snapshot contents, download specific documents, or restore entire directory structures to their original locations in a single click. Configurable pre-backup and post-backup HTTP webhooks help pause databases before snapshots, execute dump commands, and alert teams through Discord, Slack, Telegram, or ntfy notifications. Multi-repository mirroring duplicates critical backups to secondary cloud providers for disaster recovery. Running on a dedicated VPS on RepoCloud with guaranteed CPU, RAM, and SSD, full root SSH access, and a browser serial console. AGPL-3.0 licensed.
Nexus Repository
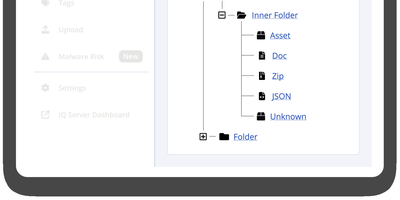
Trusted by millions of developers and integrated into CI/CD pipelines at organizations worldwide, Sonatype Nexus Repository is the industry-standard binary artifact repository manager that stores, organizes, and distributes software components across every major package ecosystem. Community Edition supports over 20 formats including Maven for Java builds, npm for JavaScript packages, Docker for container images, PyPI for Python libraries, NuGet for .NET assemblies, Helm for Kubernetes charts, Go modules, RubyGems, Cargo for Rust crates, Conda for data science environments, APT for Debian packages, Yum for RPM distributions, and Hugging Face for AI/ML models. Three repository types serve different needs: hosted repositories store internally-produced artifacts, proxy repositories cache remote registries like Maven Central, npmjs.org, and Docker Hub reducing bandwidth and improving build reliability, and group repositories aggregate multiple hosted and proxy repositories behind a single URL endpoint. The web UI provides component browsing and search, repository configuration, blob store management with configurable cleanup policies, and direct artifact upload via drag-and-drop. Role-based access control enforces fine-grained permissions per repository with configurable security realms, while the comprehensive REST API enables automated repository provisioning, component management, and integration with Jenkins, GitHub Actions, GitLab CI, and Azure DevOps. External PostgreSQL database support enables Kubernetes deployments with improved backup, restore, and horizontal scaling capabilities. Running on a dedicated VPS on RepoCloud with guaranteed CPU, RAM, and SSD, full root SSH access, and a browser serial console. Eclipse Public License 1.0 licensed.
CPA Manager Plus
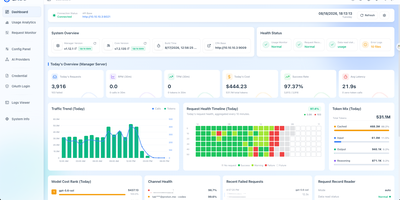
CPA Manager Plus is a self-hosted observability dashboard and management panel that tracks every AI request flowing through your CLI Proxy API gateway, breaking down failures, costs, and account health across providers like OpenAI, Anthropic, xAI, and Codex in one interface. When a request fails, drill into the persistent history to see status codes, affected models, latency, and redacted failure evidence without exposing raw response bodies. The cost analytics engine breaks down token consumption and estimated spend by model, provider, account, API key, project, channel, and time range while tracking input, output, reasoning, cache, and service-tier pricing semantics separately. Model prices sync automatically from models.dev with LiteLLM and OpenRouter fallbacks, and you can add local overrides for aliases or internal models. For teams running Codex or xAI accounts, the health inspector reads quota windows, reset evidence, credential state, and workspace status on a configurable schedule, routing credential failures into an action queue for review rather than letting them silently degrade throughput. Deploy the Lightweight Panel to replace your existing CPA management UI without adding another service, or run Full Mode as a single Docker container that adds the Manager Server with persistent SQLite storage for request history, historical analytics, and automated account inspections. Export or import request history as JSONL for external analysis, and back up the SQLite files alongside your encrypted management keys. Running on a dedicated VPS on RepoCloud with guaranteed CPU, RAM, and SSD, full root SSH access, and a browser serial console. MIT licensed.
Dokku
With over 32,000 GitHub stars and a decade of production use since 2013, Dokku is the original self-hosted Heroku alternative — a Docker-powered PaaS that turns any single Ubuntu server into a full application platform with a simple git push. Deploy applications written in Node.js, Python, Ruby, Go, Java, PHP, Scala, and Clojure using Heroku-compatible buildpacks, Cloud Native Buildpacks via pack-cli, standard Dockerfiles, or pre-built Docker images, with automatic language and framework detection handling the rest. Every deployment runs through zero-downtime checks that health-test new containers before routing traffic via the built-in Nginx reverse proxy, which handles virtual host configuration, WebSocket proxying, and HTTP/2 support automatically. The official plugin ecosystem provides managed datastores including PostgreSQL, MySQL, MariaDB, MongoDB, Redis, RabbitMQ, and Elasticsearch, each provisioned with a single CLI command and linked to apps via environment variables. Automated TLS certificates arrive through the Let's Encrypt plugin with auto-renewal, while persistent storage volumes, cron job scheduling, user ACL management, and process scaling round out the platform capabilities. The entire system is CLI-driven — no web dashboard — keeping resource overhead minimal enough to run multiple applications on a $5/month VPS. Dokku also supports Lambda function builds, custom builder plugins, and app.json-based healthcheck configuration for advanced deployment workflows. Running on a dedicated VPS on RepoCloud with guaranteed CPU, RAM, and SSD, full root SSH access, and a browser serial console. MIT licensed.