Stars
Forks
Watchers
Developer links
Percona PMM
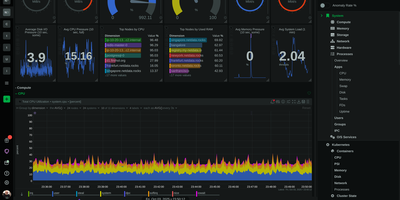
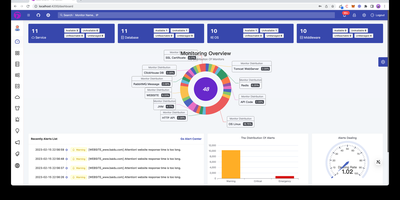
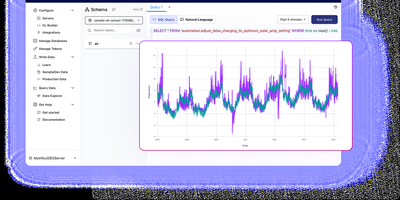
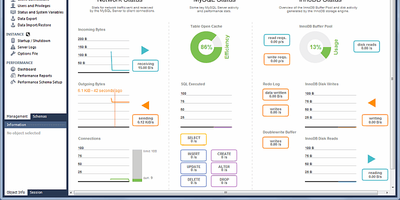
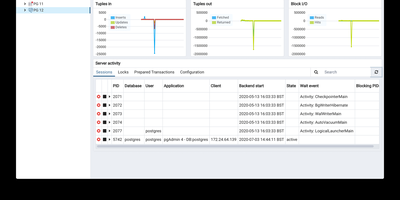
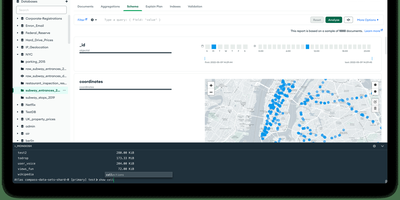
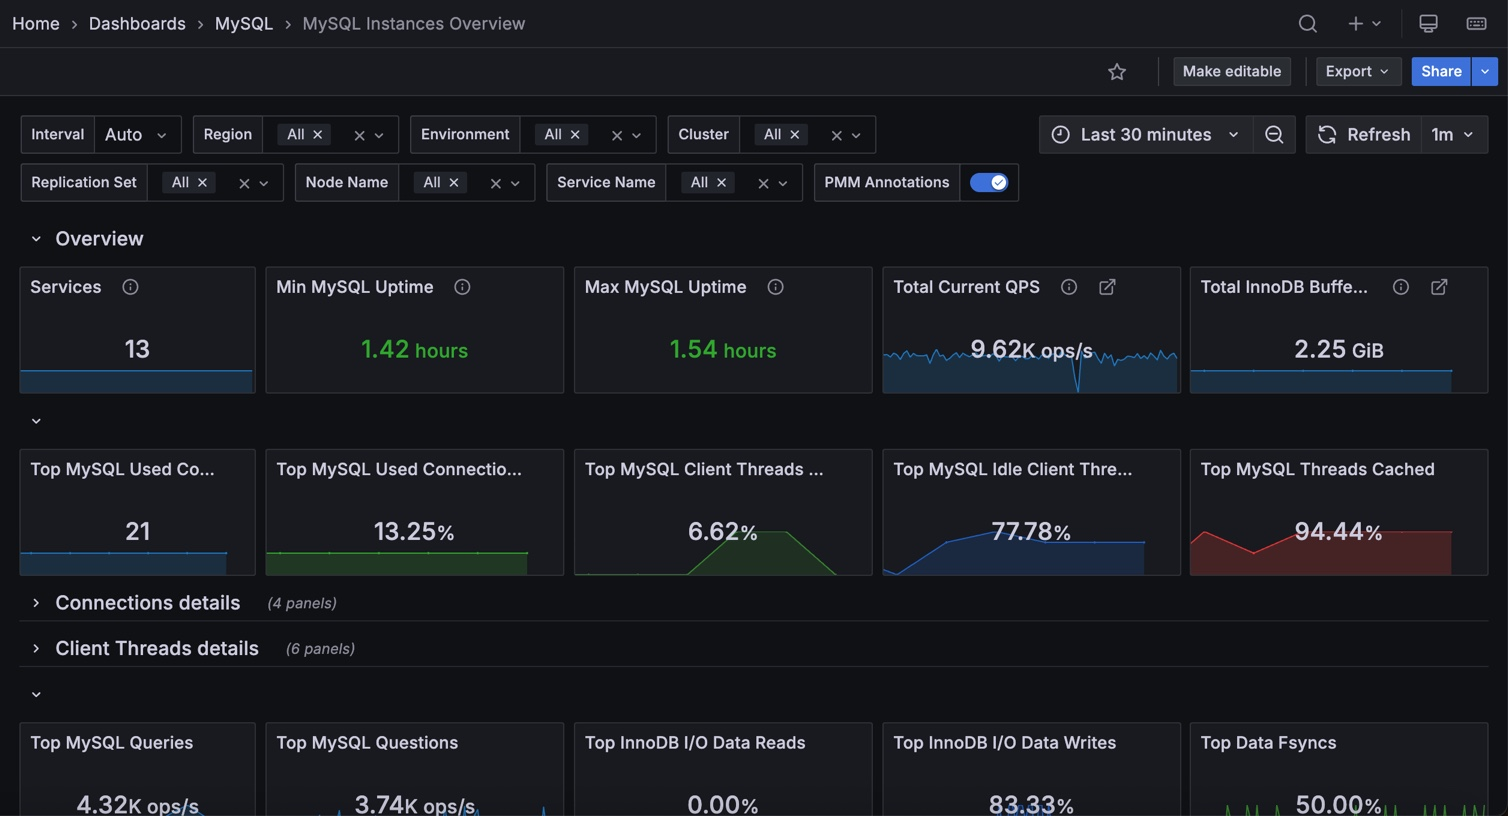
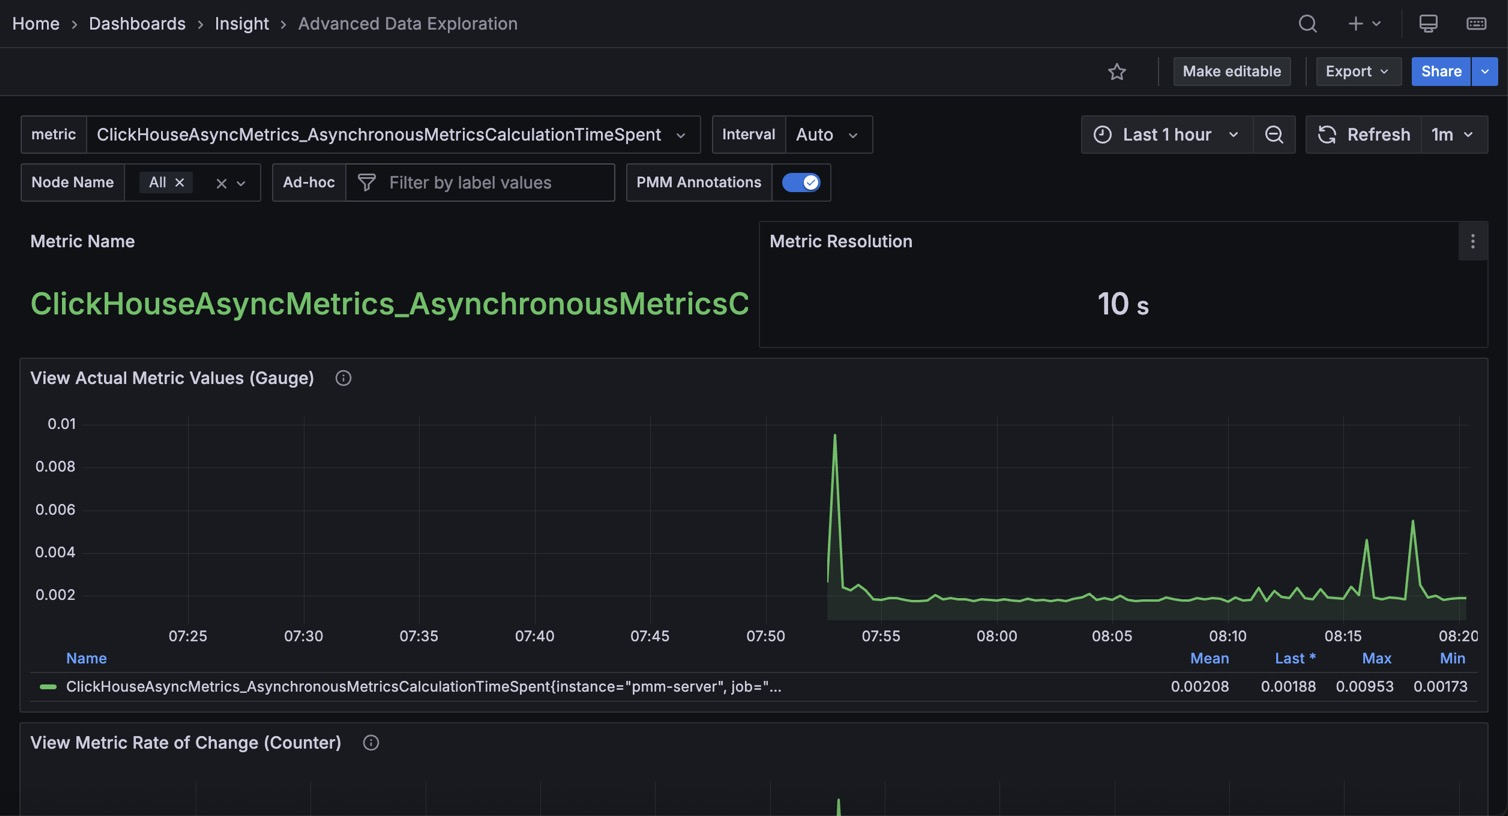
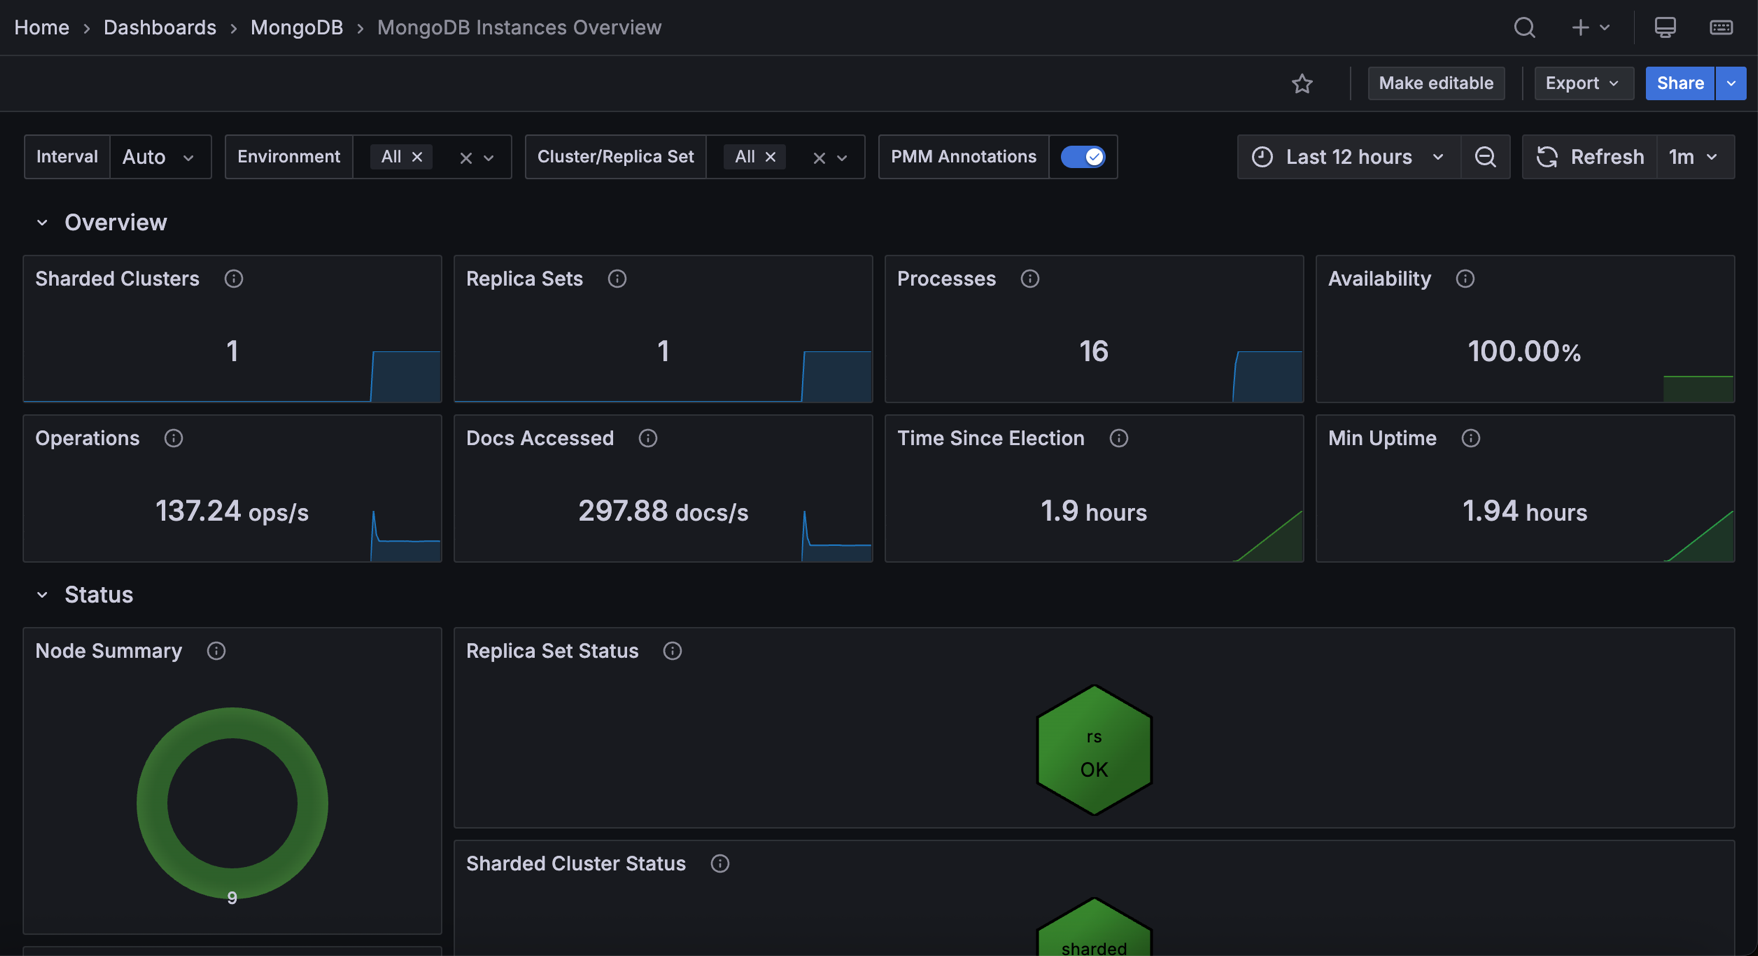
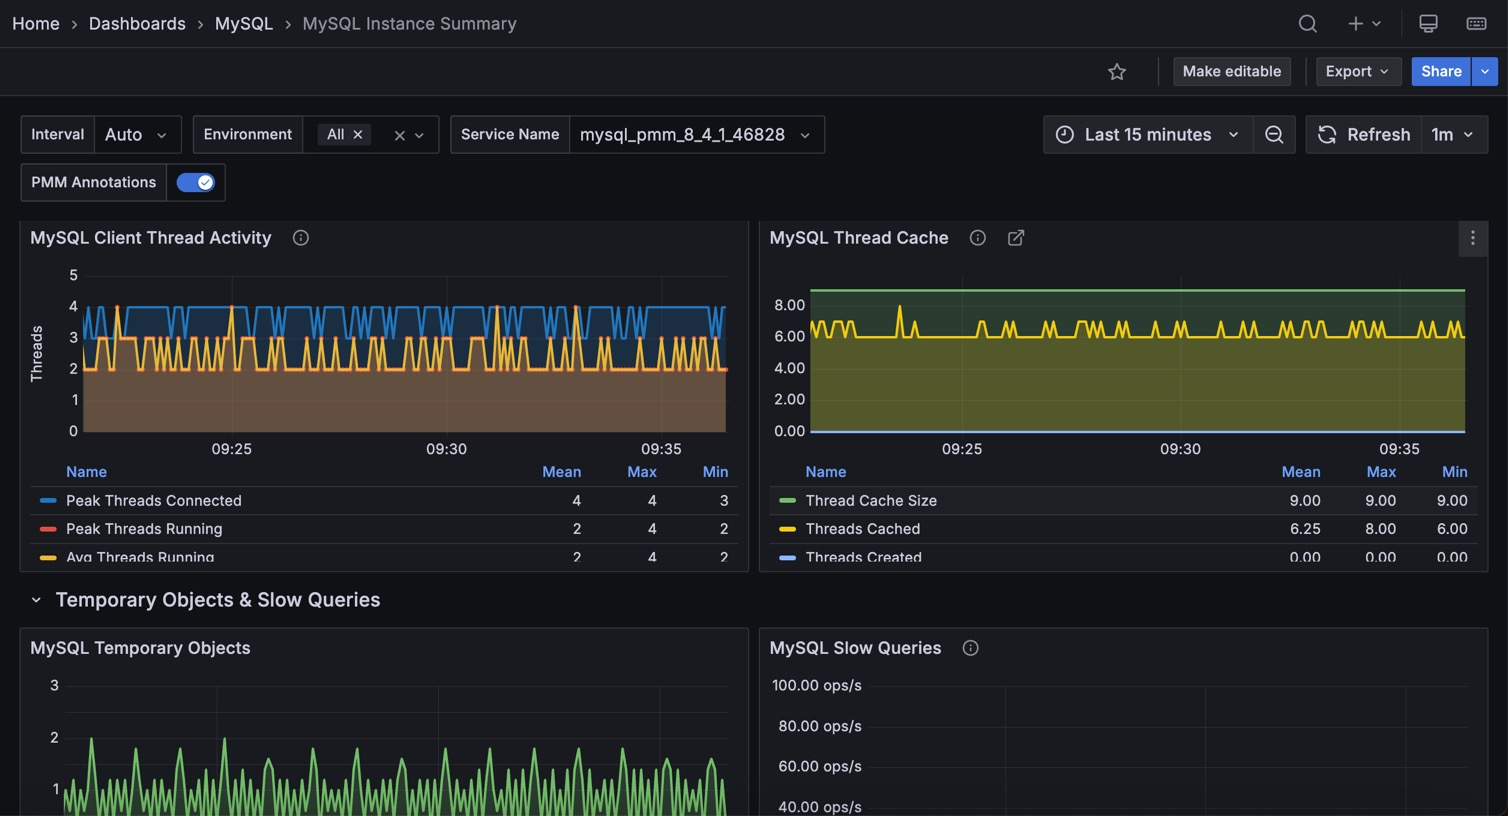
Backed by 1,080+ GitHub stars and maintained by Percona with the latest release v3.8.1 in June 2026, Percona Monitoring and Management delivers the open-source database observability platform that provides a single pane of glass across MySQL, PostgreSQL, MongoDB, Valkey, and Redis databases deployed on-premises, cloud, or hybrid environments. The Go-powered PMM Server collects metrics from lightweight PMM Client agents with minimal performance impact, storing time-series data in ClickHouse for fast querying across configurable retention periods. Query Analytics ranks every query by load across all database engines from one unified dashboard, drilling from fleet-level performance down to individual problematic queries with explain plans, per-query metrics, and anomaly detection. Real-time Query Analytics streams live MongoDB operations updated every 1-5 seconds for immediate troubleshooting of lock contention and long-running queries. Built-in Percona Advisors continuously scan connected databases for security gaps, misconfigurations, and performance problems, distilling decades of DBA expertise into automated actionable recommendations. Percona Alerting integrates with 15+ notification channels including Slack, PagerDuty, email, and webhooks to trigger on custom metric thresholds. Database-specific dashboards visualize InnoDB storage engine details, WiredTiger cache metrics, PostgreSQL tuple activity, replication lag, and cluster health with annotations for root-cause correlation. Deployment options include Docker single-container setup, Podman rootless execution, and Helm charts for Kubernetes with Ingress controller support and ConfigMap management. Running on a dedicated VPS on RepoCloud with guaranteed CPU, RAM, and SSD, full root SSH access, and a browser serial console. AGPL-3.0 licensed.
Benefits
- Unified Multi-Engine Database Monitoring
- Monitor MySQL, PostgreSQL, MongoDB, Valkey, and Redis from a single dashboard with engine-specific metrics covering InnoDB, WiredTiger, tuple activity, and replication health simultaneously.
- Query Analytics Across All Engines
- Rank queries by load across MySQL, PostgreSQL, and MongoDB from one interface with explain plans, per-query latency breakdowns, and real-time MongoDB operation streaming updated every 1-5 seconds.
- Automated Security and Performance Advisors
- Built-in Percona Advisors continuously check connected databases for security vulnerabilities, misconfigurations, and performance degradation with actionable fix recommendations distilled from decades of DBA expertise.
- Flexible Deployment Options
- Deploy via Docker single-container setup with three commands, Podman rootless execution for enhanced security, or Helm charts for Kubernetes clusters with Ingress controller and ConfigMap management.
Features
- Query Analytics (QAN)
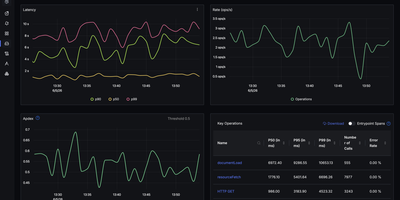
- Drill from fleet-level database performance to individual queries with load ranking, explain plans, per-query metrics, filtering, and anomaly detection across MySQL, PostgreSQL, and MongoDB.
- Real-Time Query Analytics
- Live-stream MongoDB operations updated every 1-5 seconds to spot long-running queries, identify lock contention, and investigate problematic operations as they execute.
- Percona Alerting Engine
- Custom metric threshold alerts delivered through 15+ notification channels including Slack, PagerDuty, email, OpsGenie, and webhooks with configurable severity levels.
- Database-Specific Dashboards
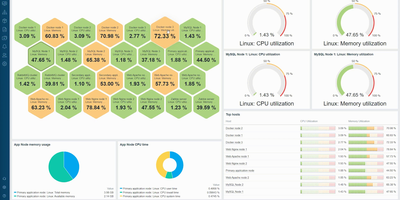
- Pre-built visualizations for InnoDB, XtraDB, MyRocks, WiredTiger, MMAPv1, PostgreSQL connections, replication lag, cluster health, and ProxySQL metrics with annotation support.
- Percona Advisors
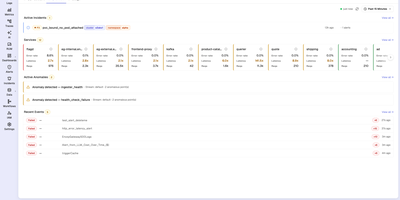
- Automated background checks scanning connected databases for security threats, performance degradation, data loss risks, and configuration drift with prioritized remediation guidance.