Stars
Forks
Watchers
Developer links
Coroot
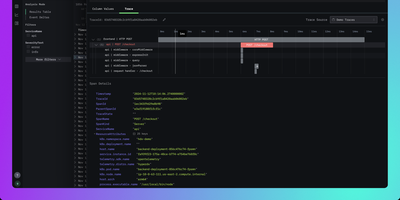
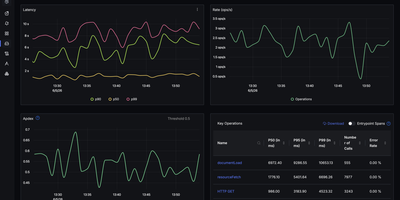
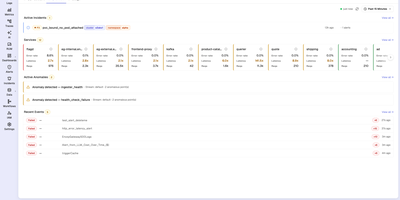
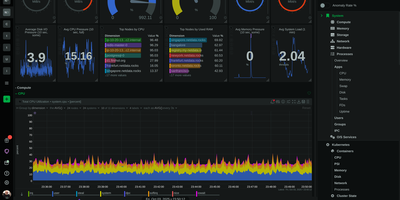
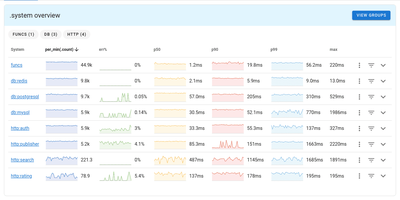
Coroot uses eBPF to capture metrics, distributed traces, logs, and continuous CPU profiles directly from the Linux kernel, delivering full observability without any application code changes, SDKs, or sidecars. From the first minute of deployment, an automatically generated service map covers every microservice, database, message queue, and external dependency with request rate, error rate, and latency measurements. When a service breaches its SLO, AI-powered inspections analyze telemetry across all dimensions to pinpoint the root cause and send a single consolidated alert with findings, replacing the flood of fragmented notifications typical of traditional monitoring. Deployment tracking automatically discovers Kubernetes rollouts and compares each release against the previous one to detect performance regressions, resource spikes, and cost impacts without CI/CD pipeline integration. Continuous profiling captures CPU flame graphs down to the line of code with negligible overhead. Integrated cost monitoring tracks cloud spending across AWS, GCP, and Azure, attributing expenses to individual services and deployments. Coroot supports Prometheus, OpenTelemetry, and ClickHouse as data sources and works identically on Kubernetes clusters, virtual machines, and bare-metal hosts. 7,700+ GitHub stars. Apache-2.0 licensed.
Benefits
- Zero-Code eBPF Instrumentation
- eBPF-based agent captures metrics, traces, logs, and profiles from the Linux kernel without requiring application code changes, SDKs, sidecars, or manual instrumentation setup.
- AI-Powered Root Cause Analysis
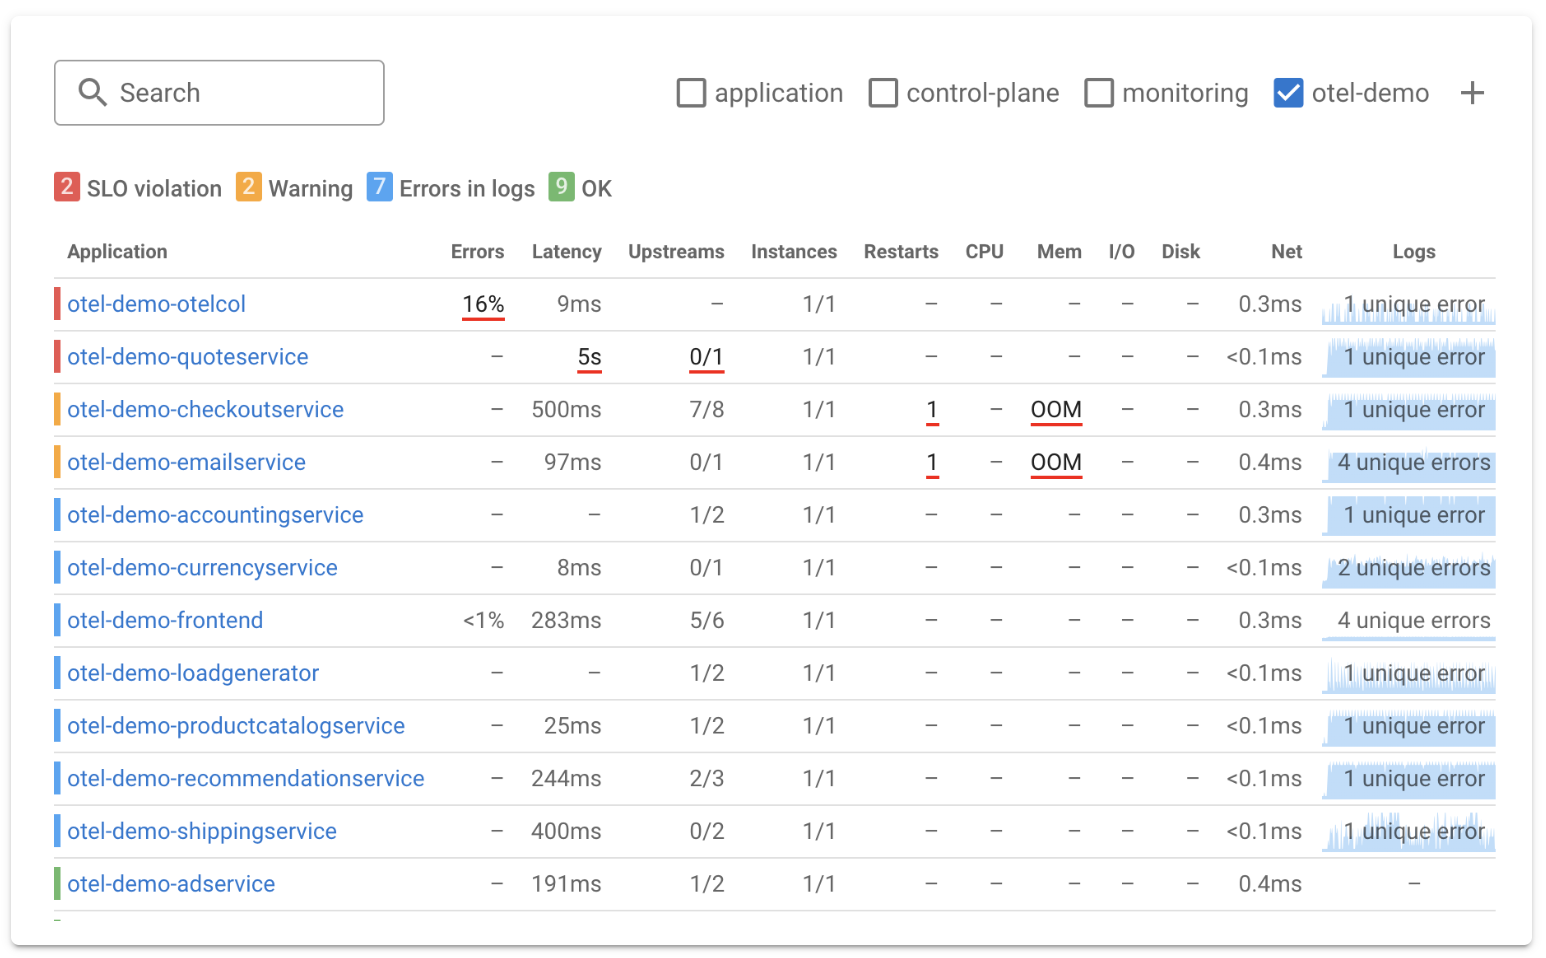
- Automated inspections analyze telemetry across metrics, logs, and traces to identify root causes when SLOs are breached, sending consolidated alerts with actionable findings.
- Automatic Service Discovery
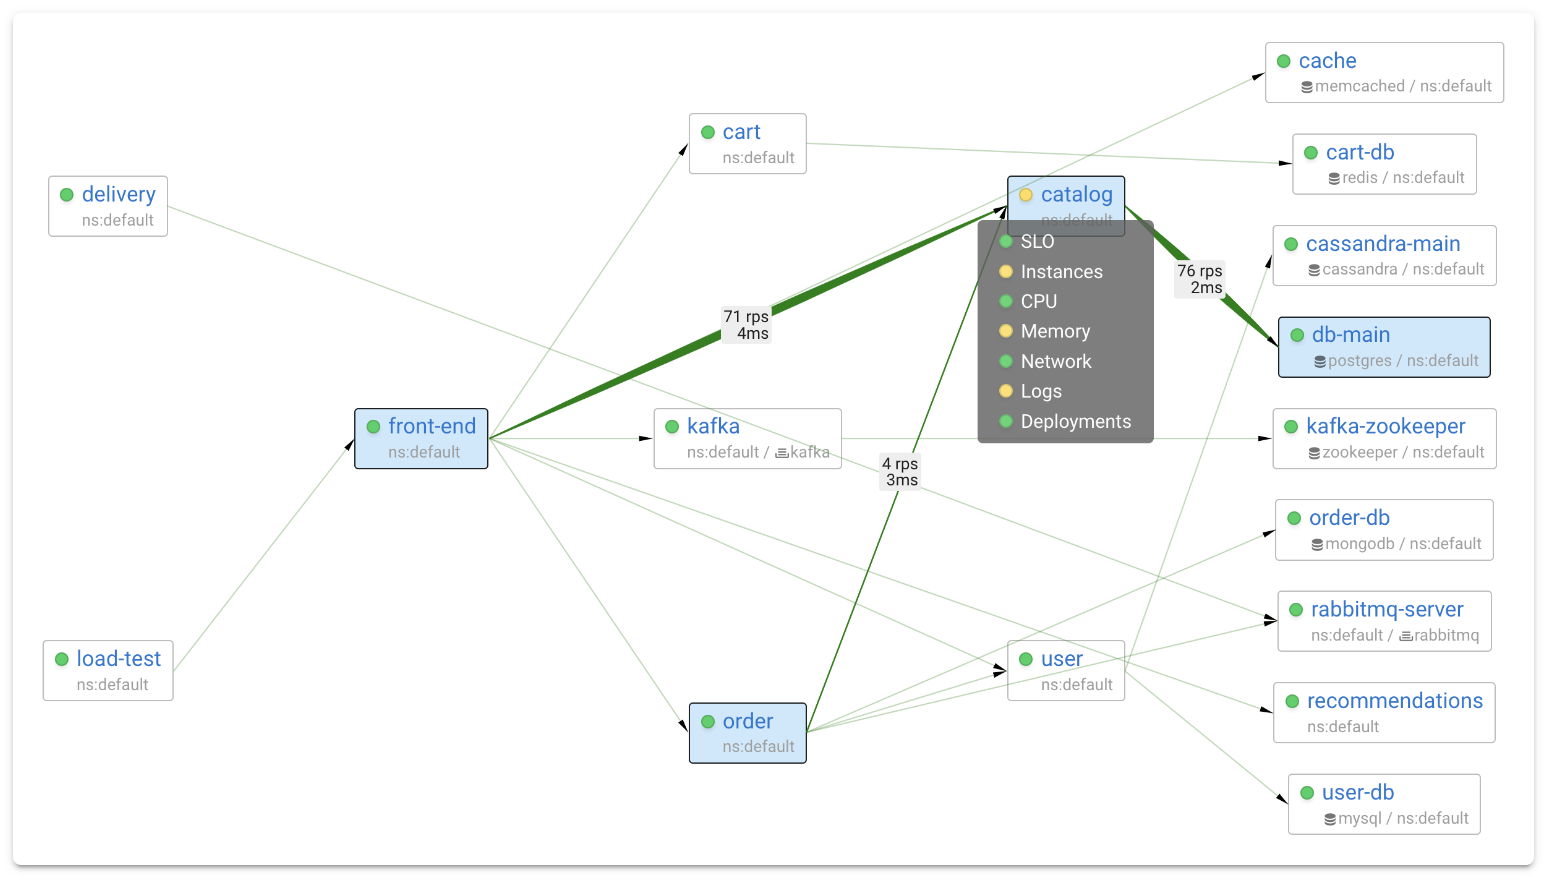
- Complete service map generated automatically covering all microservices, databases, queues, and external dependencies with request rate, error rate, and latency measurements.
- Deployment and Cost Tracking
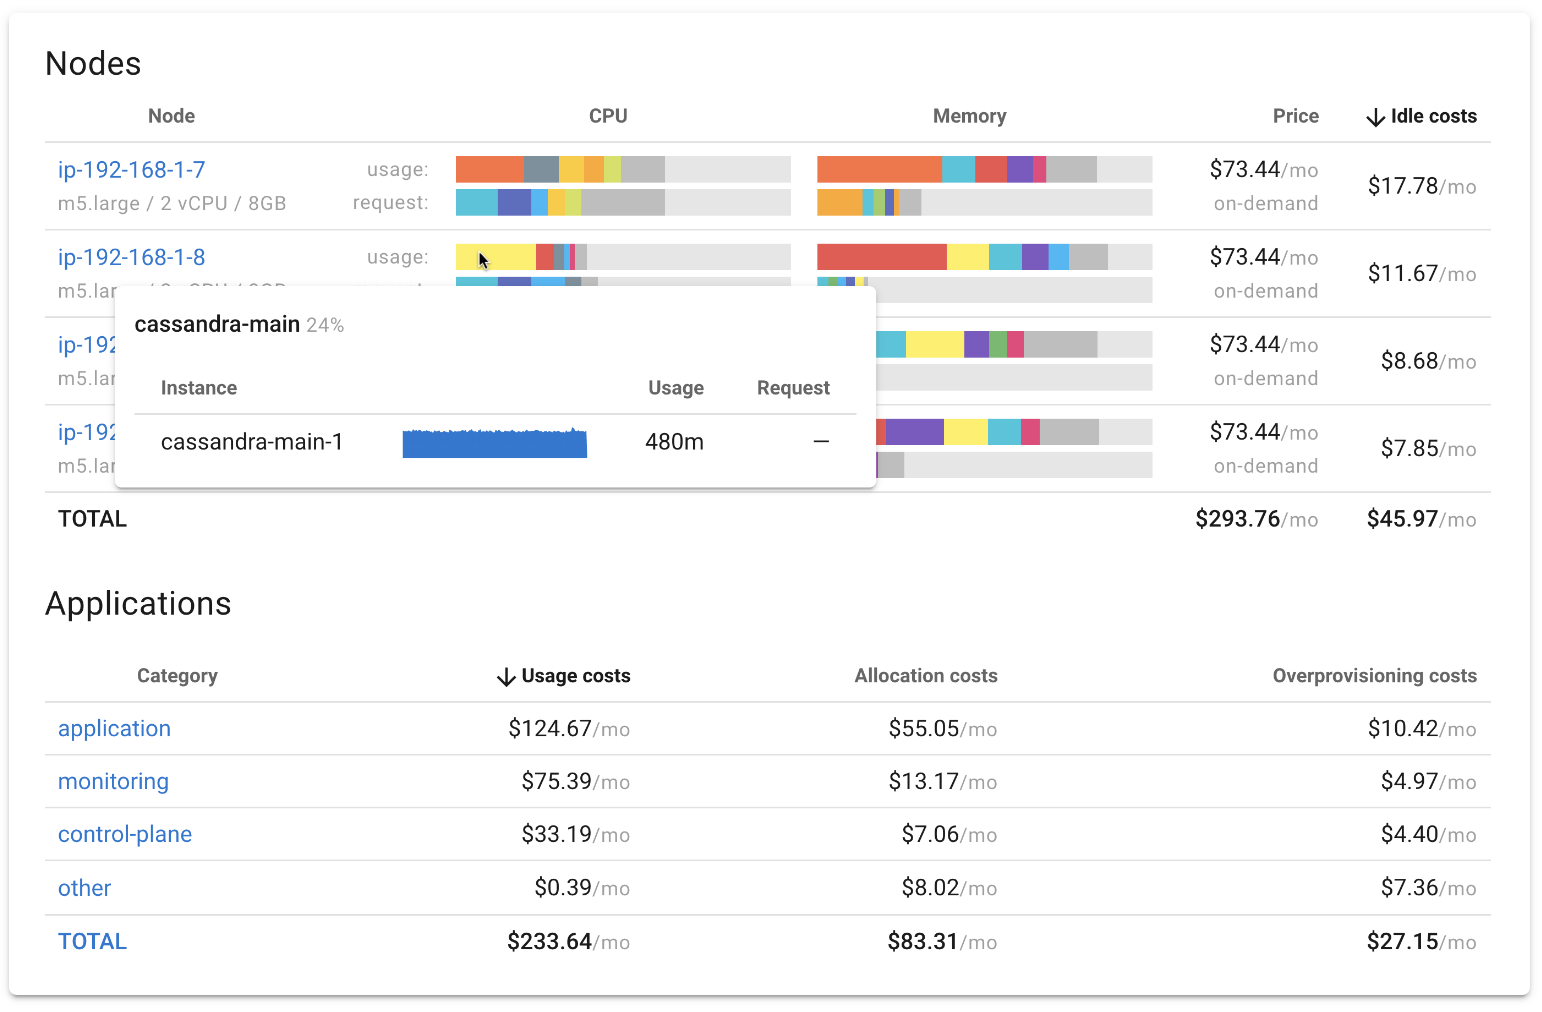
- Automatic Kubernetes rollout detection compares each release against its predecessor for performance regressions while integrated cost monitoring attributes cloud spending per service.
Features
- Service Map
- Auto-generated topology showing all services, databases, and dependencies with RED metrics, connection details, and latency breakdown per path.
- SLO-Based Alerting
- Define availability and latency SLOs per service with automated inspections that detect over 80 common issues and consolidate into single alerts.
- Continuous Profiling
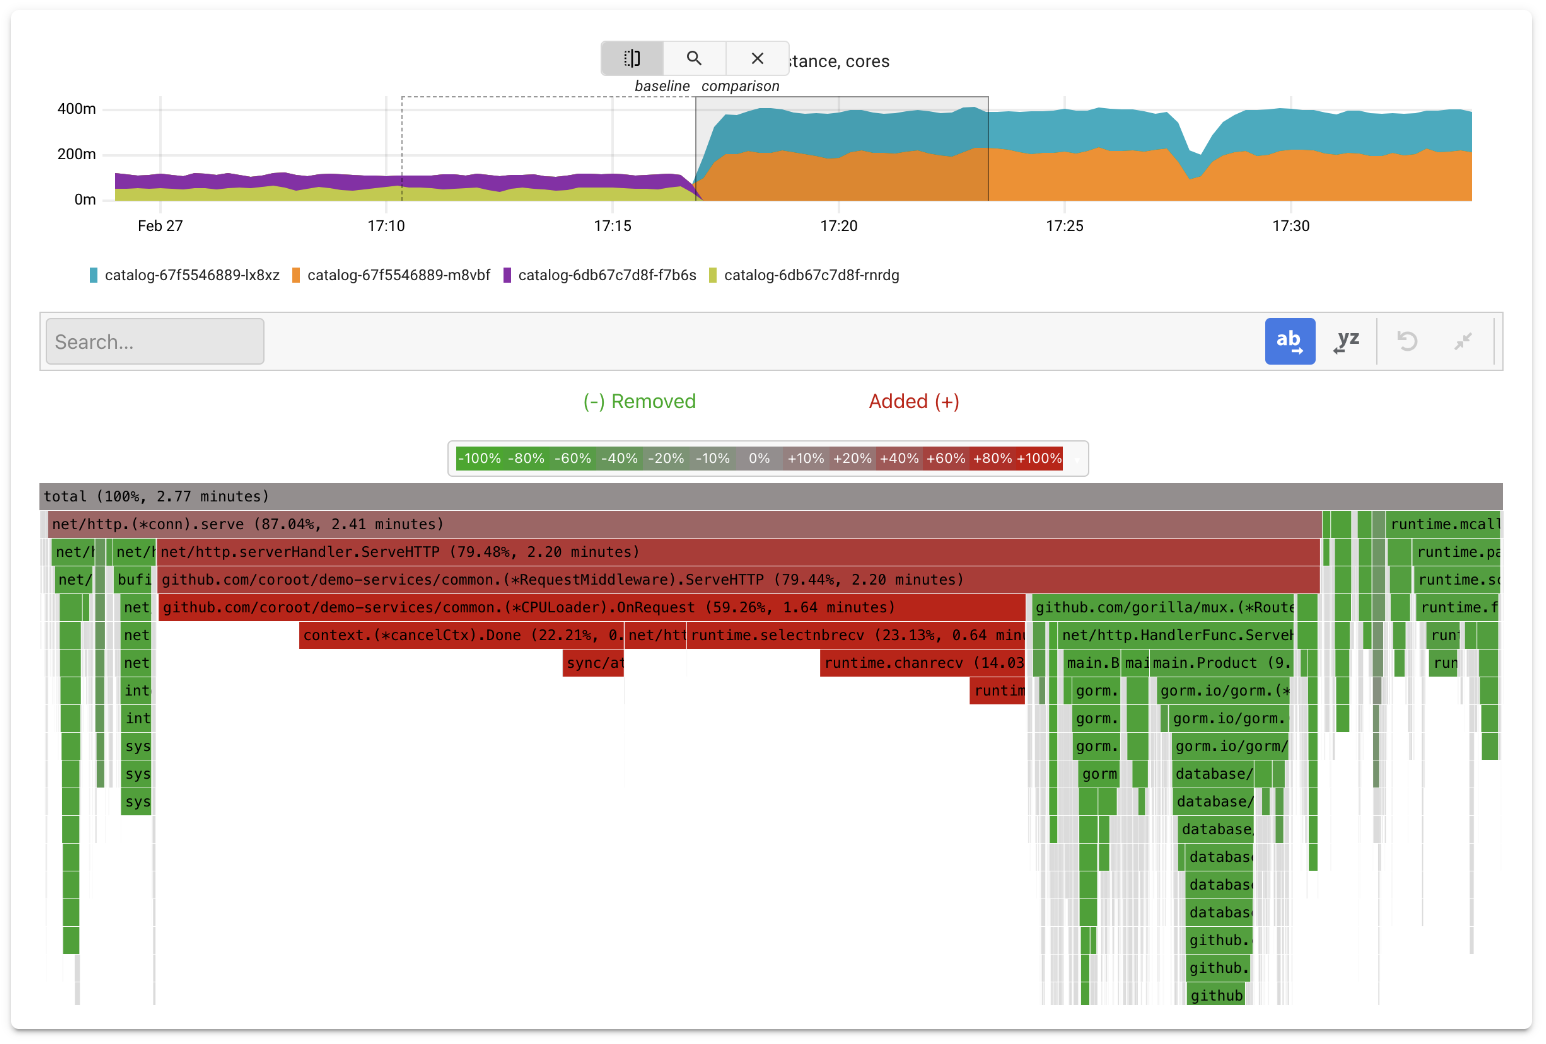
- Always-on CPU profiling captures flame graphs down to the line of code with negligible overhead and no instrumentation required.
- Log Analysis
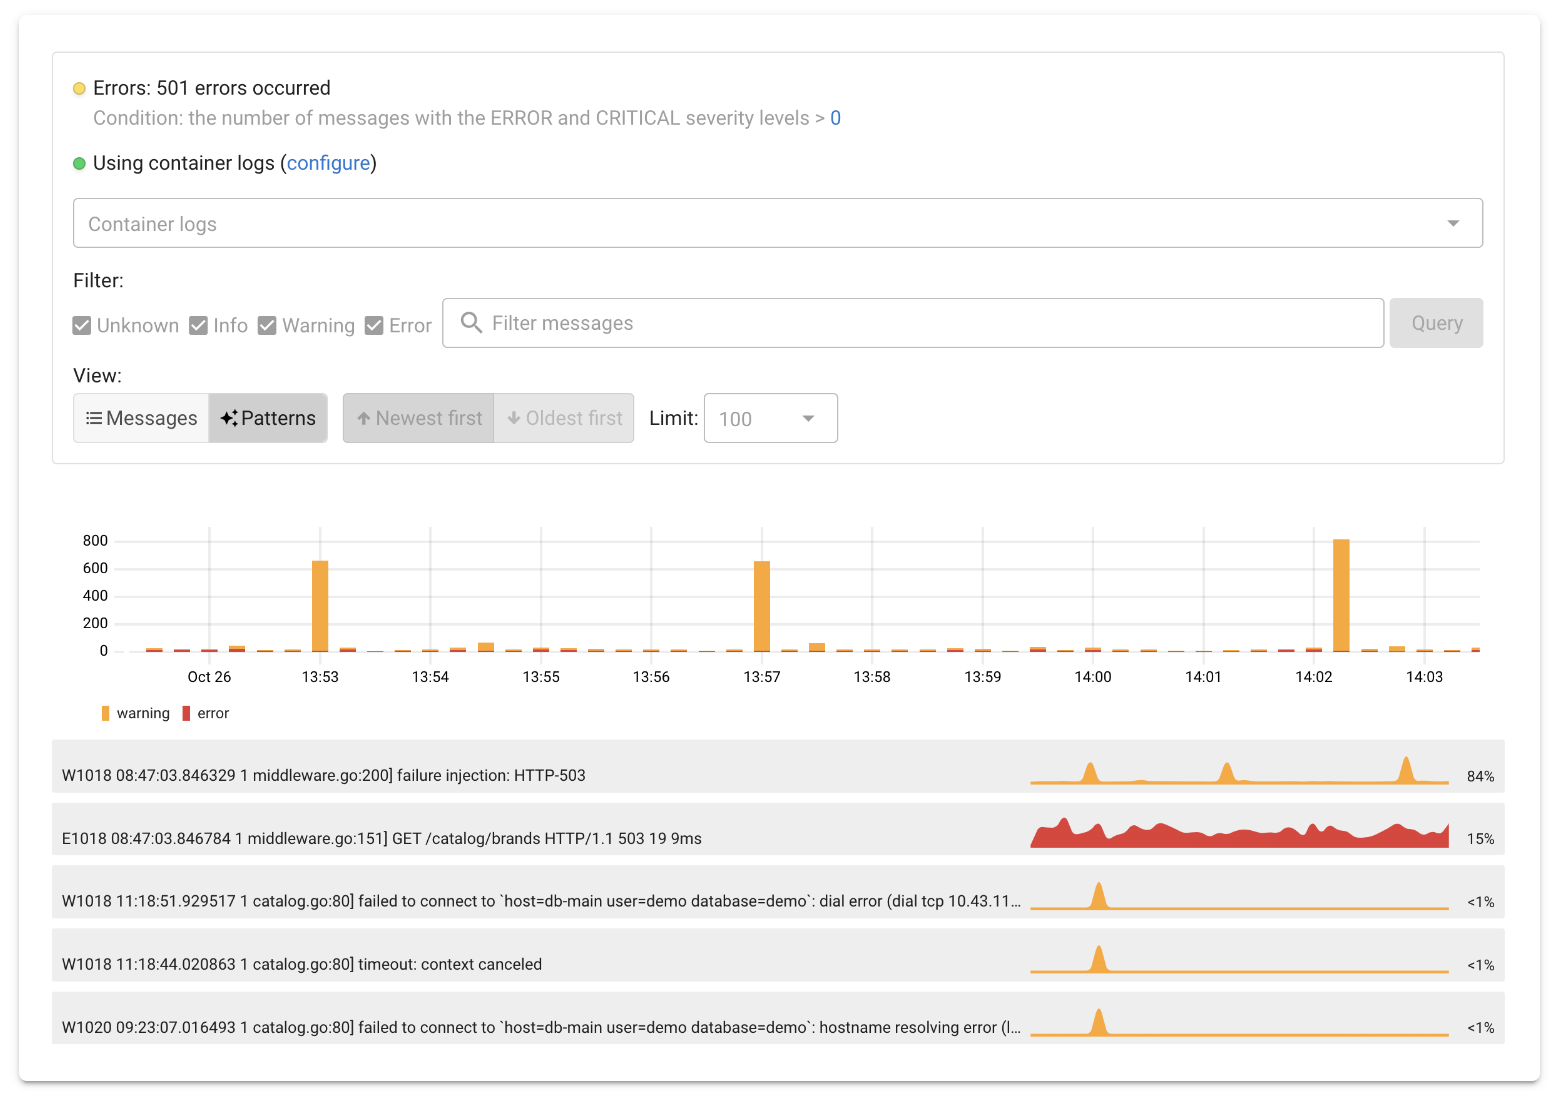
- Automatic log collection with pattern recognition, severity detection, and correlation with metrics and traces for contextual investigation.
- Kubernetes Integration
- Native support for EKS, AKS, GKE, and OpenShift with deployment tracking, Argo CD and Flux GitOps monitoring, and node-level resource visibility.