Helical Insight
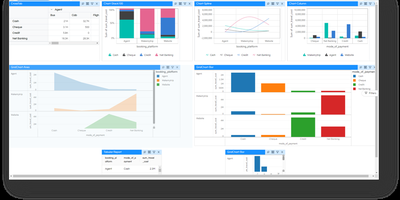
Finance closes the month with invoices that must print perfectly, analysts answer questions from a dashboard, and executives ask the data things in plain language: one platform handles all three jobs. Interactive dashboards support drill-down, drill-through, filters, KPI widgets, maps, and pivot tables, and scheduled delivery or report bursting pushes personalized copies to the people who need them. Pixel-perfect paginated reports cover statements, regulatory documents, and anything where layout is not negotiable. A chat interface generates SQL against connected sources, summarizes reports, and surfaces insights, running against a language model the organization itself chooses. Embedding puts dashboards, reports, and the chatbot inside customer portals and SaaS products, with white labeling swapping logos, themes, colors, and URLs for OEM delivery. Multi-tenancy isolates customers or departments on a single deployment. Row, column, and table level security follows the logged-in user, arriving through JWT, Okta, Keycloak, OAuth, or custom token single sign-on. Exports land in PDF, Excel, CSV, Word, HTML, JSON, and XML. Caching, pagination, virtualization, and clustering keep large deployments responsive, localization adapts the interface for regional teams, custom JavaScript visualizations extend the built-in charts, and REST APIs automate administration across the whole system. Running on a dedicated VPS on RepoCloud with guaranteed CPU, RAM, and SSD, full root SSH access, and a browser serial console. AGPL 3.0 licensed.
MikroDash
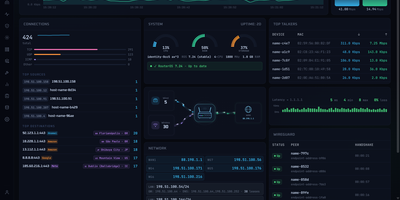
Watching a MikroTik RouterOS v7 router in real time is what MikroDash is for: live traffic, connections, Wi-Fi clients, DHCP leases, and WireGuard peers reach the browser the moment anything changes. Cards drag into any layout, and the arrangement follows your account to every browser. Managing a fleet happens on the Devices page, which shows routers as cards, a list, or a world map with 24-hour connectivity, last backup, open alerts, and pending updates. Rolling out a change starts in Config Management: choose one of 20 ready-made templates or capture your own, then deploy to one router or the fleet with a restore point, a canary router, and an automatic revert if a change cuts MikroDash off. Scheduled backups are kept only when something changed, with a diff and a guarded restore. New sites join through a generated script that calls home over a built-in WireGuard tunnel, even from behind NAT. Alerts reach SMTP, Telegram, ntfy, Discord, Slack, Gotify, Pushover, and Apprise. Troubleshooting stays in the browser with ping, traceroute, torch, bandwidth tests, a packet sniffer, and a RouterOS terminal. Read-only API access covers every page and alert, while roles, OpenID Connect sign-in, and an audit trail of every write govern shared use. Off by default, an optional assistant answers from live router data and asks before changing anything. Running on a dedicated VPS on RepoCloud with guaranteed CPU, RAM, and SSD, full root SSH access, and a browser serial console. MIT licensed.
Redash
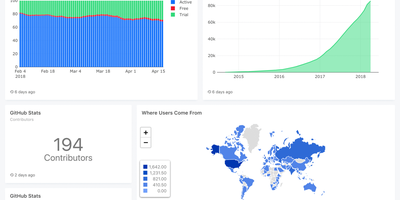
Used by millions of users at thousands of organizations worldwide and holding 29,000+ GitHub stars, Redash is the most established open-source SQL-first business intelligence tool — enabling anyone from analysts to executives to query databases, visualize results, and share dashboards without writing a single line of application code. The browser-based query editor supports SQL and NoSQL with schema browsing, auto-complete, query snippets, and parameterized queries that turn static reports into interactive data applications. Native connectors span 35+ data sources including PostgreSQL, MySQL, Amazon Redshift, Google BigQuery, Snowflake, ClickHouse, MongoDB, Elasticsearch, Databricks, Apache Presto, Microsoft SQL Server, and REST APIs — with an extensible data source API for custom integrations. Visualization types cover line, bar, area, pie, scatter, box plot, funnel, cohort, sankey, sunburst, choropleth map, and pivot tables, all draggable onto shared dashboards with cross-filtering parameters. Scheduled refreshes automatically update query results at configurable intervals, while threshold-based alerts notify teams via email, Slack, or webhook when metrics cross defined boundaries. SAML and Google OAuth SSO integration, role-based access control, API key management, and query-level permissions ensure enterprise-grade security for sensitive datasets. The self-hosted stack deploys via Docker Compose with PostgreSQL for metadata storage, Redis for job queuing, and Celery workers for background task execution. Running on a dedicated VPS on RepoCloud with guaranteed CPU, RAM, and SSD, full root SSH access, and a browser serial console. BSD 2-Clause licensed.
Statlite
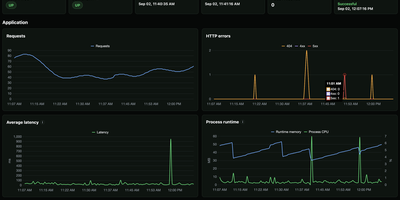
Small server, small monitoring. Statlite watches your applications and their host with a single binary that idles at about 15 MiB, so the observer never becomes the heaviest thing on the box. Point it at a Spring Boot Actuator endpoint and it polls health plus a fixed, curated set of Micrometer metrics: request traffic, latency, CPU, and runtime memory, all drawn as clean charts. Quarkus, Micronaut, and anything else that can answer a fixed JSON metrics profile can join the same dashboard. History lives in one local SQLite file, raw samples only, kept for 90 days by default, so yesterday's latency spike is still there when you go looking. The dashboard also watches the host itself: processor load, memory pressure, and filesystem capacity, including a warning before the metrics database fills its own disk. Restart detection tells you when an application bounced, and per-target Basic Auth support lets you poll protected Actuator endpoints safely. Configuration is one YAML file listing your targets and polling interval, friendly to systemd and Docker alike. Everything is deliberately scoped: no alert manager, no external service, no observability platform to operate. Just open the page and see whether your apps are healthy. Running on a dedicated VPS on RepoCloud with guaranteed CPU, RAM, and SSD, full root SSH access, and a browser serial console. MIT licensed.
Overlook
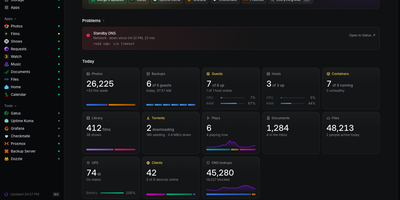
Overlook is a read-only status page that tells you at a glance whether your whole homelab is healthy, by pulling live answers from the monitoring, server, network, storage, and media tools you already run. The page leads with what is wrong, listing the checks your existing check engine is alerting on for as long as they fail, so the page and your alerts never disagree. Below that sit Servers, Network, Storage, and Apps, each marked up, degraded, or down with the last 30 results of its checks and its own detail page showing guests, DNS clients, or disk detail. A Today strip gives one figure from every source, such as guests running, DNS lookups, photos added, or the watts your UPS is drawing, while a weekly view lists each area's problems and events across the last seven days. Your apps appear as links with a dot that says whether each one answers, and chores due this week, waiting updates, batteries to change, and requests awaiting approval collect in one place you act on in the tool itself. A browser setup page appears before any config exists, tests each source you enter, and writes the config and secrets files for you. Running on a dedicated VPS on RepoCloud with guaranteed CPU, RAM, and SSD, full root SSH access, and a browser serial console. MIT licensed.
Tesserae
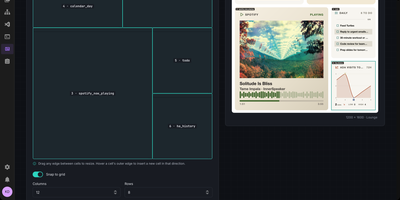
Built for e-ink screens, Tesserae composes calm wall dashboards from your calendar, weather, and Home Assistant data in a browser, then renders each frame at the panel's exact resolution. Lay out pages as a grid of cells or on a free canvas of widgets, text, and shapes, with a live preview. What you see is what paints. Dozens of bundled widgets cover weather, calendars, clocks, news, to-do lists, and photos, and a community catalog adds more widgets, themes, and templates. Frames are dithered to each panel's measured palette, so photos and gradients stay clean on Spectra 6 color, mono, and grayscale screens. One server drives a whole fleet. Each panel keeps its own dashboards, schedules, and rotations, and smart sync renders just before a battery panel wakes while quiet hours let it sleep overnight. Seeed reTerminal and XIAO panels flash from the browser, and Pimoroni Inky, Waveshare, M5Stack, TRMNL-compatible devices, and KOReader Kindles and Kobos work too. Inside Home Assistant it runs as a sidebar App. Home Assistant widgets show entities, history, energy, and cameras, and MQTT discovery turns each panel into a device with its frame, battery level, and signal. No account is needed, and update checks stay off unless you opt in. Ask Claude or any MCP client to lay out a dashboard, check a preview, and push it. Running on a dedicated VPS on RepoCloud with guaranteed CPU, RAM, and SSD, full root SSH access, and a browser serial console. AGPL-3.0 licensed.
metacubexd
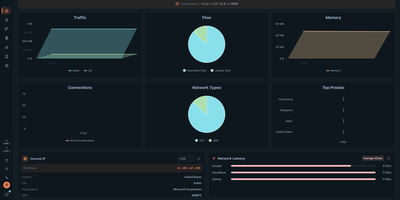
metacubexd gives your Mihomo proxy kernel a proper control room in the browser, from live traffic graphs to a full YAML profile editor. Real-time panels show upload and download speed, totals, active connections, memory use, and the busiest proxies, plus your current exit IP and latency to Google, Cloudflare, and GitHub. Proxy groups appear as cards with per-node latency bars, so switching a selector or running a latency test takes one click. Every connection is listed with its host, process, matched rule chain, and traffic, and can be closed or exported to CSV or JSON. Rules are searchable and filterable by type, and individual rules can be toggled on or off. Live logs stream by level, ready to search or download. With the all-in-one server image, you can also create profiles, import subscriptions by URL, edit configuration with schema-aware completion, validate it, and restart the kernel from the same page. Thirty-two themes, custom CSS, keyboard shortcuts, a responsive mobile layout, and seven interface languages make it comfortable to use anywhere. Running on a dedicated VPS on RepoCloud with guaranteed CPU, RAM, and SSD, full root SSH access, and a browser serial console. MIT licensed.
IRONSIGHT
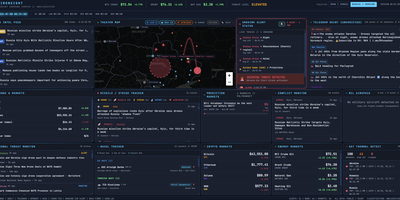
IRONSIGHT fuses over 50 publicly available intelligence sources into a single real-time dashboard that requires zero API keys and zero configuration. The Live Intel Feed aggregates 20+ RSS news sources with keyword relevance filtering from outlets including Reuters, Al Jazeera, and Kyiv Post. The Telegram OSINT module scrapes 27 channels every 60 seconds with automatic translation from Hebrew, Arabic, and Farsi. The interactive Leaflet Theater Map plots military aircraft positions via ADS-B transponder data, naval vessel locations in the Persian Gulf and Eastern Mediterranean, strike markers extracted from news and Telegram, missile trajectory arcs with range rings, and country-border overlays with a distance measurement tool. A header toggle switches the entire dashboard between Iran/Israel and Russia/Ukraine theaters, re-pointing every panel, map layer, and data feed to the selected conflict. The Israel Alert module streams live Pikud HaOref missile alerts with audio notifications, while the Conflict Monitor categorizes events into strikes, defense, diplomatic, and nuclear. Financial panels track defense contractor stocks, S&P 500, VIX, gold, Bitcoin, Ethereum, energy commodities via Yahoo Finance, and Polymarket prediction odds on conflict outcomes. NASA FIRMS satellite thermal detection flags fire and explosion signatures. The Next.js 16 App Router handles server-side data fetching for RSS and API endpoints while client-side React state management drives real-time polling updates. On RepoCloud, deploy IRONSIGHT on a dedicated VPS with persistent storage, root SSH access, and full control over your intelligence monitoring environment, all under the MIT license.
Homarr
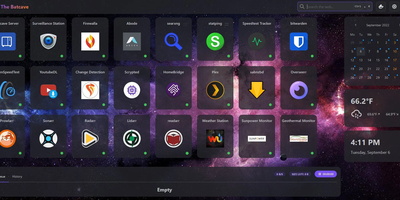
A single pane of glass for every service you run, arranged by drag-and-drop with no YAML or JSON files: Homarr is the modern dashboard for self-hosted infrastructure. Its grid system arranges apps, widgets, and bookmarks on desktop or touch, backed by an icon picker with over 11,000 icons. What separates Homarr from static launchers is 50+ live integrations: Plex, Jellyfin, and Emby media stats, the *arr suite (Sonarr, Radarr) with a unified release calendar, download clients, Pi-hole and AdGuard Home controls, Proxmox, Home Assistant, OPNsense, and Unifi monitoring. Widgets update in real time over WebSockets (tRPC and Redis under the hood), and a built-in search queries thousands of data points across connected services. Custom widgets extend the reach to any HTTP API without code: define endpoint, auth, and refresh interval in the management UI, then render responses as stat grids, tables, progress bars, status indicators, action buttons, or full custom JSX layouts - with an AI-prompt helper for generating templates. Multi-user support is first-class: credentials, OIDC, or LDAP sign-on, groups with granular permissions, and secrets encrypted with AES-256-CBC. A robust background-job system scales it from a Raspberry Pi homelab to deployments serving hundreds of users.
MeshMonitor
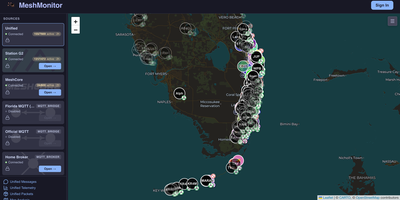
Off-grid radio networks are wonderful until you need to see all of them at once, and MeshMonitor puts every Meshtastic node, MeshCore companion, and MQTT broker on one shared dashboard. Each source keeps its own map, messages, telemetry, and traceroutes, and unified views merge them so a node heard by three radios appears once. Nodes plot on an interactive map with signal colors, clustering, topology overlays, and imported GeoJSON, KML, or KMZ zones. Channel chat supports replies, tapback reactions, and full-text search, and telemetry widgets chart battery, voltage, signal strength, and hop distribution over windows from 15 minutes to 7 days. Automation covers auto-responders, scheduled messages, auto-traceroute, and geofence triggers, with custom Node.js, Python, or shell scripts for anything else. A built-in MQTT broker and bridges filter traffic by topic, channel, or bounding box so a local mesh stays tidy. Security checks flag weak or duplicate encryption keys, and an audit log records every privileged action. Admins grant each person access to specific sources, using local accounts, OIDC sign-in, and MFA, and push alerts reach phones and chat apps through Apprise. Use it for a community mesh club, an emergency preparedness network, a fleet of solar-powered relays, or a neighborhood radio project. Running on a dedicated VPS on RepoCloud with guaranteed CPU, RAM, and SSD, full root SSH access, and a browser serial console. BSD-3-Clause licensed.
Relay Pulse
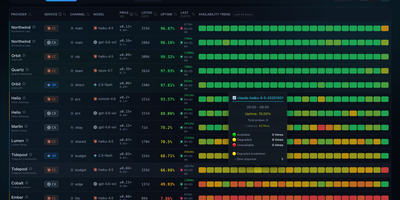
An API relay that answers HTTP 200 with an empty reply is not alive, and Relay Pulse exists to catch exactly that. Every minute, or any interval you set, it sends a tiny real request to each relay, asks a simple arithmetic question, and counts the probe as healthy only when the right answer comes back. Results land in a color-coded availability matrix where green, yellow, and red blocks show good, slow, and failed checks across the last 90 minutes, 24 hours, 7 days, or 30 days. Each row lists provider, service type, channel, model, price multiplier, days listed, uptime percentage, and the latest latency, and hovering a block reveals its probe counts and a breakdown of why it degraded. Filters narrow the table by category, provider, service, channel, vendor, or model, and the page switches between table and card views, four themes, and English or Chinese. Sponsor levels can pin trusted channels to the top, hot and cold boards separate active relays from dormant ones, and Telegram or QQ bots push status changes. Configuration reloads without a restart, templates cover Claude, Codex, and Gemini style endpoints, and a JSON API exposes current status. Running on a dedicated VPS on RepoCloud with guaranteed CPU, RAM, and SSD, full root SSH access, and a browser serial console. MIT licensed.
Perses
Dashboards stop being screenshots of someone's browser and start being code your team reviews. Perses is an open-source dashboard platform for observability data, displaying Prometheus metrics, Tempo traces, Loki logs, and Pyroscope profiles in one interface, with more datasources arriving through plugins. Teams build dashboards in the visual editor, organising panels into groups with variables that retarget every chart at a new job, instance, or environment; the same dashboards can be written with Go or Cue SDKs, validated in CI, and applied through the CLI or API, so a hundred services keep a hundred consistent dashboards under version control. Projects organise ownership, role-based access controls who can edit what, and authentication connects to the identity provider you already run. Because the dashboard model is an open specification, definitions stay portable instead of locked in one vendor's JSON dialect, and the panel libraries can even be embedded inside your own product's interface. A Kubernetes operator mode stores dashboards as custom resources inside application namespaces, so the team that owns a service owns its dashboard next to its deployment. Time ranges, refresh controls, and explore views make it as useful during an incident as it is as long-lived documentation of how a system behaves. Running on a dedicated VPS on RepoCloud with guaranteed CPU, RAM, and SSD, full root SSH access, and a browser serial console. Apache-2.0 licensed.
Homer
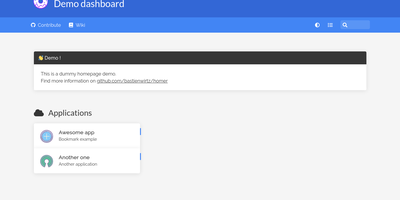
"Dead simple static HOMepage for your servER" - Homer's name is the spec. It is a fully static HTML/JS dashboard driven by one YAML file (assets/config.yml): list your services in groups with names, icons, tags, and URLs, and Homer renders a clean, fast landing page for everything you self-host. Because there is no backend, no database, and nothing to maintain, the container is tiny and effectively zero-maintenance - the entire operational surface is a text file you can version-control alongside your infrastructure. Despite the minimalism, the feature set is genuinely useful: smart cards add live data to service tiles via a type key - Pi-hole block statistics, AdGuard Home status, Jellyfin activity, Gatus and Home Assistant states, and dozens more integrations, with configurable periodic refresh. Fuzzy search jumps to any service as you type, keyboard shortcuts drive navigation, and multi-page support with item grouping keeps large homelabs organized. Theming covers built-in light and dark modes plus full custom CSS, tags get color-coded styles, and the whole dashboard installs as a PWA on phones and tablets. Icons come from Font Awesome or your own images. If Dashy is the maximalist dashboard and Homarr the drag-and-drop one, Homer is the minimalist: one YAML file, instant loads, and nothing that can break at 2 a.m.
Pipedash
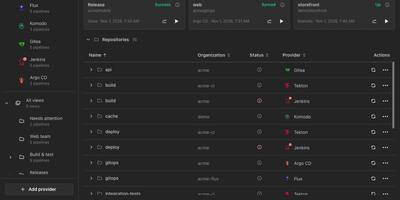
Pipedash unifies pipelines from twelve CI/CD providers into one self-hosted dashboard for watching statuses, reading job logs, and triggering, rerunning, or cancelling runs without opening each provider's site. Connect GitHub Actions, Gitea Actions, GitLab CI, Azure DevOps, Bitbucket, Buildkite, Jenkins, Tekton, ArgoCD, FluxCD, Komodo, or Prow, and every workflow lands in one list grouped by repository. Filters narrow by status, provider, organization, or time range, and saved views with rules, sub views, and pins give each team its own shortlist. Run history records each attempt with its commit, branch, actor, and duration, and opening a run reveals its jobs and a searchable log viewer that streams live output. Trigger forms load the workflow's own inputs, pipeline variables, or job parameters from the provider, so parameterized runs start with real values. Reruns reuse the original inputs, GitHub runs can restart only failed jobs, and stuck builds can be cancelled singly, in bulk, or by repository. Metrics charts track duration, success rate, and run counts per pipeline by hour, day, week, or month with P95 and P99 values. A notifications inbox gathers failures, degraded workloads, long running builds, and provider outages, while health panels place status pages beside the pipelines they describe. Every dashboard action is a REST API route under /api/v1 with bearer authentication, provider tokens stay encrypted at rest, and the server sends no telemetry. Running on a dedicated VPS on RepoCloud with guaranteed CPU, RAM, and SSD, full root SSH access, and a browser serial console. GPL-3.0 licensed.
Home Screens
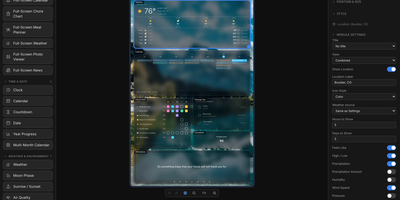
The family calendar is split across phones, the meal plan lives in someone's head, and the chore chart fell off the fridge: Home Screens turns a spare screen into a self-hosted family command center that puts calendars, weather, chores, meal plans, and photos on one shared display. You compose each screen in a drag and drop editor, placing any of 46 built in modules on a configurable canvas: clocks in 18 styles, weather in 14 views, calendars, to do lists, news, stock and crypto tickers, sports scores and standings for 15 leagues, traffic, air quality, and moon phases. Screens rotate through seven transitions, and a hub and spoke setup lets one server drive several physical displays, each with its own layout, dimensions, rotation, and scheduled profile. The phone remote wakes or sleeps displays, adjusts brightness, starts visual timers and morning routines, and runs the family organizer: chore charts with rewards, a meal planner with grocery list, shared to do lists, school timetables, and a notes board. Calendars arrive from Google, iCloud, or any iCal feed, weather from nine providers, and backgrounds from your uploads, Unsplash, NASA, Immich, Google Photos, iCloud, or OneDrive. Modules can appear or hide based on live conditions, plugins add new module types from a directory or a URL, and everything is stored locally with no cloud account. Running on a dedicated VPS on RepoCloud with guaranteed CPU, RAM, and SSD, full root SSH access, and a browser serial console. MIT licensed.
CashPilot
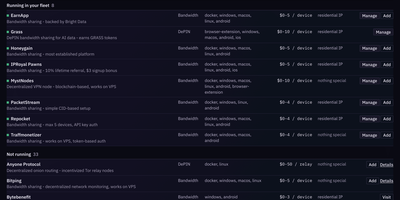
Idle bandwidth and spare hardware earn nothing sitting unused, so CashPilot deploys passive-income services across your servers and shows every balance in one web dashboard. From the catalog you start Docker earners such as Honeygain, Earn.fm, Traffmonetizer, PacketStream, ProxyRack, MystNodes, Storj, and Sia hostd with one click, no compose files to write, and you can add any service the catalog lacks by image name under the same container restrictions. Providers that run as browser extensions, desktop apps, or GPU nodes, 24 of them, are tracked alongside, while 15 built-in collectors read balances every hour into a single earnings history, so a service that runs without earning shows up as a flat line instead of a surprise. When a balance drops, CashPilot treats it as a probable payout and asks you to confirm rather than counting income by guesswork. One worker runs on each server under a single dashboard, with every figure broken down per server and per service. Extra copies of a service can earn through SOCKS5, HTTP CONNECT, or Tailscale exit-node proxies and stop dead if the proxy dies instead of leaking your real address. Earners are fenced off from your LAN, the host, your tailnet, and cloud metadata by default, and per-service guides flag restrictions such as providers that ban datacenter IPs. Running on a dedicated VPS on RepoCloud with guaranteed CPU, RAM, and SSD, full root SSH access, and a browser serial console. GPL-3.0 licensed.
Valet Homelab
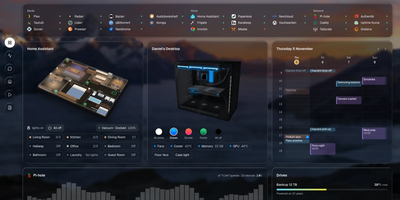
Open one page and see what is happening across every service in your homelab, then ask an AI assistant about downloads, lights, or what to watch tonight. Valet shows live status for 185 integrations, from Plex, Sonarr, and Immich to Home Assistant, Pi-hole, and Uptime Kuma, with progress bars and numbers that update without refreshing. Cards include a 3D floor plan with light controls, a PC with case and cooling controls, a calendar, backup health that flags overdue copies, and a year in review. The assistant works with a local or hosted model, switches models per chat, answers by voice, and supports slash commands, including your own. Anything it changes waits for your approval, and Valet works fine with the AI switched off. A wall mode at the /wall address turns a tablet or spare monitor into a read-from-across-the-room display with cards you pick, pages that take turns, and dimming at night. Add Valet to a phone Home Screen to install it as an app with its own notifications. API keys stay on the server, and there is no account and no telemetry. Running on a dedicated VPS on RepoCloud with guaranteed CPU, RAM, and SSD, full root SSH access, and a browser serial console. MIT licensed.
Homepage
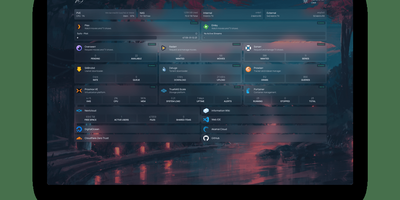
With over 31,000 GitHub stars and 430 contributors, Homepage has become the definitive self-hosted dashboard for homelab enthusiasts and server administrators who want a single, elegant landing page for all their services. The dashboard renders as a fully static site at build time for instant page loads, while a Node.js backend securely proxies all API requests to prevent exposing service credentials to the browser. Docker integration automatically discovers running containers through label-based configuration, populating the dashboard with service status indicators, health checks, and real-time statistics without manual URL entry. Over 100 native service widgets display live data from popular applications including Plex, Jellyfin, Radarr, Sonarr, Home Assistant, Pi-hole, Portainer, Proxmox, Nextcloud, Gitea, and dozens more, each showing relevant metrics like active streams, download queues, or system health directly on the dashboard. Information widgets provide weather forecasts, system resource utilization, search bars, and date/time displays. The layout system supports multiple columns, tabs, and custom CSS for pixel-perfect arrangement of service groups and bookmarks. Built-in authentication options include OIDC integration and password protection. Quick search functionality enables instant access to bookmarks and services with keyboard shortcuts. Internationalization covers 40+ languages with community-maintained translations. Configuration lives entirely in YAML files for version-controlled, reproducible dashboard setups. Deploy on a dedicated VPS on RepoCloud with guaranteed CPU, RAM, and SSD, full root SSH access, and a browser serial console for complete control. GPL-3.0 licensed with an active community and bi-weekly releases.