Komari
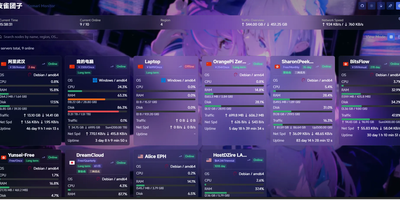
Komari turns a scattered fleet of VPS boxes into one clean status wall that shows which servers are alive, struggling, or about to expire. Every node reports CPU, GPU, memory, swap, disk, load, network speed, traffic totals, and uptime to a real-time dashboard, with history views from ten minutes to thirty days or any custom range. Flip between a card grid and a table, search by name, region, or operating system, and tag each machine with its price, billing cycle, and days until renewal. Latency tasks send ICMP, TCP, or HTTP probes and plot the results in per-node charts. Offline alerts wait out a per-node grace period before firing, expiry reminders warn before a plan lapses, and Webhook and custom JavaScript channels deliver them. A multi-tab browser terminal that reattaches after disconnects, remote command execution, and a remote file manager with an editor let you fix problems without leaving the panel. Agents install with a script, a binary, Docker, or an auto-discovery key for batch rollouts, and administrators can switch an agent's version remotely. Plugins run on an embedded JavaScript runtime and can add scheduled jobs, HTTP hooks, static pages, and notification channels. Administrators can add two-factor authentication, OAuth sign-in, API keys for a JSON-RPC 2.0 endpoint, themes from a theme market, and backups. Running on a dedicated VPS on RepoCloud with guaranteed CPU, RAM, and SSD, full root SSH access, and a browser serial console. MIT licensed.
Tick Stock Panel
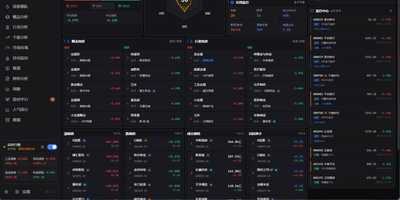
Screen equities against dozens of technical indicators, backtest algorithmic trading strategies, and spot intraday market anomalies using Tick Stock Panel, a self-hosted quantitative analysis workbench. Traders can filter entire exchanges across technical indicators including moving averages, relative strength index, and Bollinger bands with near-instantaneous execution. The platform provides a full backtesting environment where users test customized entry and exit rules, account for simulated slippage and commission fees, and review streamed performance metrics. Dedicated monitoring modules track intraday volume spikes, price breakouts, and multi-day limit streaks with automated alert dispatching to messaging channels and voice announcements. Users can explore individual stock profiles featuring multi-dimensional technical breakdowns, financial balance sheets, and automated event post-mortems generated via integrated language models. Visual factor mining tools allow analysts to discover uncorrelated signals and assemble composite portfolio screens without external database overhead. An interactive dashboard aggregates sector rotations, hot concept heatmaps, and customizable watchlists into modular operational views. Running on a dedicated VPS on RepoCloud with guaranteed CPU, RAM, and SSD, full root SSH access, and a browser serial console. MIT licensed.
Neko Master
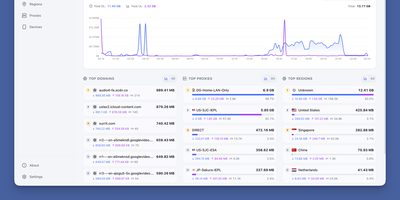
Neko Master watches every connection flowing through your Clash, Mihomo, or Surge gateway and turns the stream into a live map of devices, domains, countries, and proxy nodes, so questions that once needed packet captures get answered at a glance. The dashboard refreshes over WebSocket as traffic moves, charting upload and download trends across thirty minutes, one hour, or a full day. Domain views rank every host your network contacts by traffic and connection count, and IP views add ASN and geographic detail, so an unfamiliar endpoint explains itself instead of raising an alarm. Proxy statistics break traffic down per node and per rule, which makes a saturated exit, a misrouted application, or an underused subscription obvious in seconds. One panel watches several gateways at once: add OpenClash backends directly, or install the one-command agent on OpenWrt, Linux, or macOS machines beside remote gateways and let each agent report home. Because agents open the connection outward, gateways behind NAT still report in, and the panel never reaches into your network uninvited. History persists in SQLite by default, and busy networks can dual-write traffic statistics to ClickHouse for larger histories while configuration stays in SQLite. Token-based access control protects the dashboard, dark mode and an installable PWA keep it comfortable on a phone, and the interface switches between English and Chinese. Running on a dedicated VPS on RepoCloud with guaranteed CPU, RAM, and SSD, full root SSH access, and a browser serial console. MIT licensed.
GoAccess
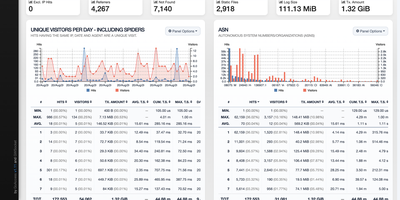
GoAccess processes millions of web log entries in seconds and renders the results as interactive dashboards that update every 200 milliseconds in the terminal or every second via WebSocket-connected HTML reports. Written entirely in C with only ncurses as a dependency, it achieves exceptional performance even on resource-constrained servers, reducing memory usage by approximately 20% and parsing time by 35% in recent releases through optimized in-memory hash tables with on-disk persistence support. The analyzer parses virtually every web log format out of the box (Apache Combined and Common, Nginx, Amazon CloudFront, Amazon S3, AWS Elastic Load Balancing, Google Cloud Storage, Squid, W3C IIS, Caddy JSON, and Traefik) while supporting fully custom log format strings for non-standard configurations. The self-contained HTML dashboard displays 15+ interactive panels covering unique visitors, requested files, static files, 404 errors, referring sites, search keyphrases, geographic location with city-level GeoIP resolution, operating systems, browsers, HTTP status codes, time distribution, and virtual host metrics. WebSocket authentication via JWT provides secure remote access, and incremental log processing ensures data continuity across daemon restarts. Docker deployment requires a single command with volume-mapped access logs. Over 20,800 stars with active development since 2010. Running on a dedicated VPS on RepoCloud with guaranteed CPU, RAM, and SSD, full root SSH access, and a browser serial console. MIT licensed.
TapMap
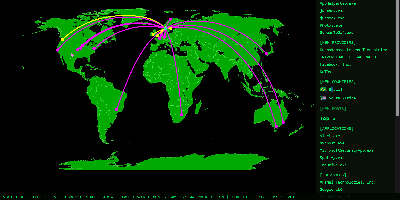
TapMap draws a computer's live network connections on an interactive world map, so you can watch which applications are talking to which services, where those services sit, and what normal looks like for that machine. A local pipeline scans active sockets, extracts the remote addresses, and enriches them with geolocation from databases stored on the machine itself. Every connection carries the owning application or process, its network operator, and the operating system's verification status for that app, and places that share a location are highlighted when connections overlap. The same view lists local open ports, both TCP listeners and bound UDP sockets, established services on your LAN, and public services whose location could not be mapped. A rolling 30-day history turns raw connections into awareness: an Insights panel surfaces new applications, providers, countries, and ports, plus the most frequent activity, while a Significant Connections log records first sightings and failed verifications. A Daily Activity Report goes further, sorting applications into seen-once, occasional, recurring, and stable patterns, analyzing provider concentration, and charting country activity with detailed timelines. New significant connections can raise a desktop notification or publish to an MQTT broker you configure. Nothing is sent anywhere by default: processing happens locally, with no telemetry. Running on a dedicated VPS on RepoCloud with guaranteed CPU, RAM, and SSD, full root SSH access, and a browser serial console. MIT licensed.
Zeabur
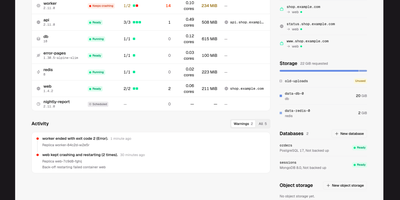
Zeabur is a self-hosted web platform that deploys and runs your services on your own Kubernetes cluster, presenting the cluster as simple projects and services instead of raw manifests. Every change starts as a readable plan listing the exact fields it will write and who owns them today, and nothing is applied until you confirm it. When something breaks, Zeabur says so in plain words and points at the fix: a worker that restarted fourteen times gets a button straight to the logs from the run before the restart. You deploy from Git repositories, from an uploaded folder or ZIP archive, or directly in the dashboard, then follow live logs, open a terminal inside a container, and watch CPU and memory move over time. Projects are namespaces and all state lives in Kubernetes objects, so there is no Zeabur database to back up, and uninstalling the platform leaves your Deployments, Services, and Ingresses running untouched. Companion pieces add passkey sign-in for kubectl with tokens that expire in minutes, image builds from Git through a BuildKit operator, and a catalog of cluster components and app templates. Running on a dedicated VPS on RepoCloud with guaranteed CPU, RAM, and SSD, full root SSH access, and a browser serial console. Apache-2.0 licensed.
Dashy
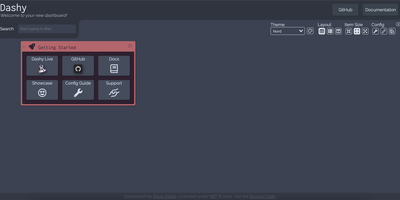
Every service you run, behind one polished start page: Dashy is the most customizable homelab dashboard, built as a Vue.js homepage. Configuration lives in a single YAML file, but you never have to hand-edit it: an integrated UI editor with real-time validation writes changes back to disk, so both config-as-code and point-and-click camps are served. Status indicators put a live health dot next to every app - HTTP checks or pings on custom intervals, with response time and status details on hover - giving you an at-a-glance uptime overview before anything breaks. Over 50 built-in widgets pull dynamic content from the services you already run: Pi-hole and AdGuard block stats, Proxmox lists, Nextcloud status, Netdata CPU/memory history, Prometheus data, plus weather, RSS, crypto prices, and generic iframe/API-response widgets for anything with an endpoint. Instant fuzzy search launches any app as you type, with customizable hotkeys and web-search fallthrough. Theming is deep: dozens of built-in themes, a UI color palette editor, and custom CSS over CSS variables. Alternate views include a fast-loading minimal startpage and a workspace view that embeds apps side-by-side without leaving the dashboard. Icons resolve from Font Awesome, homelab icon packs, emojis, or auto-fetched favicons. Built-in authentication, multi-page support, cloud backup/sync, and multi-language round out an MIT project with a massive community.
Daily Stock Analysis
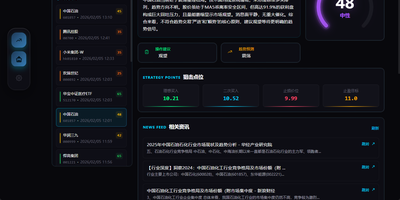
Daily Stock Analysis reads your watchlist every trading day and hands back a decision dashboard, with a score, a trend call, entry and exit levels, risk alerts, and catalysts for each stock. Quotes, K-lines, technical indicators, announcements, news, and fundamentals from several data sources feed a report written by the language model you connect, including Gemini, Claude, OpenAI-compatible endpoints, DeepSeek, or a local Ollama model. The web workspace covers manual analysis, task progress, history, full Markdown reports, backtesting, portfolio tracking, settings, and light and dark themes. Strategy chat answers follow-up questions in multiple turns using 15 built-in strategies, from moving-average crossover to Chan theory and wave theory. Smart import reads a screenshot, CSV, Excel file, or clipboard text to build the watchlist, with code, name, pinyin, and alias autocomplete. Reports are delivered to WeChat Work, Feishu, Telegram, Discord, Slack, or email on a schedule that skips market holidays. A market review summarizes index moves, breadth, and leading sectors. ETF rotation backtests compare annual results and flag data quality problems. Running on a dedicated VPS on RepoCloud with guaranteed CPU, RAM, and SSD, full root SSH access, and a browser serial console. MIT licensed.
Grafana
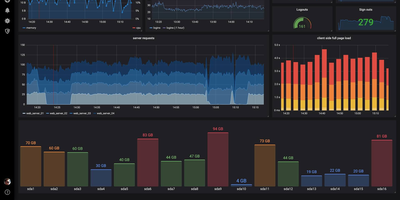
The de facto dashboard of observability: Grafana is the open-source frontend that turns the data stores you already run into interactive graphs. It does not store metrics itself; it connects to the data stores you already run and turns their contents into interactive dashboards. Supported sources number over 150 via plugins: Prometheus, Loki, Tempo, InfluxDB, Elasticsearch, MySQL, PostgreSQL, Microsoft SQL Server, AWS CloudWatch, Azure Monitor, Google Cloud Monitoring, and many more. Dashboards are built from a large library of panel types (time series, heatmaps, tables, gauges, logs) with template variables for reusable, parameterized views. Unified alerting evaluates rules against any connected data source, not just Prometheus, and routes notifications to Slack, PagerDuty, email, and other channels with grouping and silencing - unlike Prometheus Alertmanager, a single rule can combine a Loki log pattern, a PostgreSQL query result, and a CloudWatch metric. Dashboards serialize to JSON and data sources configure via provisioning files, so the entire observability setup can live in Git and deploy repeatably across environments. Explore mode adds ad-hoc querying outside dashboards, with split view for correlating a metric spike against the matching log lines, and access control spans organizations, teams, folder permissions, and OAuth, LDAP, and SAML integration. Written in Go and TypeScript, AGPL-licensed. Self-hosting gives you unlimited users, dashboards, and queries at flat hosting cost, without Grafana Cloud's usage-based pricing.
LightDash
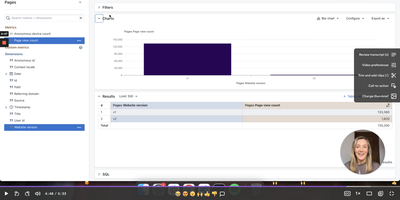
With 5,600+ GitHub stars and deep dbt integration, Lightdash is the open-source Agentic BI platform that treats analytics like software — defining metrics, dimensions, joins, permissions, and caching in a governed context layer that powers dashboards, AI agents, data apps, embedded analytics, and MCP server endpoints simultaneously. The dbt Write-Back feature lets business users create custom metrics and models in the UI, then automatically generates pull requests in GitHub or GitLab so every change flows through code review and CI validation before reaching production. Context-specific AI analysts automatically select relevant models and metrics, build queries, and present insights in plain English, while row-level security, user attributes, and customer-facing permissions ensure data governance at every layer. The platform connects to BigQuery, Snowflake, Redshift, Databricks, PostgreSQL, Trino, and ClickHouse through warehouse adapters, with the TypeScript monorepo built on React, Mantine, Vite, and TanStack Query on the frontend plus Node.js, Express, Knex, and PostgreSQL on the backend. Data teams build analytics with coding agents, preview changes from the CLI, validate in CI pipelines, and review charts and dashboards in pull requests — making the entire analytics lifecycle version-controlled and reproducible. Running on a dedicated VPS on RepoCloud with guaranteed CPU, RAM, and SSD, full root SSH access, and a browser serial console. MIT licensed.
NetPulse
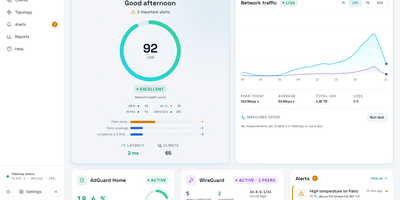
NetPulse is a self-hosted dashboard that turns a pile of routers, switches, and clients into one live picture of how your network is doing. A single score from 0 to 100 condenses latency, loss, uptime, and temperature, and updates every few seconds. The topology map draws itself from bridge and LLDP data, placing wired and wireless clients under the router and port they actually use. Every device is classified by type, with signal strength, band, and first-seen time. Router cards show model, firmware, CPU, memory, temperature, and live traffic. Scheduled WAN speed tests compare results against your contracted plan, and panels for WireGuard peers and AdGuard Home keep VPN and DNS activity in view. Alerts for overheating, new devices, firmware updates, and WAN outages reach you through push notifications, ntfy, Telegram, or webhooks. Admin and viewer accounts share access, a Wi-Fi channel analyzer scores congestion, and OpenWrt firmware upgrades can be started from the browser. MQTT publishing feeds Home Assistant, and an optional read-only MCP endpoint answers questions from your AI assistant. The interface installs as a phone app and speaks English and Spanish. Running on a dedicated VPS on RepoCloud with guaranteed CPU, RAM, and SSD, full root SSH access, and a browser serial console. AGPL-3.0 licensed.
Slurm-web
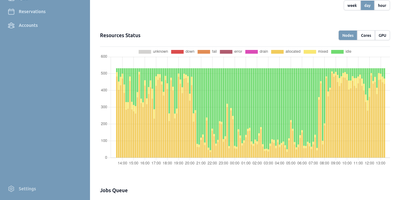
Slurm-web gives HPC cluster operators and users a browser dashboard for watching jobs, nodes, and GPUs across a Slurm cluster instead of living in squeue output. The overview page charts resource and job status with interactive graphs, so a glance tells you whether the machine is busy, idle, or quietly failing. The jobs view filters and sorts instantly, updates live as jobs change state, and uses colored badges so pending, running, and failed work sorts itself out visually at any scale. Node views go deeper: advanced visualizations show node status across racking topology, GPU utilization is tracked alongside CPU resources, and problems surface as highlighted issues rather than a line in a log file. Account trees, quality-of-service settings, and advanced reservations get intuitive graphical views that make fair-share politics legible to everyone involved. Prometheus integration collects and charts timeseries metrics for longer-term capacity questions. Access is enterprise-ready: LDAP and Active Directory authentication, OpenID Connect single sign-on through providers like Keycloak or Authentik, and granular role-based permissions decide who sees which clusters. Several clusters can be monitored from one deployment, the interface supports dark mode and custom branding with your own colors and logos, caching keeps the UI responsive against busy controllers, and integrated help explains each view in place. Running on a dedicated VPS on RepoCloud with guaranteed CPU, RAM, and SSD, full root SSH access, and a browser serial console. MIT licensed.
Frappe Insights
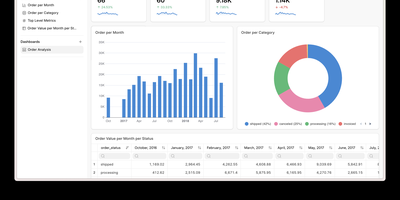
Frappe Insights delivers a self-hosted business intelligence platform where non-technical users build complex analytical queries without writing SQL. The visual query builder uses Ibis under the hood to compose optimized SQL from drag-and-drop column selections, filters, aggregations, and group-by operations — translating point-and-click interactions into performant database queries across MySQL, PostgreSQL, DuckDB, and BigQuery. The join editor provides a graphical interface for defining multi-table relationships, letting analysts connect data across schemas without understanding foreign keys or join types. The chart builder renders interactive visualizations using Apache eCharts with support for bar, line, area, pie, scatter, funnel, and pivot table chart types — each configurable with axes, colors, legends, and formatting options. Dashboards combine multiple charts into shareable views with layout customization, auto-refresh intervals, and filter propagation across widgets. Data source management handles connection pooling across multiple databases simultaneously, enabling cross-database analysis in single queries. Server scripts extend query capabilities with custom Python transformations for complex business logic that visual tools cannot express. Built on the Frappe Framework's full-stack architecture, deployment uses Docker via the official easy-install script that provisions the complete stack including MariaDB, Redis, and Nginx. Running on a dedicated VPS on RepoCloud with guaranteed CPU, RAM, and SSD, full root SSH access, and a browser serial console. AGPL-3.0 licensed.
Apache Superset
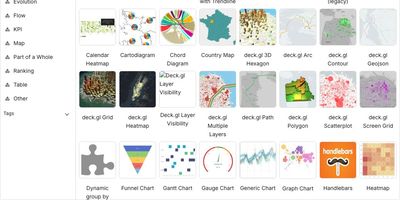
Powering data analytics at companies like Airbnb, Twitter, and Lyft where it originated, Apache Superset has become the leading open-source business intelligence platform with over 65,000 GitHub stars and an Apache Software Foundation top-level project designation. The platform ships with over forty visualization types out of the box including geographic maps, time-series charts, pivot tables, heatmaps, treemaps, and Sankey diagrams, all rendered with Apache ECharts for publication-quality output. Its SQL Lab provides a full-featured IDE experience with syntax highlighting, autocomplete, query history, and result caching for interactive data exploration. Superset connects natively to PostgreSQL, MySQL, ClickHouse, Trino, Presto, BigQuery, Snowflake, Apache Druid, Apache Hive, and dozens more databases through SQLAlchemy connectors, with support for custom database drivers via Python plugins. The semantic layer allows data teams to define calculated columns, metrics, and virtual datasets that business users can query without writing SQL. Role-based access control with row-level security enables fine-grained data governance, while the embedded analytics SDK lets you integrate dashboards directly into external applications via iframes with SSO pass-through. The caching layer supports Redis and Memcached for query result caching, and the asynchronous query execution engine powered by Celery handles long-running queries without blocking the UI. Alerts and reports can be scheduled via email or Slack with PNG or CSV attachments generated from any chart or dashboard. Running on a dedicated VPS on RepoCloud with guaranteed CPU, RAM, and SSD, full root SSH access, and a browser serial console. Apache 2.0 licensed.
CPA Usage Keeper
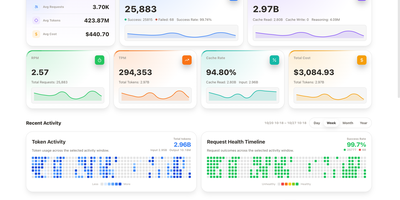
Somewhere between the third coding agent and the fifth model subscription, nobody can say where the tokens went. CPA Usage Keeper keeps the receipts for a CLIProxyAPI gateway, saving every request locally with scheduled backups so history survives restarts. The Overview page shows requests, success rate, tokens, cache hit rate, and estimated cost with sparklines and a calendar heatmap, and Realtime plots time to first token against total latency and shows rolling cache levels and model speed. Analysis breaks usage down by API key, model, credential, or provider with donut charts and ranked lists. The Request Events log filters by model, source, and status, adjusts its columns, and exports records. Credentials cards show success rates, remaining five-hour and weekly quotas, priorities, and enable switches, and quota history charts how many tokens and dollars each percentage point costs over a cycle. Individual API keys can be given a read-only usage view. Deployment uses a Docker Compose file that bundles CPA with Keeper or runs Keeper beside an existing gateway, and the interface switches between English and Chinese and between light and dark themes. Check the dashboard before the invoice arrives and see exactly who spent what. Running on a dedicated VPS on RepoCloud with guaranteed CPU, RAM, and SSD, full root SSH access, and a browser serial console. MIT licensed.
portracker
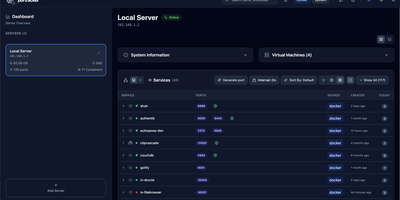
No spreadsheet has to track which service owns which port, because portracker discovers every service and port on your servers and keeps the list current from a self-hosted dashboard. Begin with a single port, shown with its owning service, its source (Docker or the host system), and its address, with internal container ports told apart from ports published to the host. Step back and ports gather into services: expandable cards carrying an icon, a health dot, and a port count, in list, grid, or table layouts, where a Why this status popover names the failing component and the rule that fired. Step back again and each server gets its own panel with hostname, OS, CPU, memory, and uptime, plus TrueNAS apps, VMs, and LXC containers once an API key is added. Step back once more and the whole fleet appears, because other portracker instances can be linked as peers, a VM's instance can be nested under its host, and every server can be searched at once. Along the way, rename services, hide the noisy ones, attach notes, act on a selection in bulk, or press Generate port for an unused number before deploying something new. Optional sign-in with a first-run setup wizard, an autoxpose link that shows public URLs and SSL status, light and dark themes, and keyboard shortcuts finish the picture. Running on a dedicated VPS on RepoCloud with guaranteed CPU, RAM, and SSD, full root SSH access, and a browser serial console. MIT licensed.
Dreeve
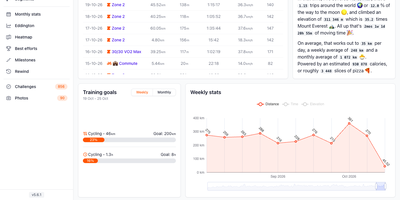
Every ride, run, hike, and swim you have ever recorded finds a home in Dreeve, a private fitness dashboard that lives on your own server rather than in a social feed. Import FIT, TCX, or GPX files from a watch folder, sync Strava, or add connectors for Garmin Connect, Wahoo, Polar Flow, Hammerhead, and Zepp/Amazfit. Weekly charts follow distance, time, and elevation beside training goals, heart rate zones, and training load analysis, and monthly stats pair per-sport totals with an interactive calendar. A heatmap paints every kilometer you have covered. Best efforts rank your fastest 5k, 10k, 50k, and 100k across every sport, while Eddington numbers, a milestones timeline, and a yearly Rewind mark the long game. Strava sync also brings segments, segment efforts, and challenges. Gear pages total the distance on each bike and shoe, and maintenance tasks send alerts through ntfy, Gotify, Discord, Telegram, Slack, or email when an interval comes due. Automation rules assign gear, flag commutes, and set sport types by device, distance, weekday, time of day, or location, so new imports arrive organized. Ask the AI workout assistant about your training, using cloud models, OpenRouter, or a local Ollama model. An installable mobile app and embeddable badges carry your stats to phones and blogs, and a password-protected admin panel keeps the settings. Running on a dedicated VPS on RepoCloud with guaranteed CPU, RAM, and SSD, full root SSH access, and a browser serial console. AGPL-3.0 licensed.
Headroom
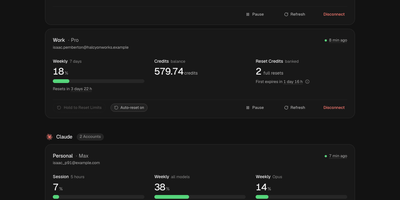
Headroom answers the question every multi-plan AI subscriber asks mid-task: which of my accounts still has room to work? It puts the live limits, reset times, credits, and spend of Claude, Codex, Cursor, Copilot, Grok, Antigravity, and Vercel AI Gateway accounts on one self-hosted dashboard instead of seven provider pages. Connect each account once, through its official CLI sign-in or a credential import, and a background scheduler refreshes every figure on schedule, renews tokens before they expire, and keeps 90 days of readings. Five-hour sessions, weekly pools, per-model limits, credit balances, banked resets, and on-demand spend sit side by side, and unreported figures show as unknown rather than a fake zero. Compare ranks same-provider accounts by the room they have left and names the one to use next, while Timeline lays every reset window on a two-week calendar. Analytics charts when you work, when you run dry, and whether each plan fits, and Wallet totals subscriptions, usage spend, and top-ups in one currency with renewals and budget alerts. In-app notices, Telegram messages, and signed webhooks warn about low limits, expiring resets, and broken sign-ins, and optional automations can spend a banked Codex reset or log a credit top-up the moment it lands. Personal, work, and side-project accounts stay separate under one owner login with passkeys and a Privacy Mode that blurs emails on screen. Running on a dedicated VPS on RepoCloud with guaranteed CPU, RAM, and SSD, full root SSH access, and a browser serial console. MIT licensed.