Stars
Forks
Watchers
Developer links
Frappe Insights
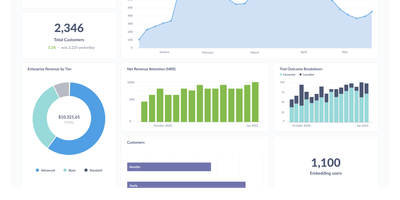
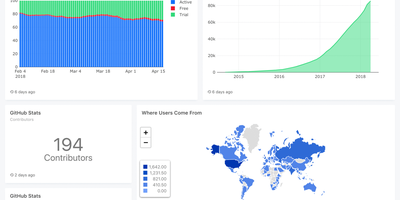
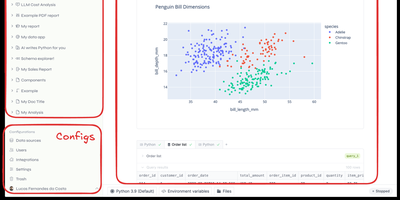
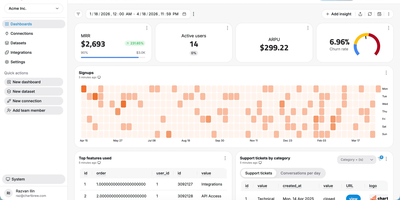
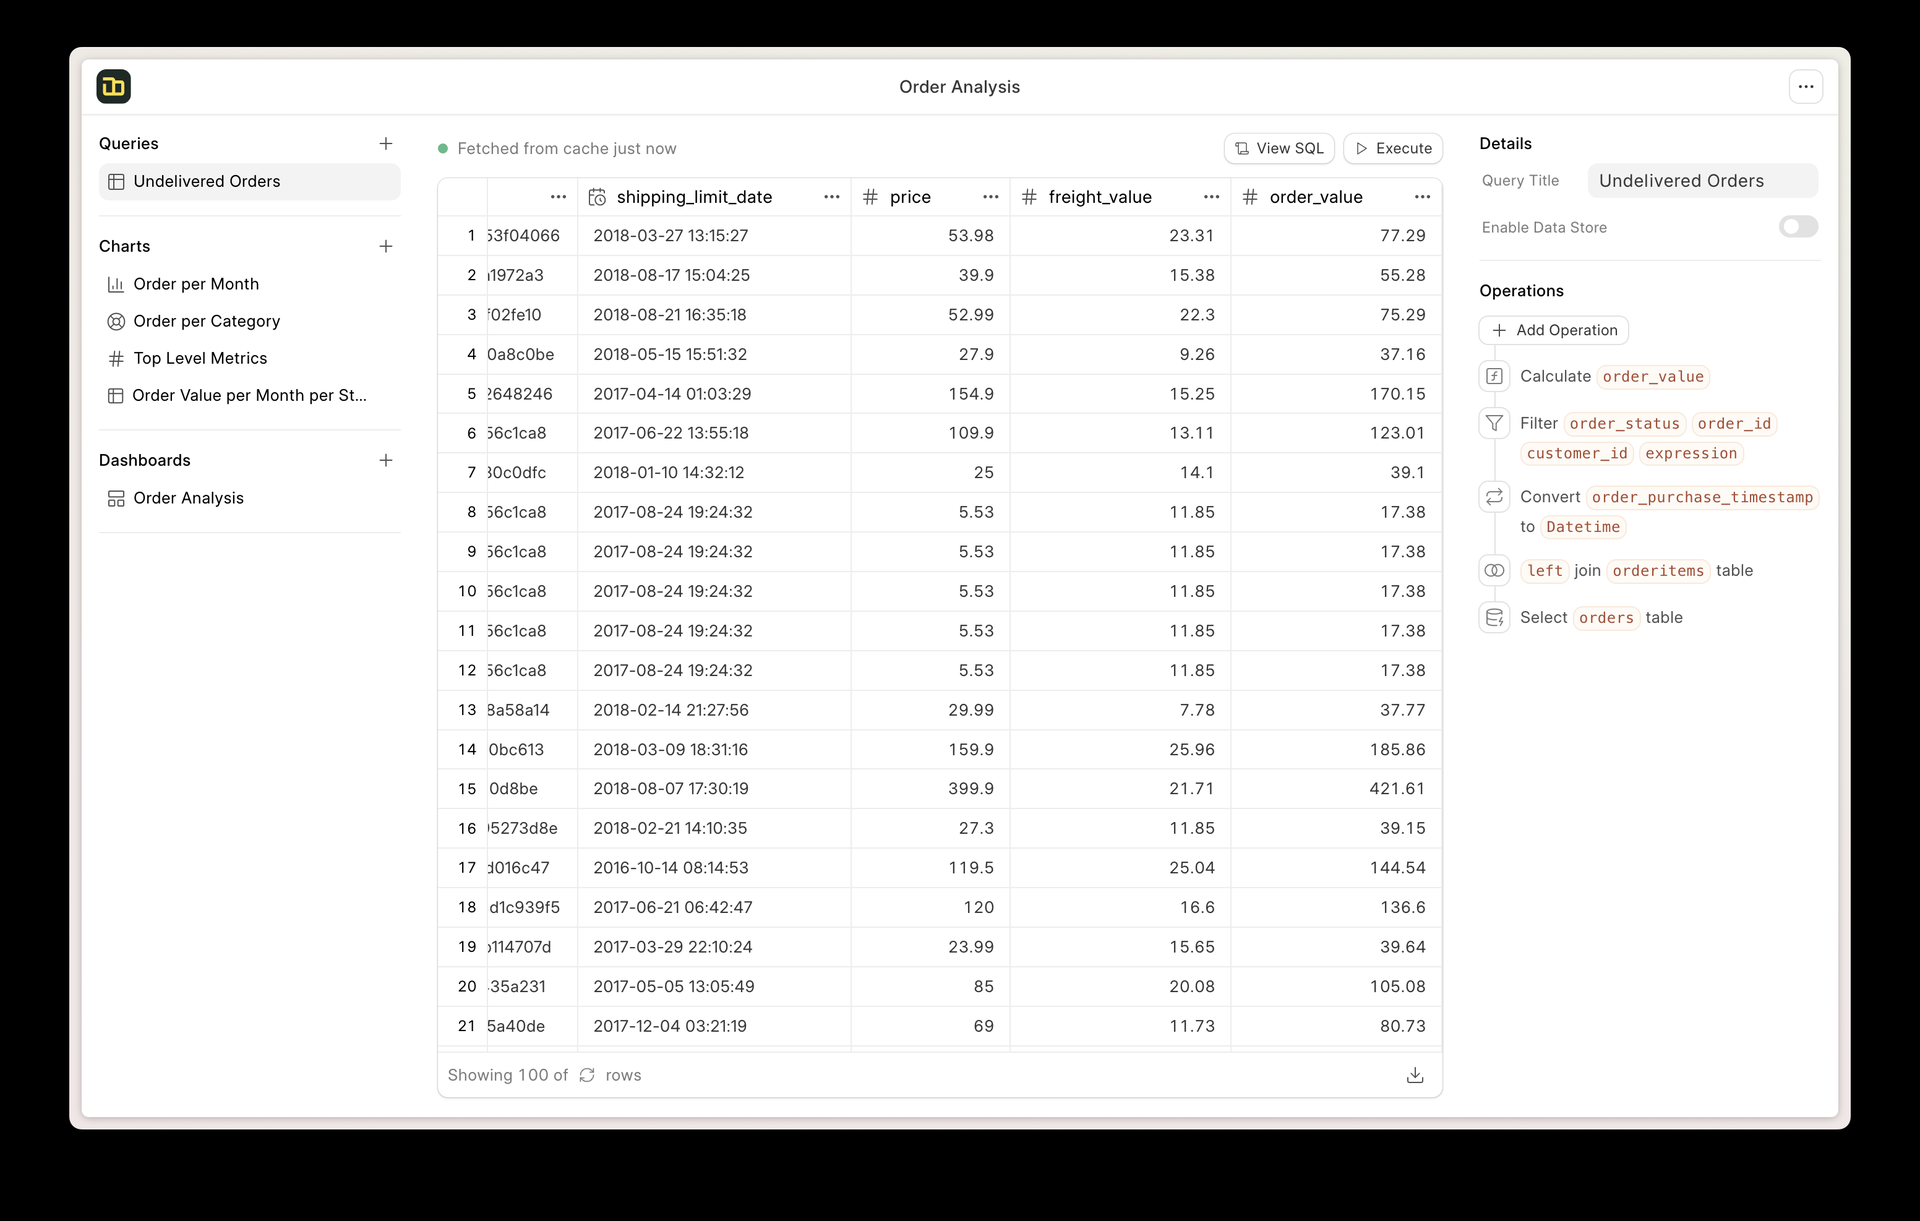
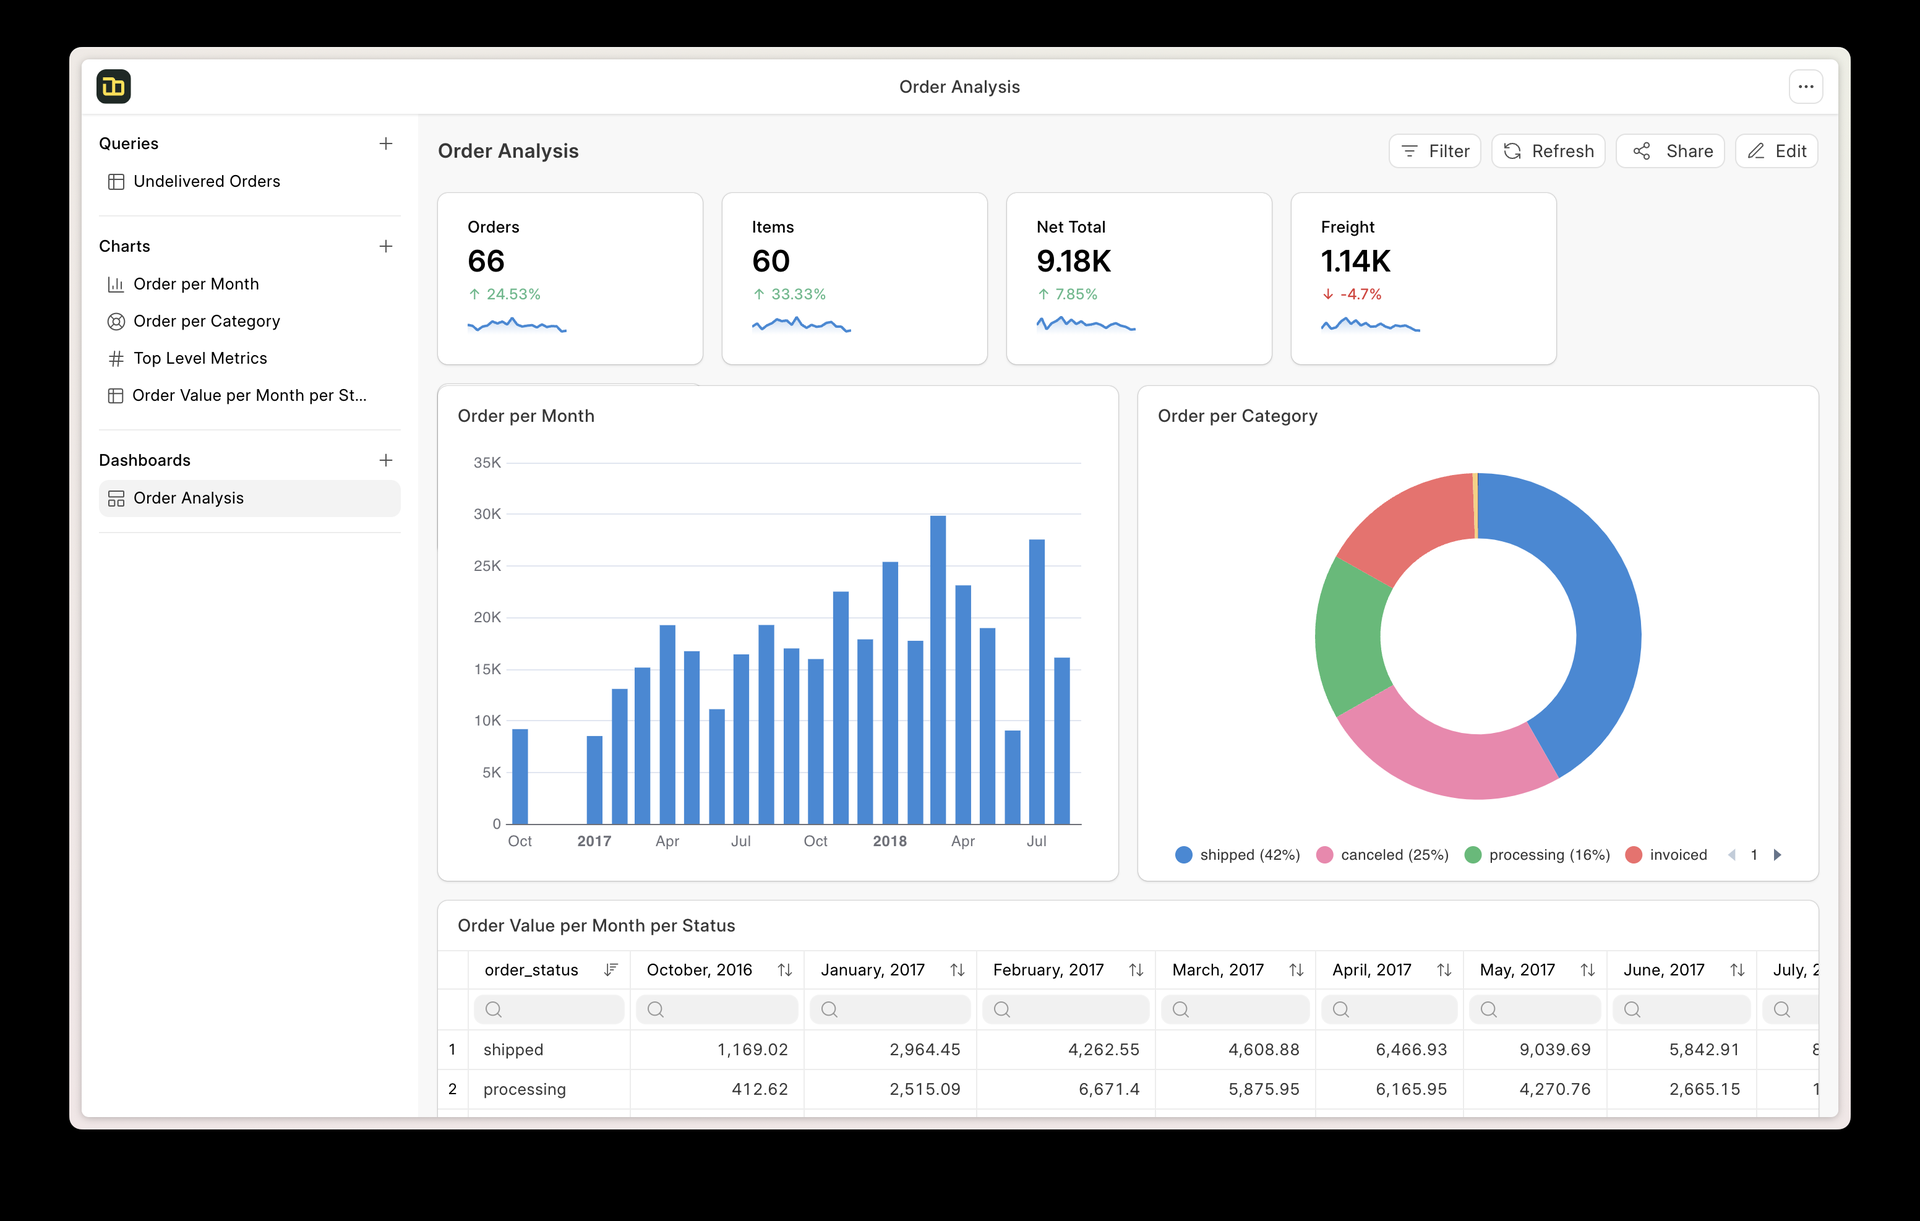
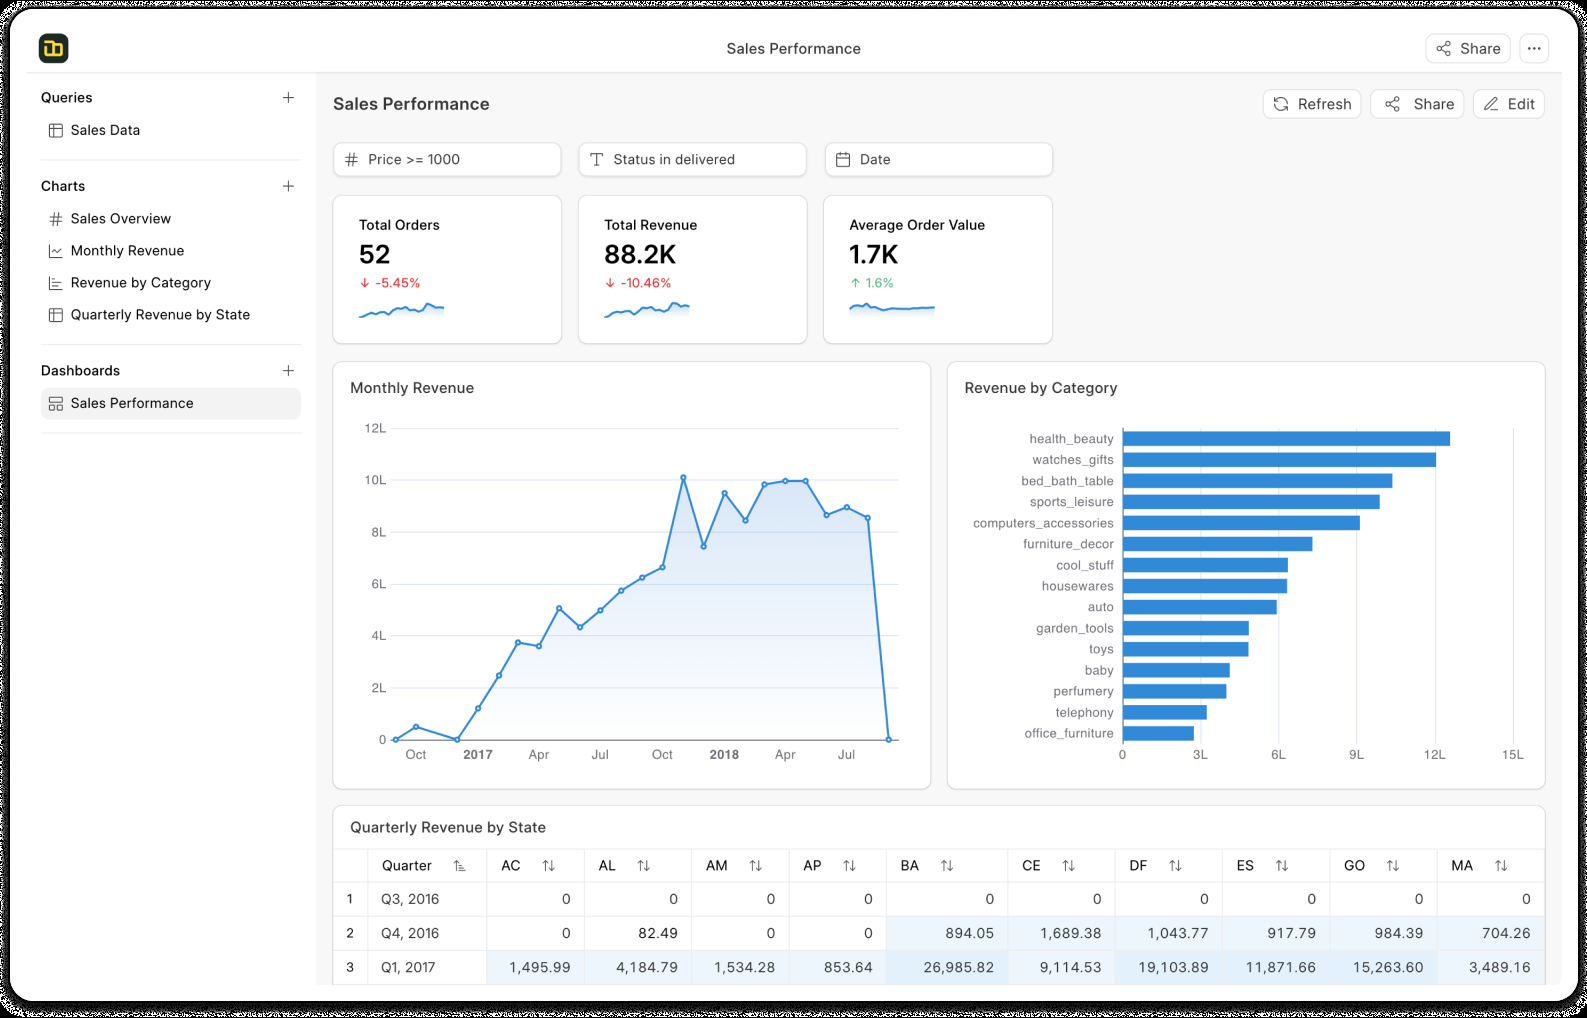
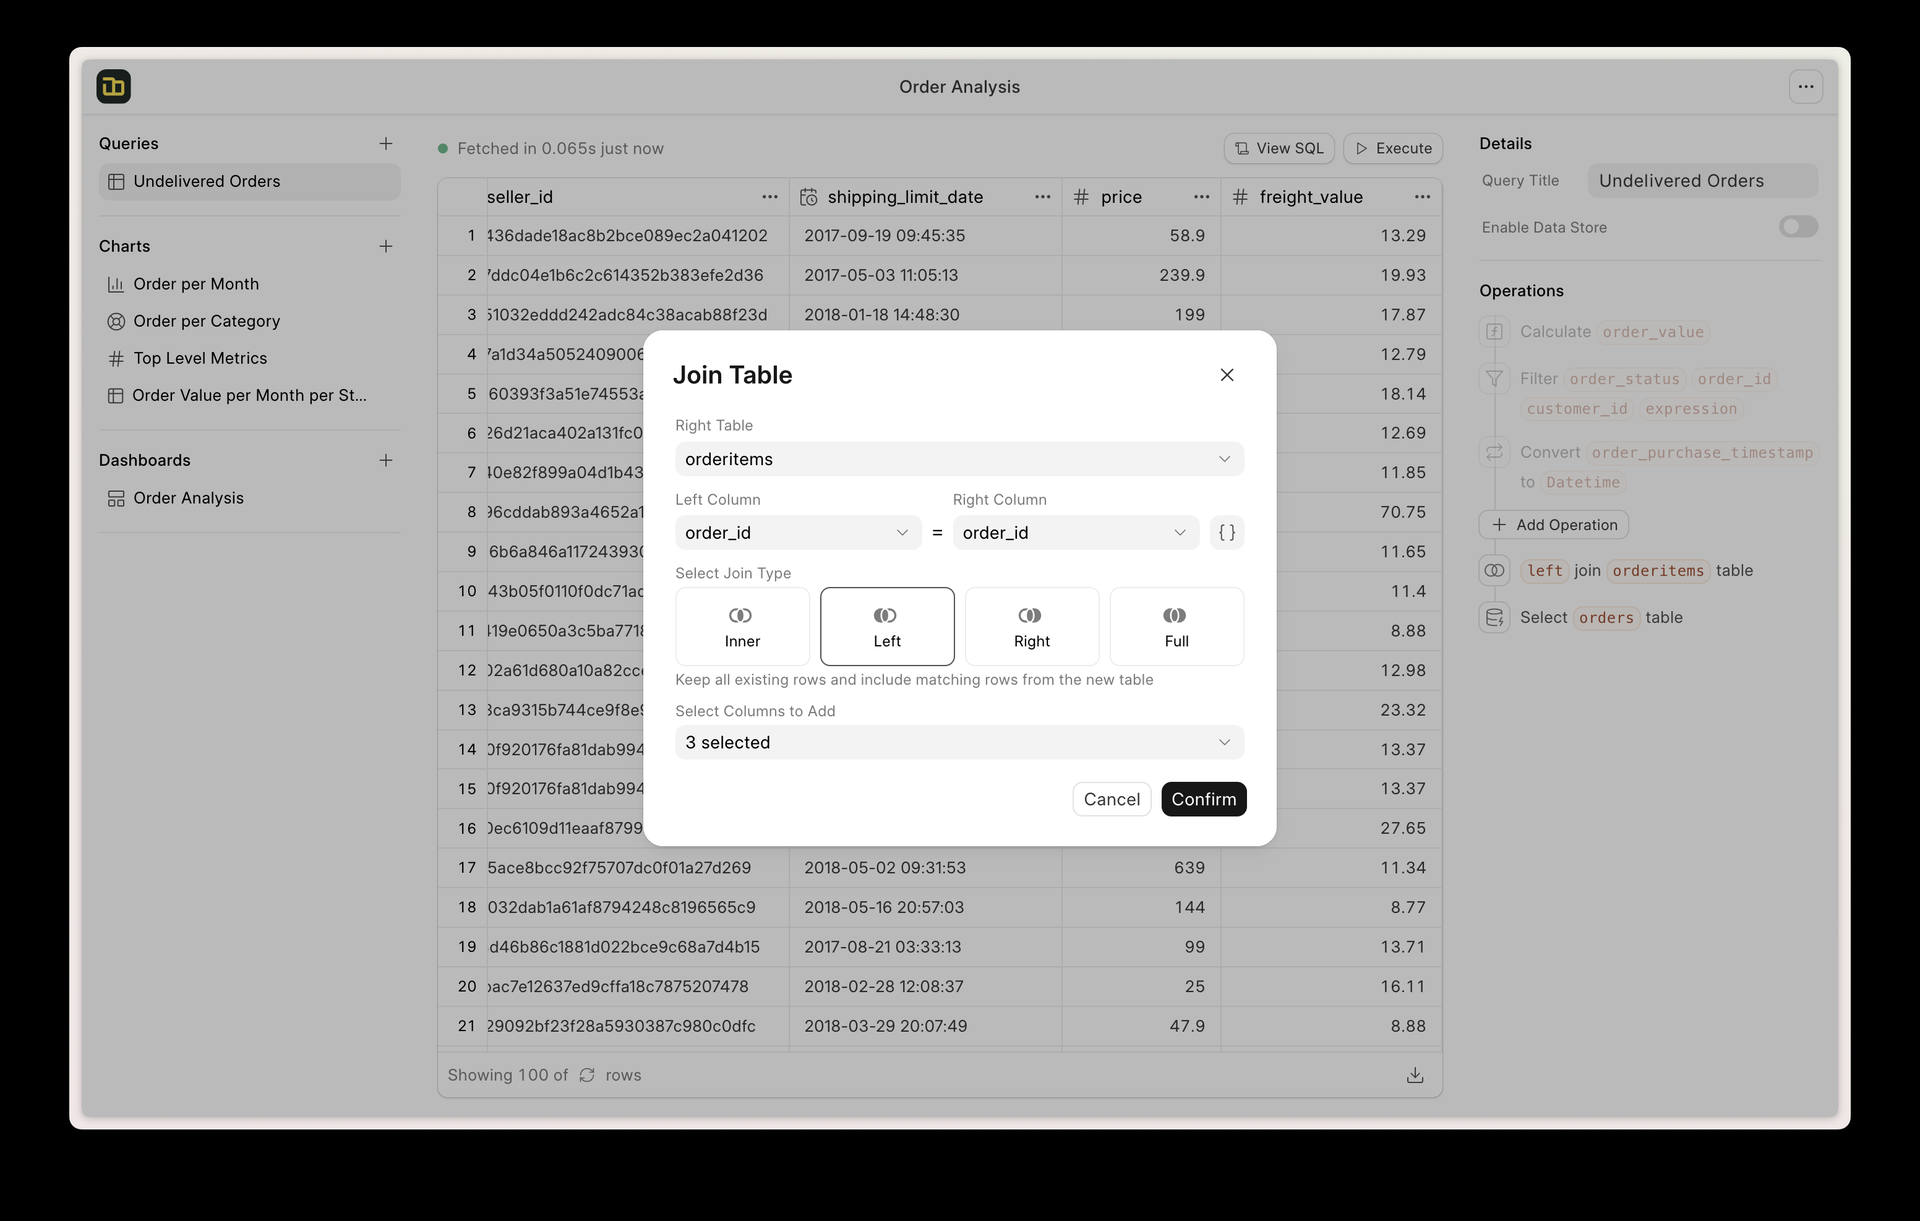
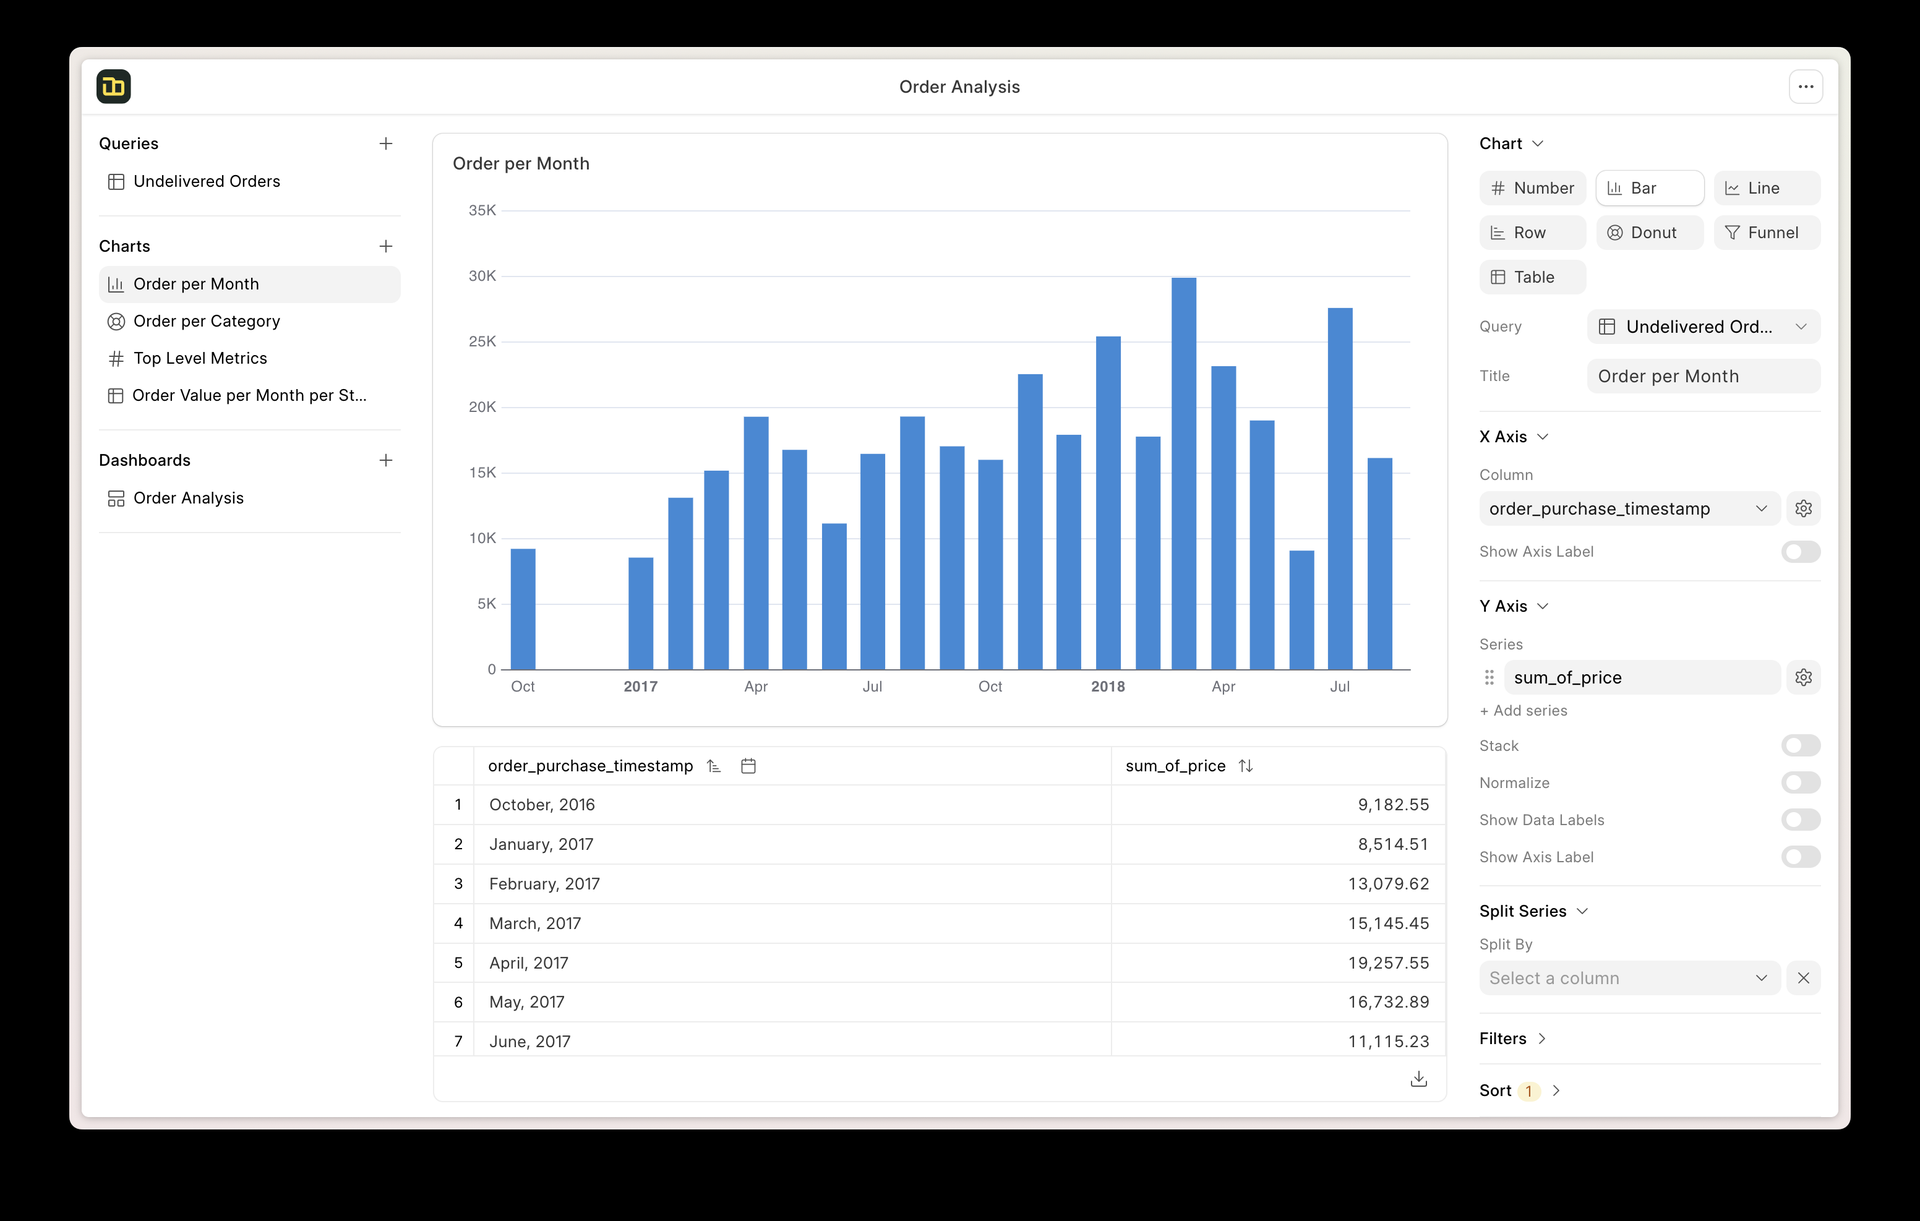
Frappe Insights delivers a self-hosted business intelligence platform where non-technical users build complex analytical queries without writing SQL. The visual query builder uses Ibis under the hood to compose optimized SQL from drag-and-drop column selections, filters, aggregations, and group-by operations — translating point-and-click interactions into performant database queries across MySQL, PostgreSQL, DuckDB, and BigQuery. The join editor provides a graphical interface for defining multi-table relationships, letting analysts connect data across schemas without understanding foreign keys or join types. The chart builder renders interactive visualizations using Apache eCharts with support for bar, line, area, pie, scatter, funnel, and pivot table chart types — each configurable with axes, colors, legends, and formatting options. Dashboards combine multiple charts into shareable views with layout customization, auto-refresh intervals, and filter propagation across widgets. Data source management handles connection pooling across multiple databases simultaneously, enabling cross-database analysis in single queries. Server scripts extend query capabilities with custom Python transformations for complex business logic that visual tools cannot express. Built on the Frappe Framework's full-stack architecture, deployment uses Docker via the official easy-install script that provisions the complete stack including MariaDB, Redis, and Nginx. Running on a dedicated VPS on RepoCloud with guaranteed CPU, RAM, and SSD, full root SSH access, and a browser serial console. AGPL-3.0 licensed.
Benefits
- No-Code Visual Query Building
- Visual interface translates drag-and-drop column selections, filters, and aggregations into optimized SQL via Ibis — analysts query databases without learning SQL syntax.
- Multi-Database Data Connectivity
- Connect MySQL, PostgreSQL, DuckDB, and BigQuery simultaneously with connection pooling. Run cross-database analysis combining data from multiple sources in single queries.
- Interactive Dashboard Sharing
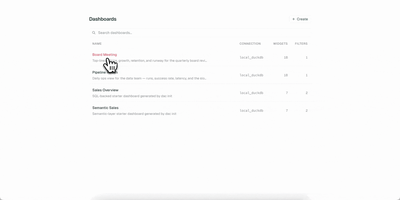
- Combine charts into dashboard layouts with auto-refresh intervals and filter propagation. Share internally with team members or externally via public links.
- Frappe Ecosystem Integration
- Install alongside ERPNext or any Frappe app to analyze application data directly without ETL pipelines, replication, or separate data warehouse infrastructure.
Features
- Visual Query Builder
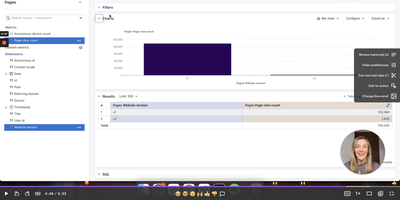
- Drag-and-drop interface for selecting columns, applying filters, defining aggregations, and grouping results with real-time SQL preview and query execution.
- Graphical Join Editor
- Define multi-table relationships visually with automatic join type detection, handling inner, left, right, and cross joins without SQL knowledge.
- eCharts Visualization
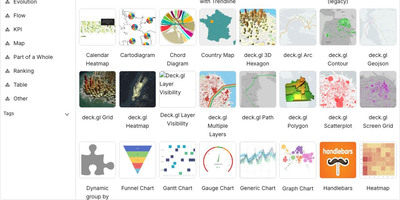
- Apache eCharts renders bar, line, area, pie, scatter, funnel, and pivot table charts with configurable axes, legends, tooltips, and responsive layouts.
- Server Script Extensions
- Custom Python scripts transform query results for complex business logic that visual tools cannot express, executing server-side with full Frappe API access.
- Docker One-Command Deploy
- Official easy-install script provisions MariaDB, Redis, Nginx, and the Frappe application stack with TLS certificates on a single Docker host.