
Maloja
Maloja's one job is to be your own scrobble database, charting what you listen to from a server you control. Players and media servers that speak the native JSON API or a ListenBrainz, GNU FM, or Audioscrobbler 1.2 compatible protocol can scrobble with their own API keys. Vinyl sessions and background music can be logged by hand on a manual scrobble page. Existing history moves in from a Last.fm export, a Spotify data export, a ListenBrainz export, or another Maloja instance, while a proxy option forwards new scrobbles to Last.fm or a second Maloja server. The start page ranks top artists, tracks, and albums for today, this week, this month, this year, or all time, alongside a pulse chart of listening volume and a feed of the latest scrobbles. Artist and album pages add performance charts that follow chart position over time. Collaborations credit every artist on a track, and subunits, solo projects, and main acts can be combined or separated in charts at any time. Gold, Platinum, and Diamond awards mark tracks and albums that pass scrobble thresholds you set. Artwork can come from Last.fm, Spotify, Deezer, TheAudioDB, or MusicBrainz lookups, or from images you upload yourself. Week start, timezone, theme, and tile layout are all settings, and an API explorer lists endpoints for scripts. Running on a dedicated VPS on RepoCloud with guaranteed CPU, RAM, and SSD, full root SSH access, and a browser serial console. GPL-3.0 licensed.
CHMonitor
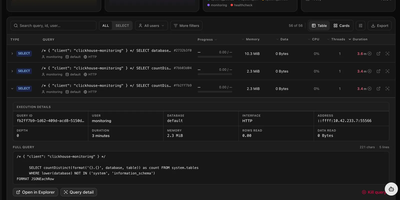
When a ClickHouse cluster slows down, the answers are buried in system tables nobody wants to query by hand; CHMonitor turns those tables into an operations dashboard that explains what the cluster is doing and what to fix next. Live views cover running queries with elapsed time, memory, and a kill action, while history, failed, slowest, and most-expensive pages rank finished work by CPU, duration, and rows read, each with the full statement and one-click EXPLAIN. Thread-level analysis shows how a single query parallelized, and per-user summaries reveal which analyst or service is eating the cluster. Beyond queries, you get a merge and part-lifecycle timeline, replication queue and Keeper health, a live topology map of shards and replicas, storage breakdowns by database, table, and part, and a query activity heatmap spanning a year. An AI advisor reviews the workload and recommends skip indexes, projections, PREWHERE clauses, and TTL changes ranked by impact, with an MCP interface and built-in agent for asking questions in plain English; it recommends only and never applies DDL. Threshold-based health checks alert to Slack, Discord, PagerDuty, or Opsgenie, multiple ClickHouse hosts are watched from one dashboard, and a companion terminal UI covers quick checks from the shell. Running on a dedicated VPS on RepoCloud with guaranteed CPU, RAM, and SSD, full root SSH access, and a browser serial console. GPL-3.0 licensed.
TradingAgents GUI
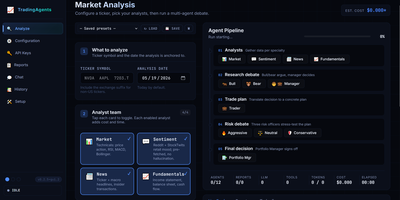
Built atop the TauricResearch TradingAgents framework with nearly 100,000 GitHub stars, TradingAgents GUI transforms a CLI-only multi-agent LLM stock analysis pipeline into a polished web application accessible at localhost:5000. The system deploys twelve specialized AI agents — fundamental analysts, sentiment experts, technical analysts, bull and bear researchers, a trader, risk management team, and portfolio manager — who collaboratively debate market conditions through structured LangGraph workflows before producing a final BUY, SELL, or HOLD recommendation. The interface supports ten LLM providers including OpenAI, Anthropic, Google, OpenRouter, DeepSeek, Ollama, xAI, Qwen, GLM, and MiniMax, with a first-run wizard that auto-detects configured API keys and tests connections. A live pipeline visualization shows each agent's status with real-time progress bars, while the tabbed output area separates Live Feed, Reports preview, and Tool calls into dedicated panes. The three-pane Reports tab provides searchable indexing, table-of-contents navigation, and export to Markdown, HTML, or PDF formats. Report length control across Concise, Standard, and Comprehensive modes saves up to 50% on token costs. Multi-session chat allows pinning past reports as grounding context with live token counting and context-window warnings. Three built-in themes — Terminal, Modern, and Bloomberg — persist per browser. Docker Compose deployment maps port 5000 with persistent report storage. Running on a dedicated VPS on RepoCloud with guaranteed CPU, RAM, and SSD, full root SSH access, and a browser serial console. Apache 2.0 licensed.
Quant-UX
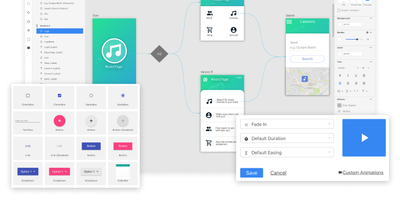
Most design tools stop at prototyping; Quant-UX also measures how real users actually perform with the prototype. The visual editor creates prototypes that behave like real apps - functional input widgets, animations, form validation, data binding across screens, and business logic modeled with REST requests and decision elements. Design systems are first-class, with components, design tokens, and master screens; if you design elsewhere, drop in image files or import from Figma. Testing is a shared link or QR code - no installs on the tester's side. Define user tasks up front, and Quant-UX records every session: click heatmaps show where users found (or missed) actionable elements, user journey graphs expose lost users, drop-off charts reveal where tasks stall, and success rates and task KPIs are extracted automatically into a dashboard. An A/B test operator wires two design variants into one prototype and compares task duration, success rate, and interaction counts. In-prototype surveys collect qualitative feedback alongside the numbers, and an AI assistant generates prototype fragments like styled forms on request. The RepoCloud deployment runs the full stack - frontend, backend, and WebSocket server containers over MongoDB - so all test recordings and research data stay on your infrastructure.
Helical Insight
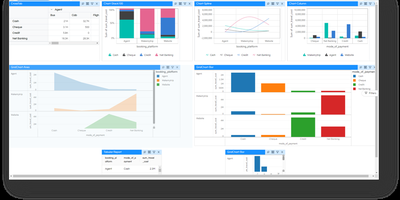
Finance closes the month with invoices that must print perfectly, analysts answer questions from a dashboard, and executives ask the data things in plain language: one platform handles all three jobs. Interactive dashboards support drill-down, drill-through, filters, KPI widgets, maps, and pivot tables, and scheduled delivery or report bursting pushes personalized copies to the people who need them. Pixel-perfect paginated reports cover statements, regulatory documents, and anything where layout is not negotiable. A chat interface generates SQL against connected sources, summarizes reports, and surfaces insights, running against a language model the organization itself chooses. Embedding puts dashboards, reports, and the chatbot inside customer portals and SaaS products, with white labeling swapping logos, themes, colors, and URLs for OEM delivery. Multi-tenancy isolates customers or departments on a single deployment. Row, column, and table level security follows the logged-in user, arriving through JWT, Okta, Keycloak, OAuth, or custom token single sign-on. Exports land in PDF, Excel, CSV, Word, HTML, JSON, and XML. Caching, pagination, virtualization, and clustering keep large deployments responsive, localization adapts the interface for regional teams, custom JavaScript visualizations extend the built-in charts, and REST APIs automate administration across the whole system. Running on a dedicated VPS on RepoCloud with guaranteed CPU, RAM, and SSD, full root SSH access, and a browser serial console. AGPL 3.0 licensed.
DAC
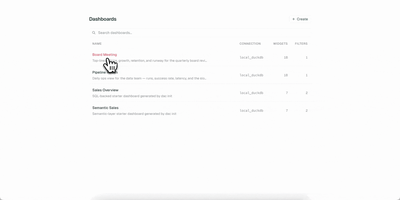
Your dashboards deserve version control, code review, and reproducible builds, just like the rest of your stack. DAC lets you define interactive data dashboards in YAML or TSX, validate them in CI, and serve them from a single Go binary that embeds a full React frontend. Choose from 21 chart types including line, bar, area, pie, scatter, bubble, funnel, sankey, heatmap, calendar, sparkline, waterfall, gauge, treemap, radar, and candlestick, plus metric cards, data tables, text blocks, and image widgets. The built-in semantic layer lets you define metrics and dimensions once in reusable model files, then reference them from any widget while DAC generates the SQL automatically. Connect to Postgres, MySQL, Snowflake, BigQuery, Redshift, Databricks, and DuckDB through standard Bruin connection configs. Interactive filters with date pickers, dropdowns, multiselects, and search inputs inject values via Jinja templating and re-execute only affected widgets. Live reload via Server-Sent Events refreshes connected browsers instantly when you save a file. Export dashboards as self-contained static HTML with baked-in query results for S3, GitHub Pages, or offline sharing, and render slide decks via the Google Slides export command. On RepoCloud, deploy DAC on a dedicated VPS with root SSH access and persistent storage for your dashboard definitions and database connections under the AGPL-3.0 license.
Marketing Dashboard
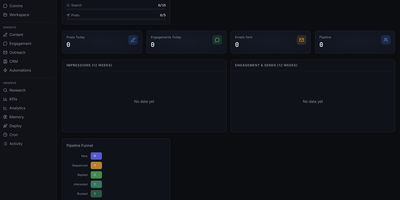
This is a marketing operations control center that replaces fragmented CRM, outreach, content, and analytics tools with a unified self-hosted interface designed for AI agent-assisted go-to-market teams. The CRM module manages leads through a configurable pipeline funnel with stages from New through Sequenced, Replied, Interested, and Booked, tracking source attribution, industry segments, company size, lead quality scores, and LinkedIn URLs per contact. Outreach sequencing supports email campaigns with pause controls, audit endpoints, suppression workflows, and engagement tracking. The content operations surface provides calendar views, content item management, performance metrics, and approval queues for editorial control. Analytics and KPI dashboards show impressions, engagement, and send volumes over configurable time periods, with optional connectors to Plausible, Google Analytics 4, X, and LinkedIn for cross-platform reporting. The OpenClaw-native agent runtime enables dynamic agent and squad discovery, workspace management, session monitoring, and communications surfaces. Automation scheduling uses cron job templates with OpenClaw-compatible schedule variants including cron expressions, every intervals, and at timestamps. The tech stack combines Next.js 16 App Router with React 19, Tailwind CSS 4, Recharts, and Zustand for state management. Authentication supports session cookies, API keys, and optional Google OAuth with role-based access controls. All state persists locally in SQLite via better-sqlite3 with no required external infrastructure. On RepoCloud, deploy Marketing Dashboard on a dedicated VPS with persistent SQLite storage, root SSH access, and complete control over your marketing operations data, all under the MIT license.
Middleware
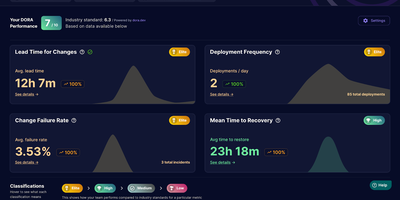
Middleware turns the pull request history your team already has into live DORA metrics, so engineering leads can see deployment frequency, lead time, recovery time, and change failure rate without building a reporting pipeline. Connect GitHub with a personal access token, group repositories into teams, and the dashboard starts charting how often you ship and how long changes take to reach production. Lead time is not one opaque number; it breaks into first commit to pull request, first response time, rework time, merge time, and merge to deploy, so the actual bottleneck is visible instead of guessed at. Merged pull requests count as deployments and revert pull requests count as incidents, which means recovery time and change failure rate appear even if your team has no separate incident tool wired up. You can exclude bot and dependency pull requests, define which branches count as production, and filter incidents in settings, so the metrics match how your team actually ships rather than how a generic template assumes. Bring it to a weekly engineering review to catch a review queue quietly doubling merge times, or open it after an incident to see if failure rate is trending the wrong way across a team. Running on a dedicated VPS on RepoCloud with guaranteed CPU, RAM, and SSD, full root SSH access, and a browser serial console. Apache-2.0 licensed.
PandaProbe
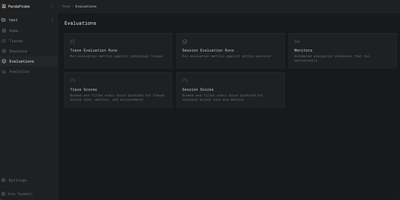
A looping agent burns money quietly until someone can see where it drifted, and PandaProbe is an observability and evaluation platform for AI agents that makes that drift visible step by step. Capture complete executions as sessions, traces, and spans spanning model calls, tool calls, multi-agent handoffs, and custom logic, then follow a looping or failing run back to the decision where it drifted. Score traces and sessions with agent-specific metrics, run asynchronous and sampled evaluations so judge models do not cost more than inference, and use lightweight trajectory signals to catch stalls, bad tool use, and regressions over time. Bring agents built with LangGraph, CrewAI, the Claude Agent SDK, the OpenAI Agents SDK, and other integrations, with MCP tool calls captured automatically where supported. Organize work by user, organization, and project, send data through an SDK or HTTP API with project keys, and query filtered, paginated traces when you need the raw record. Keep sensitive workflows local when that matters: prompts, traces, and evaluation results stay inside the deployment you run, instead of leaving for a hosted console. Running on a dedicated VPS on RepoCloud with guaranteed CPU, RAM, and SSD, full root SSH access, and a browser serial console. Apache-2.0 licensed.
Medama
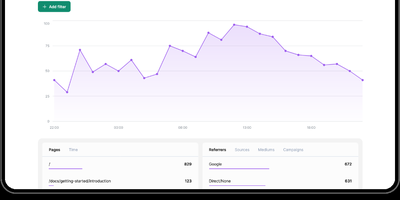
Track website traffic and conversion funnels with sub-second precision while guaranteeing visitors total anonymity with Medama, a privacy-first web analytics platform operating without cookies, IP storage, or consent banners. Site owners embed a sub-kilobyte tracking script into web headers to record page views, session duration, referrers, screen resolutions, browser user agents, and geographic countries anonymously. Built-in caching header mechanisms determine unique daily visitors without generating persistent hashes or storing cross-site identifiers that violate privacy regulations. The web dashboard visualizes hourly traffic trends with interactive area charts and provides multi-dimensional data tables breaking down top-performing pages, search engine referrers, operating systems, and campaign UTM parameters. Developers can instrument custom click events and page attributes using simple HTML data attributes to measure conversions, document downloads, button interactions, and user subscription states. Administrators manage multiple websites from a single interface, configure curated anti-spam blocklists using Firehol and Tor exit node feeds, and monitor server CPU, memory, and disk usage in real time. Full OpenAPI specification endpoints allow teams to export analytics data directly into internal business intelligence pipelines and custom executive dashboards. Running on a dedicated VPS on RepoCloud with guaranteed CPU, RAM, and SSD, full root SSH access, and a browser serial console. Apache-2.0 licensed.
Traffic Source
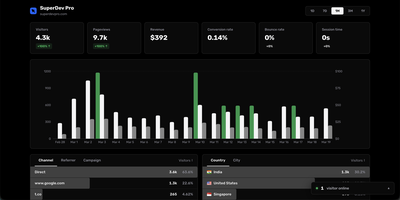
Traffic Source answers the three questions every site owner actually asks: who showed up, where did they come from, and did they pay. The live dashboard counts visitors in real time alongside pageviews, sessions, bounce rate, and session duration, with no cookie banner required because tracking uses no cookies at all. Referrer and UTM breakdowns show exactly which campaigns, newsletters, and posts earn their traffic, while country and city data arrives through proxy headers. Visitor journeys replay every page a person viewed before converting, so you can see the path from first click to checkout instead of guessing. Connect Stripe once and payments are matched to the sessions that produced them automatically, with no webhook plumbing to maintain. The affiliate system lets you create partners with custom commission rates and shareable referral links, and each affiliate gets a public dashboard showing their own clicks and earnings. Search Console data is pulled into the same screen, where a keyword explorer shows the pages, countries, and devices behind any query. One tiny tracking script covers all your sites, including single-page apps. Running on a dedicated VPS on RepoCloud with guaranteed CPU, RAM, and SSD, full root SSH access, and a browser serial console. MIT licensed.

Shortlink
Shortlink is a self-hosted platform for short links and live QR codes that keeps every printed, shared, or forwarded entry point under your control long after it leaves your hands. A code printed on ten thousand flyers cannot be recalled when the campaign page moves, so the destination behind it changes while the printed image stays exactly the same. Create short links with custom codes, a choice of 301, 302, 307, or 308 redirects, expiry dates, visit caps, and a fallback target for when the main destination is down. Build live QR codes backed by a pool of destinations that rotates by order, weight, random pick, or least-shown strategy, with transactional saves so a half-finished edit never goes live. Style each code in classic, rounded, or dot patterns with your own colors and a center logo, preview it in real time, and download print-ready SVG, PNG, or WEBP files. New links and codes land in an approval queue that an admin reviews before anything goes public, and every change is written to an audit log. Teammates sign in with an emailed magic link or GitHub, manage only the resources they own, and watch thirty days of visit trends, unique IPs, and device and browser breakdowns roll in. Running on a dedicated VPS on RepoCloud with guaranteed CPU, RAM, and SSD, full root SSH access, and a browser serial console. AGPL-3.0 licensed.
Ziit
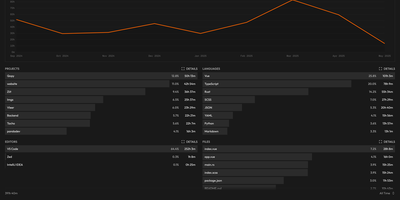
Ziit tracks where your coding hours actually go and shows the answer in a dashboard you host yourself. Install the extension in VS Code, any of its forks, or a JetBrains IDE, and every editing session streams to your instance with its project, language, editor, file, branch, and operating system attached. The dashboard filters by time range and breaks your work down by project and language, so a week of effort becomes a readable chart instead of a vague memory. You sign in with GitHub or email and password, import existing history from WakaTime or a WakAPI instance, and keep building on years of data instead of starting over. README badges embed live coding time for a project into any repository page, turning your profile into a quiet proof of work. A public stats page summarizes the whole instance, and a public leaderboard ranks who logged the most coding hours, which makes self-hosted instances double as community scoreboards. Because the server, the database, and the extensions are all yours, no third-party service sees which files you opened or how long a private project took. Teams can run one instance for everyone and compare effort across projects with the same filters. Running on a dedicated VPS on RepoCloud with guaranteed CPU, RAM, and SSD, full root SSH access, and a browser serial console. AGPL-3.0 licensed.
LetterSpace
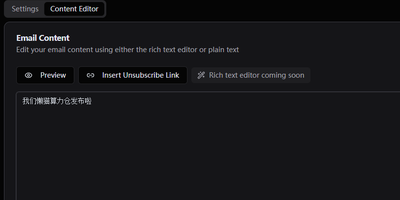
Keep your newsletter audience on infrastructure you own with LetterSpace, a self-hosted platform for subscriber lists, campaigns, and email analytics. Organize subscribers into lists inside your organization, enrich each address with metadata pairs, and use those values as placeholders inside the mail you send. Campaigns begin as drafts where subject, content, template, target lists, and tracking choices stay editable until you deliberately start the send. A test copy goes to your own inbox first, and a future schedule time holds the campaign until the moment arrives. Reusable HTML templates wrap every campaign in your house style, with the content injected at send time and an unsubscribe link in the footer. Once mail flows, the dashboard follows subscriber growth across six months, recent campaign delivery rates, and open and click performance compared between the last thirty days and the period before. Delivery itself runs through your SMTP settings with per-organization rate limits, retries, and concurrency controls, and provider webhooks can report bounces and confirmations back into message statuses. Signup forms and external tools connect through a REST API guarded by keys, with double opt-in available for new subscribers. Running on a dedicated VPS on RepoCloud with guaranteed CPU, RAM, and SSD, full root SSH access, and a browser serial console. MIT licensed.

LynxDB
LynxDB is a single-binary log analytics database that ingests logs once into indexed columnar storage, so you can query the same events repeatedly without re-reading raw files or standing up a JVM stack. Pipe kubectl output or local files straight into the LynxFlow query engine for ad hoc investigation, or run the persistent server and let shippers deliver logs through Elasticsearch bulk, OpenTelemetry OTLP, Splunk HEC, syslog, and raw HTTP ingest paths. LynxFlow pipelines parse JSON, regex, key-value, CSV, and other formats at read time, then extend fields, filter with typed predicates, aggregate with stats, join CTEs, and rank results, all in one explicit grammar with time-series helpers for buckets, percentiles, gap filling, and trend lines. Full-text search runs on an FST dictionary, roaring bitmap postings, and bloom filters that skip cold segments, and materialized views keep partial aggregates ready so dashboards rewrite onto rollups automatically. Convert Sigma detections into LynxFlow queries for security hunting, tail live results as new logs arrive, and tier older data out to S3. Individual analysts use it to dissect local application logs, and platform teams run it as a cluster for shared observability with the Web UI and REST API open to everyone. Running on a dedicated VPS on RepoCloud with guaranteed CPU, RAM, and SSD, full root SSH access, and a browser serial console. Apache-2.0 licensed.