Categories
DevOps Observability Database Monitoring ClickHouse Performance Tuning Analytics InfrastructureStars
Forks
Watchers
Developer links
CHMonitor
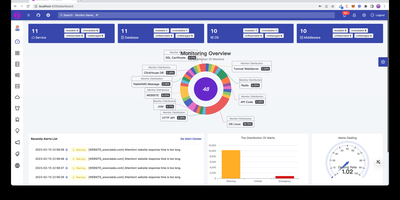
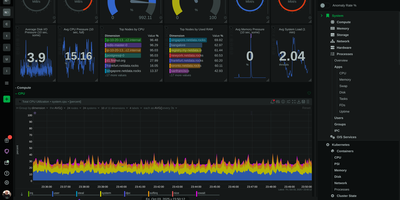
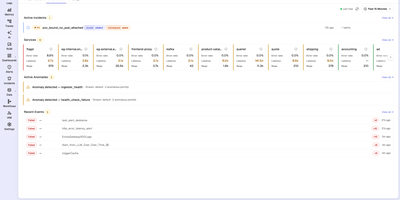
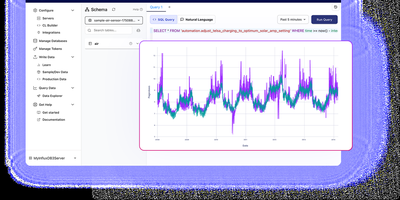
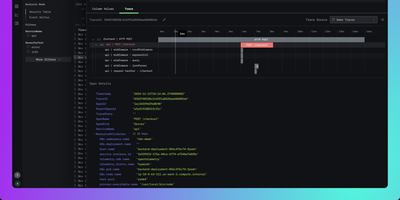
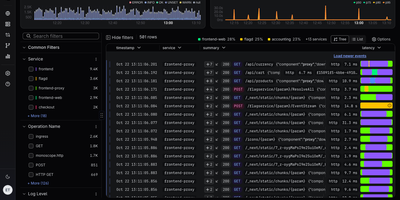
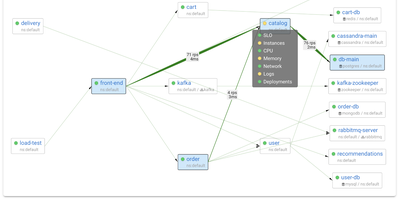
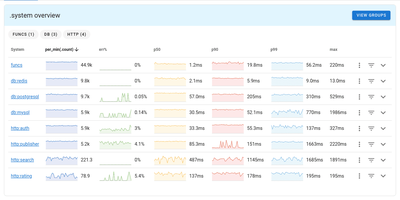
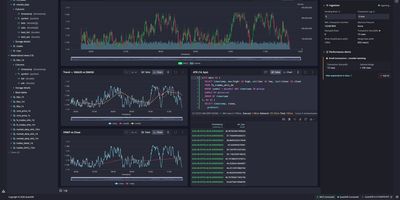
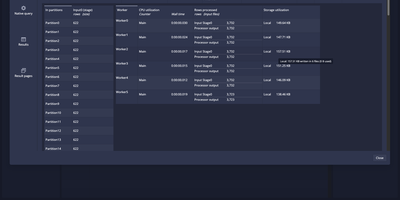
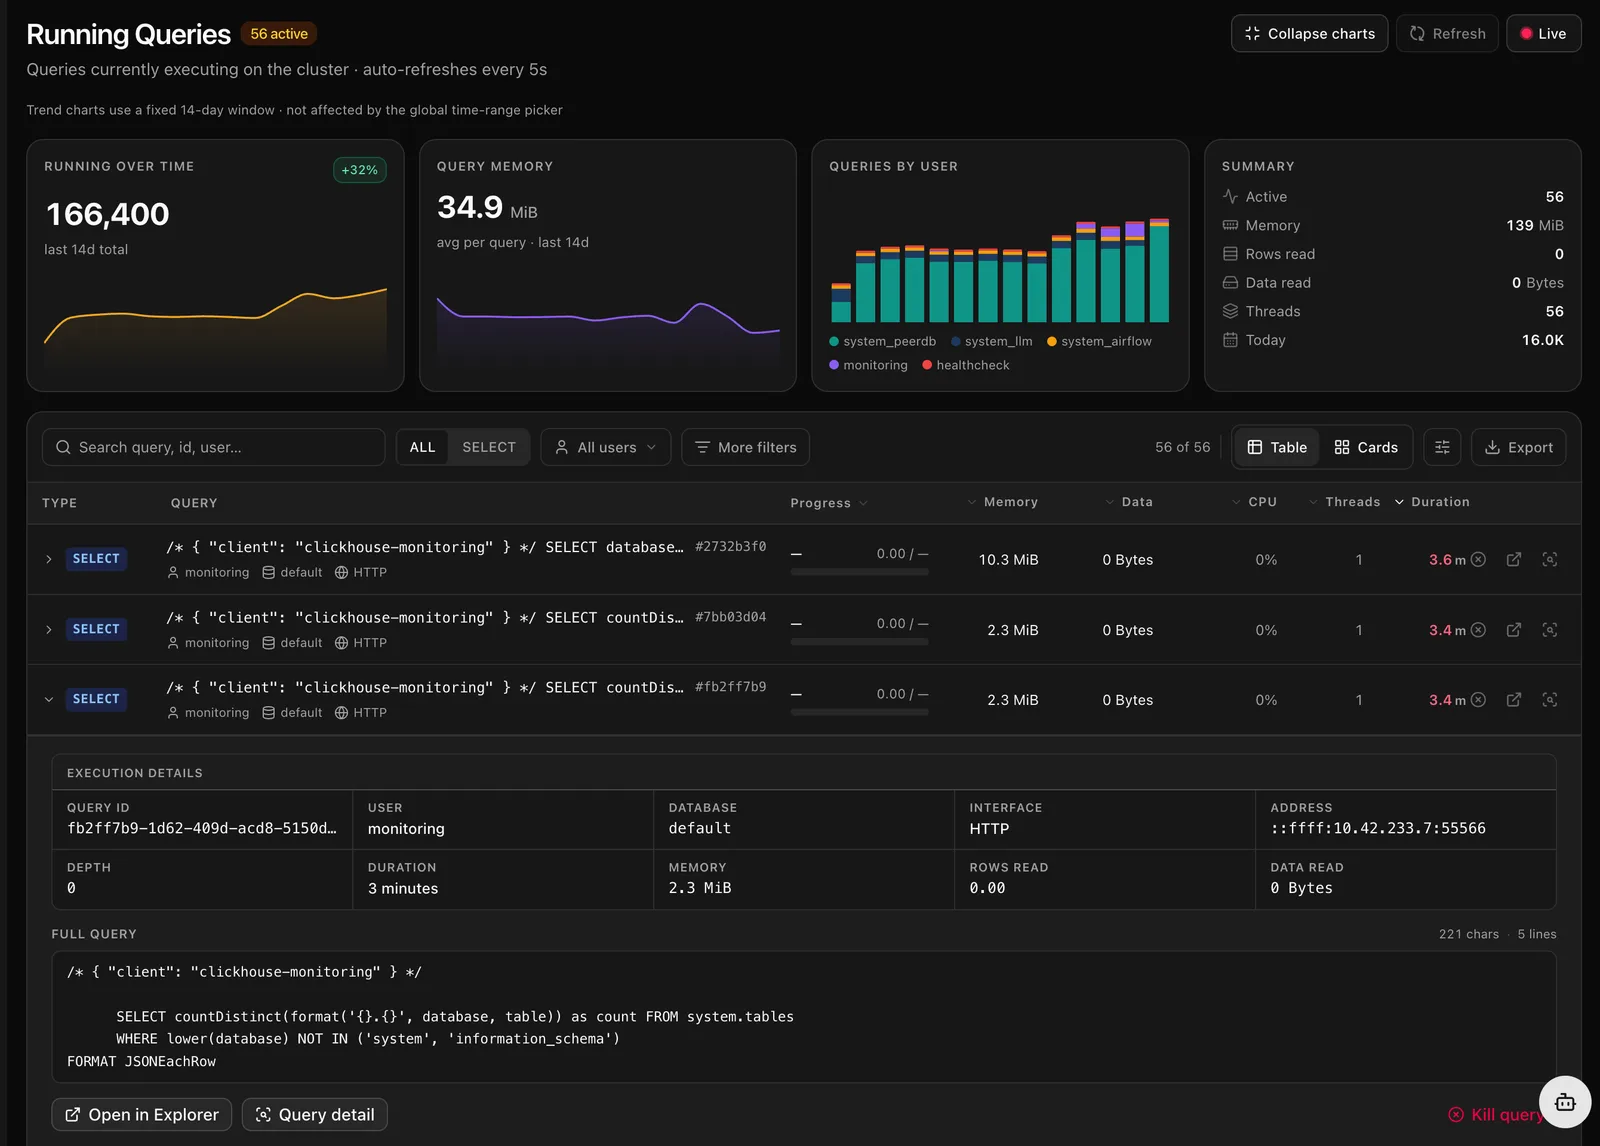
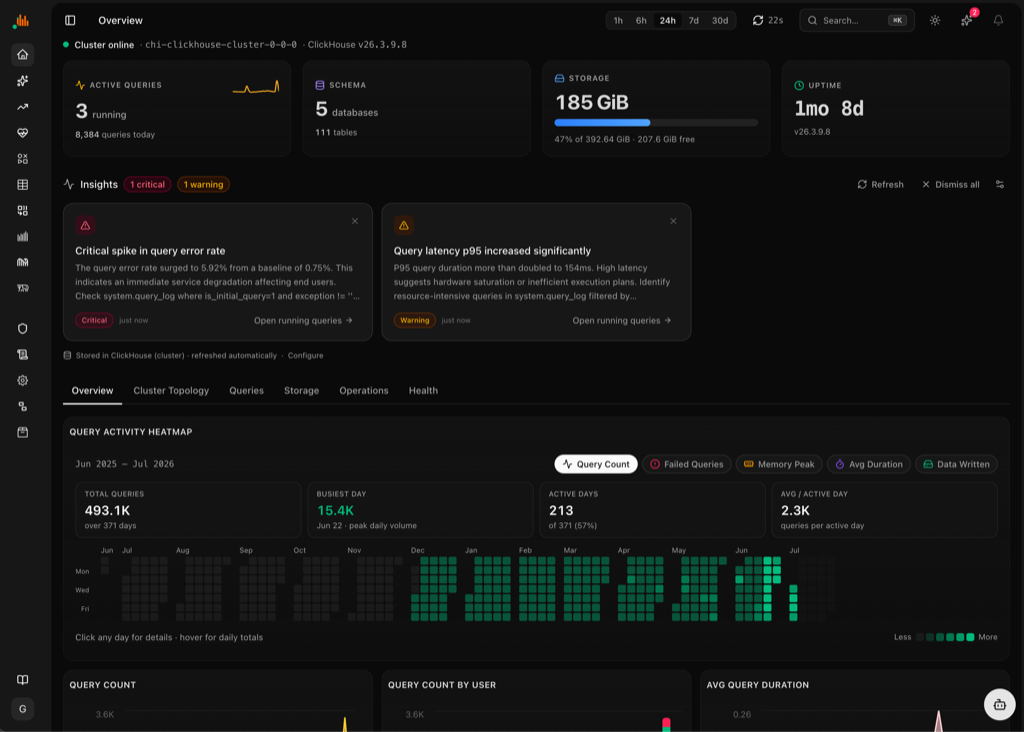
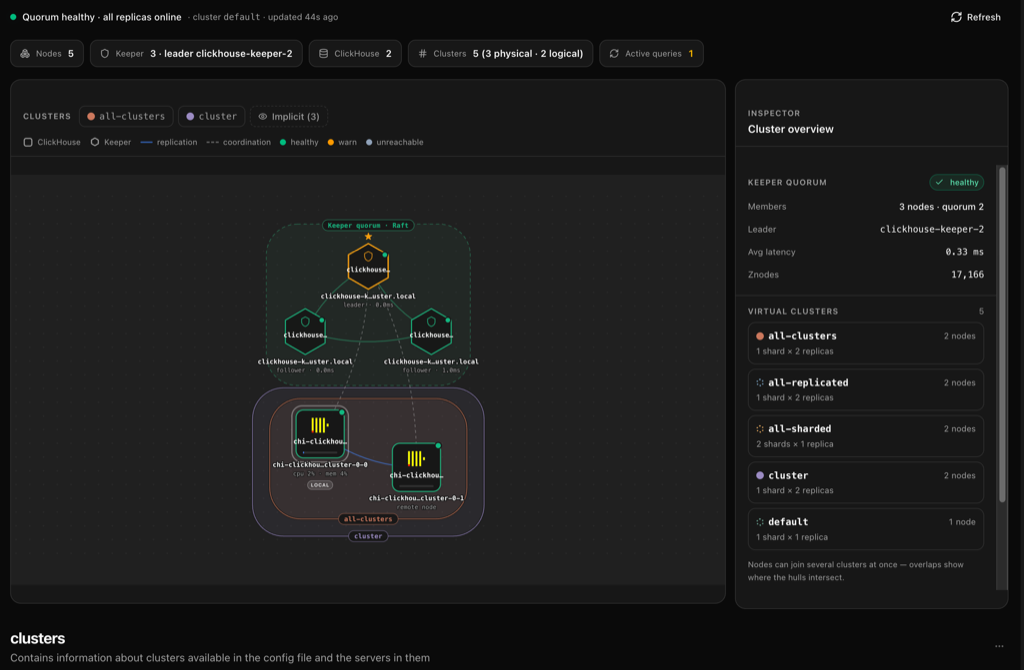
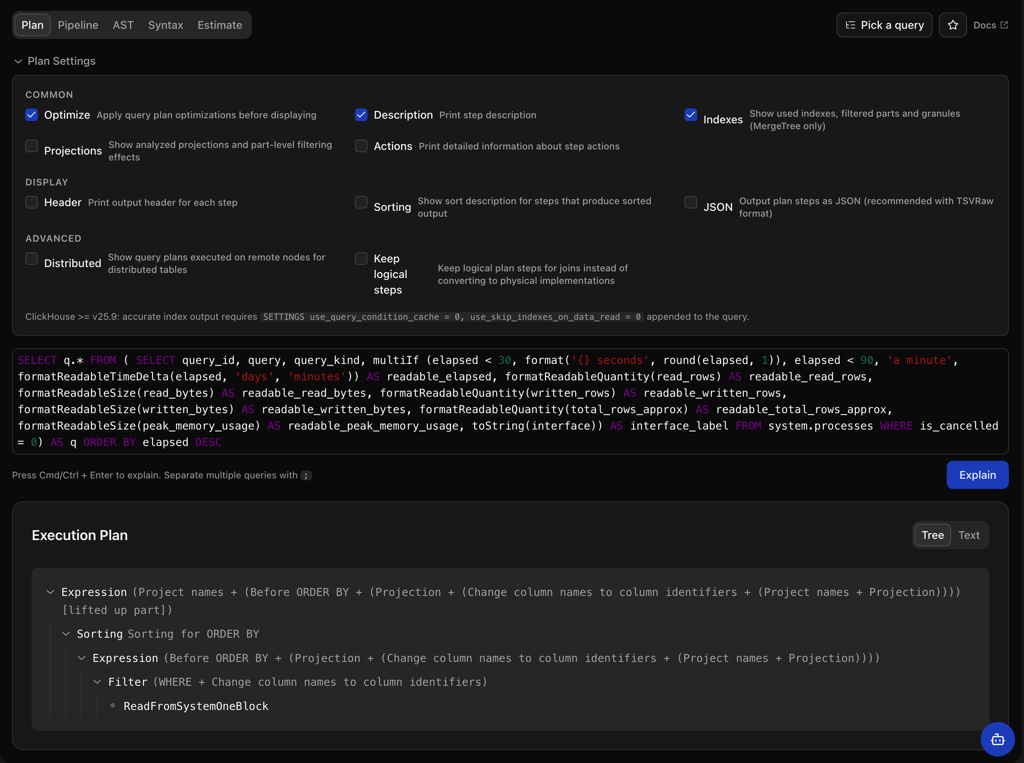
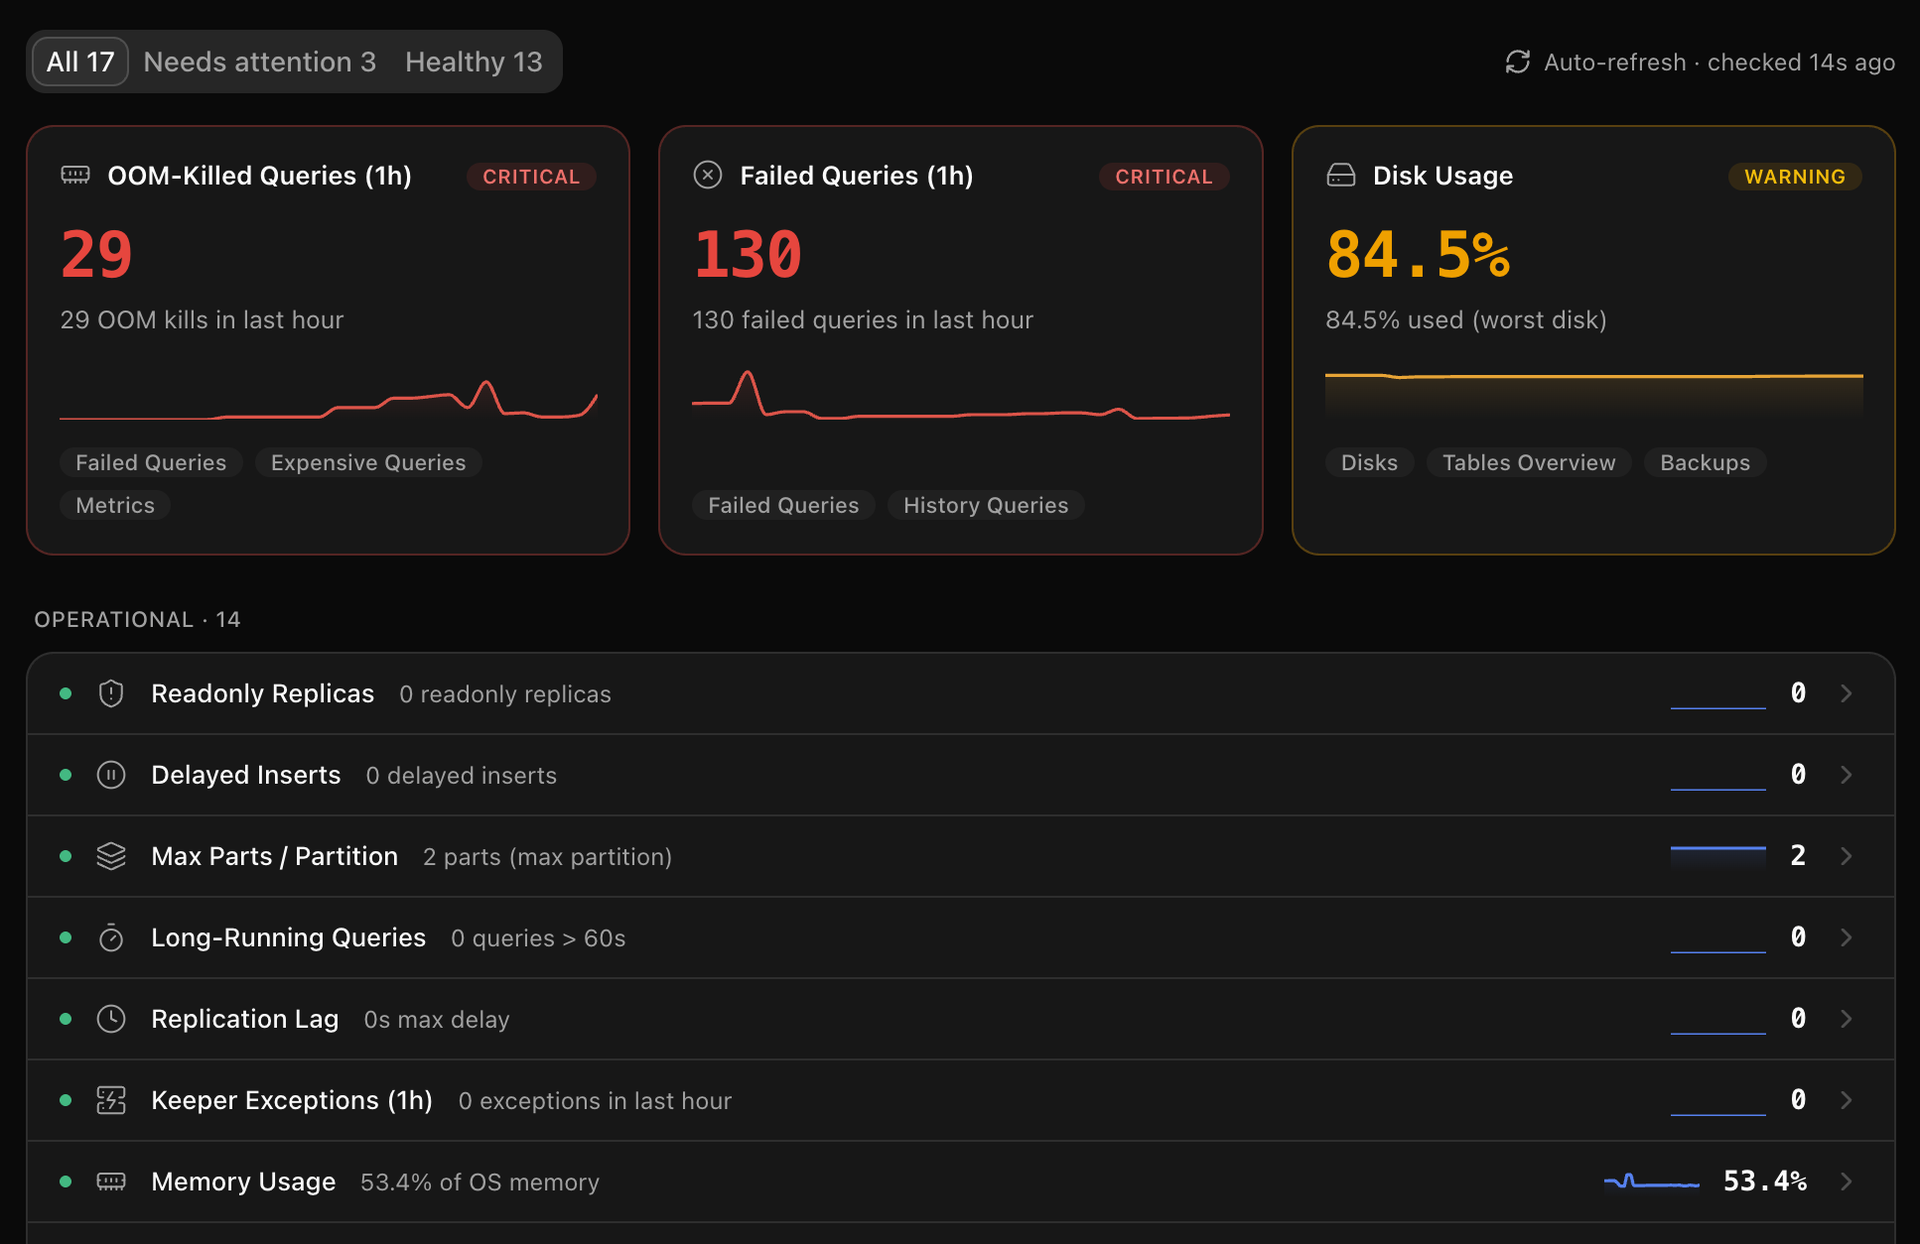
When a ClickHouse cluster slows down, the answers are buried in system tables nobody wants to query by hand; CHMonitor turns those tables into an operations dashboard that explains what the cluster is doing and what to fix next. Live views cover running queries with elapsed time, memory, and a kill action, while history, failed, slowest, and most-expensive pages rank finished work by CPU, duration, and rows read, each with the full statement and one-click EXPLAIN. Thread-level analysis shows how a single query parallelized, and per-user summaries reveal which analyst or service is eating the cluster. Beyond queries, you get a merge and part-lifecycle timeline, replication queue and Keeper health, a live topology map of shards and replicas, storage breakdowns by database, table, and part, and a query activity heatmap spanning a year. An AI advisor reviews the workload and recommends skip indexes, projections, PREWHERE clauses, and TTL changes ranked by impact, with an MCP interface and built-in agent for asking questions in plain English; it recommends only and never applies DDL. Threshold-based health checks alert to Slack, Discord, PagerDuty, or Opsgenie, multiple ClickHouse hosts are watched from one dashboard, and a companion terminal UI covers quick checks from the shell. Running on a dedicated VPS on RepoCloud with guaranteed CPU, RAM, and SSD, full root SSH access, and a browser serial console. GPL-3.0 licensed.
Benefits
- System Tables, Finally Readable
- CHMonitor reads system.processes, system.query_log, and dozens of sibling tables and renders them as live dashboards, sparing you hand-written SQL every time the cluster feels slow or a merge queue backs up.
- Expensive Queries Caught Red-Handed
- Running, failed, slowest, and priciest queries are ranked with duration, memory, and rows read attached, thread-level breakdowns explain parallelization, and a kill action stops runaway work from the table.
- Advice Without Autopilot Risk
- The AI advisor proposes skip indexes, projections, PREWHERE rewrites, and TTL changes ranked by expected impact, but it is recommend-only by design and will never apply DDL to your cluster.
- The Whole Cluster In One Place
- Topology maps, replica lag, Keeper health, merge backlogs, and storage by table and part are monitored across multiple ClickHouse hosts from a single dashboard with Slack, Discord, and PagerDuty alerts.
Features
- Full Query Observability
- Dedicated pages for running, historical, failed, slow, and expensive queries built on system.query_log and system.processes, with saved filter presets, EXPLAIN, and kill-query actions.
- Merges, Parts, And Replication
- A live part-lifecycle timeline tracks merges, mutations, and moves per table, while replication queue depth and Keeper status expose replica lag before it becomes downtime.
- AI Tuning Advisor
- An advisor with MCP support and a built-in agent analyzes schema and workload to rank projection, skip-index, PREWHERE, and materialized-view recommendations by impact.
- Threshold Alerting Everywhere
- Editable health-check thresholds fire alerts to Slack, Discord, PagerDuty, Opsgenie, and more, with a full alert history so noisy checks can be tuned instead of ignored.
- Terminal Companion CLI
- The chm command provides a live terminal UI and a doctor check for shell-first operators, complementing the web dashboard when SSH is faster than a browser.