Stars
Forks
Watchers
Developer links
Quant-UX
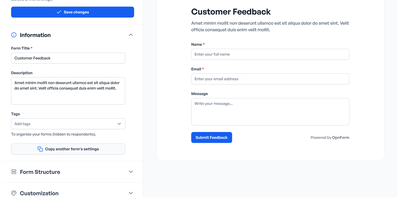
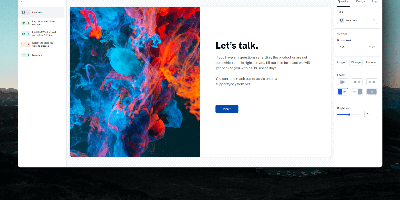
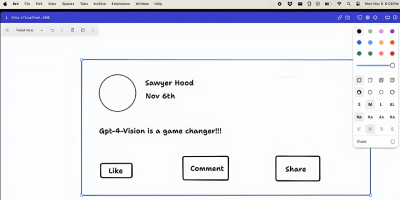
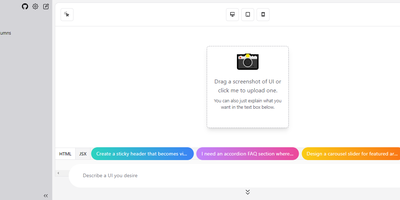
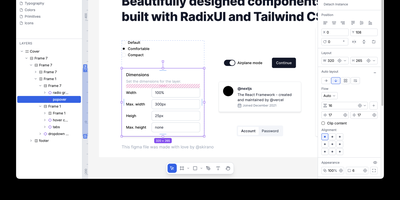
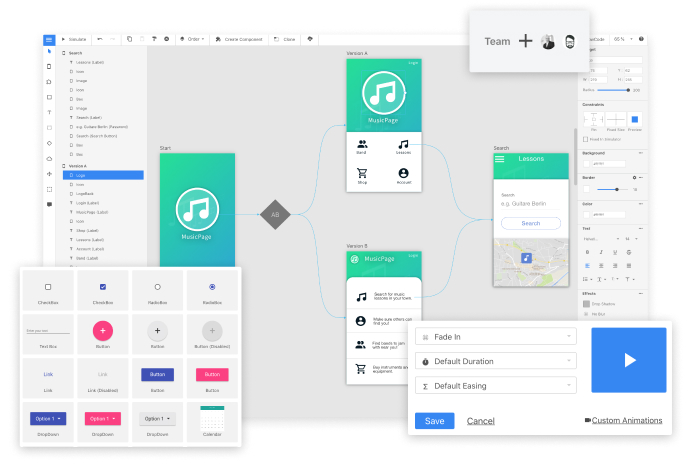
Most design tools stop at prototyping; Quant-UX also measures how real users actually perform with the prototype. The visual editor creates prototypes that behave like real apps - functional input widgets, animations, form validation, data binding across screens, and business logic modeled with REST requests and decision elements. Design systems are first-class, with components, design tokens, and master screens; if you design elsewhere, drop in image files or import from Figma. Testing is a shared link or QR code - no installs on the tester's side. Define user tasks up front, and Quant-UX records every session: click heatmaps show where users found (or missed) actionable elements, user journey graphs expose lost users, drop-off charts reveal where tasks stall, and success rates and task KPIs are extracted automatically into a dashboard. An A/B test operator wires two design variants into one prototype and compares task duration, success rate, and interaction counts. In-prototype surveys collect qualitative feedback alongside the numbers, and an AI assistant generates prototype fragments like styled forms on request. The RepoCloud deployment runs the full stack - frontend, backend, and WebSocket server containers over MongoDB - so all test recordings and research data stay on your infrastructure.
Benefits
- Data, Not Opinions
- Heatmaps, drop-off charts, and automatic success-rate KPIs replace guesswork in design reviews.
- Test With a Link
- Testers open a URL or scan a QR code - no installs, no deployments, works on mobile devices.
- Research Data Stays Private
- Screen recordings and participant behavior live in your MongoDB, not a third-party research cloud.
- Design to Validation in One Tool
- Prototype, distribute, record, and analyze without stitching together separate products.
Features
- Visual Prototype Editor
- Functional widgets, animations, form validation, data binding, and REST-driven logic.
- Click Heatmaps
- See where users clicked, what they missed, and how the mouse moved on every screen.
- User Journeys and Drop-Offs
- Flow graphs expose lost users; drop-off charts show where tasks stall and time per step.
- A/B Testing
- Wire two variants into one prototype and compare duration, success rate, and interactions.
- Task KPIs and Recordings
- Every session is recorded; success rates and task metrics are computed automatically.
- Design Systems and Figma Import
- Components, design tokens, master screens, plus image and Figma imports.