Laminar
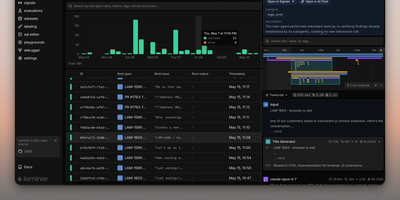
Backed by Y Combinator (S24) and processing traces from thousands of AI agents in production, Laminar is the open-source observability platform that treats agent debugging as a first-class engineering discipline rather than an afterthought. Its OpenTelemetry-native SDK auto-instruments Vercel AI SDK, LangChain, OpenAI, Anthropic, Gemini, Browser Use, Stagehand, Mastra, Pydantic AI, and the OpenAI Agents SDK with a single line of code, capturing every LLM turn, tool call, and sub-agent delegation as nested spans with full input/output data and token costs. The Signals engine lets you describe failures in plain language — "agent is stuck in a loop" or "tool returned empty results" — then reads every trace and alerts via Slack when it detects a match. A built-in debugger records runs and replays them from cache so each iteration takes seconds, designed for Claude Code, Cursor, or Codex to drive the repair loop via the MCP server or CLI. Run code-first evaluations in Python or TypeScript locally or in CI/CD pipelines, build datasets from production traces, and query everything with raw SQL through custom dashboards, the in-app editor, or your coding agent. The Rust backend delivers 20x trace compression, a custom real-time streaming engine, ultra-fast full-text search, and gRPC ingestion, while ClickHouse powers columnar analytics and PostgreSQL stores application state. Running on a dedicated VPS on RepoCloud with guaranteed CPU, RAM, and SSD, full root SSH access, and a browser serial console. Apache 2.0 licensed.
Canonry
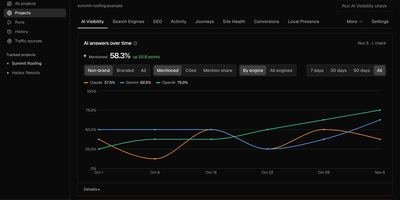
When a buyer asks ChatGPT which company to call, your brand is either inside the answer or invisible: Canonry tracks those mentions and citations across ChatGPT, Claude, Gemini, Meta Muse, and Perplexity, then joins them with the search, ads, and traffic data that explains them. You see mention share against named competitors, the exact answers and sources behind every result, and where rivals get cited while you do not. Server-side traffic analysis reads your own logs to show which pages GPTBot, ClaudeBot, and other AI crawlers visit, which pages AI assistants open for users, and who clicks through. Site Health crawls score every page for AI readiness and map the internal links between them, with each finding listing the pages it affects. Keyword volume, difficulty, rankings, and search gaps come from DataForSEO, while the content engine points at the pages to write or improve next and can draft them to WordPress for review. Your connected agent works the same evidence through the REST API, CLI, or MCP: find competitor citations, prepare a fix, publish and submit URLs to Google and Bing, then rerun checks and report what changed. Schedules rerun everything on a clock with alerts to Discord or Slack, and Aero, the built-in analyst, reads the evidence and explains what moved. Running on a dedicated VPS on RepoCloud with guaranteed CPU, RAM, and SSD, full root SSH access, and a browser serial console. MIT licensed.
NeutralPress
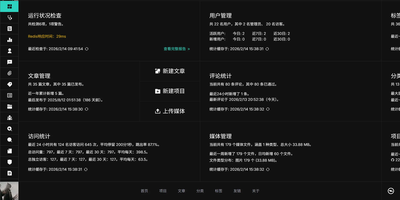
Bloggers and small communities who love static-site speed but miss a real admin panel get both from NeutralPress, a dynamic CMS that regenerates pages only when content changes and serves everything else like a static site. You write in a WYSIWYG editor or in Markdown and MDX, manage drafts and versions, and build custom pages by dragging components together with live preview, all inside a backend that shares the frontend's design language instead of feeling like a separate era. A media system compresses and optimizes images, shows EXIF data, builds photo walls, and guards against hotlinking, while tags and categories organize the archive. Readers get nested comments with moderation and anti-spam, full-text search tuned for content and code terms, RSS and newsletter subscriptions, and a friend-links system that checks its own links and hides the dead ones. Behind the scenes, multi-role permissions, OAuth and passkey sign-in, two-factor authentication, rate limiting, audit logs that can restore changes, visitor analytics with keyword and device breakdowns, and scheduled health checks keep the site safe and understood. Storage can live on local disk, S3, R2, or other object stores, with several strategies running side by side. Running on a dedicated VPS on RepoCloud with guaranteed CPU, RAM, and SSD, full root SSH access, and a browser serial console. MIT licensed.
Malloy Publisher
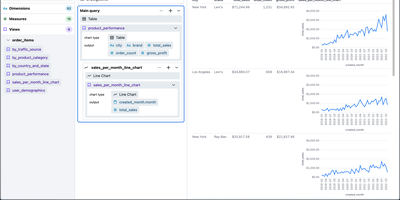
Analytics teams, and increasingly the AI agents working beside them, get one shared definition of the business from Malloy Publisher instead of a pile of SQL queries that each compute revenue slightly differently. You model what your data means once: the sources, the joins, the measures, and who may see what. Agents then compose queries against that model over MCP, so there is no wrong join, no invented column, and no fan-out that double-counts while looking plausible, and the same question returns the same numbers tomorrow. Applications and BI tools reach the same model over REST, and unattended agents use the same governed path instead of scraping raw tables. Reports declared in Malloy read top to bottom or lay out as tile grids you can build by dragging, no-build HTML data apps ship inside the package, and the built-in Console lets anyone browse environments, packages, models, and results without writing code. Access rules decide who may query and which rows they see, discovery curation decides what is even visible, and a single annotation materializes an expensive source or pre-aggregates it on a schedule. Local files work through built-in DuckDB, while BigQuery, Snowflake, Postgres, Databricks, and others connect when the data already lives there. Running on a dedicated VPS on RepoCloud with guaranteed CPU, RAM, and SSD, full root SSH access, and a browser serial console. MIT licensed.
Telescope
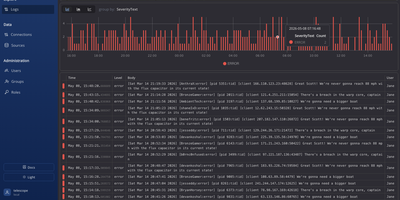
Four log stores should not mean four tools open during an outage, and Telescope is a web log viewer that explores ClickHouse, StarRocks, Docker, and Kubernetes logs in one place. Connect multiple sources, decide which fields each one exposes, mark fields as suggested or hidden, and enable autocompletion so everyday lookups start with structured filters rather than query syntax. When filters are not enough, drop into raw SQL with full WHERE expressions, choose the columns and formatting you want, and narrow results with a time selector that understands relative ranges. Group logs by any field, including nested JSON, map, and array values, and read the interactive chart to spot spikes and anomalies without hand-writing aggregation queries. Save the filter combinations your team reaches for during incidents, share those views, and jump straight to the logs that matter next time. Control who sees what with per-source user and group permissions, GitHub authentication with organization checks, and role-based access for querying. Collapse the sidebar into focus mode when the screen should belong to log lines alone, whether you are chasing container output locally or production records at scale. Running on a dedicated VPS on RepoCloud with guaranteed CPU, RAM, and SSD, full root SSH access, and a browser serial console. MIT licensed.
Betterlytics
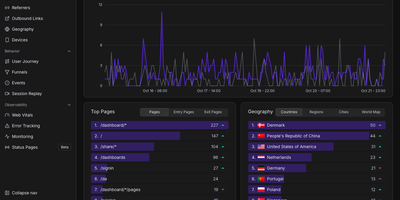
Page views, funnels, session replays, error reports, Core Web Vitals, and uptime checks share one cookieless dashboard in Betterlytics, so teams stop stitching several tools together. The overview charts visitors, page views, bounce rate, and visit duration against the previous period, and annotations mark launches or campaigns right on the timeline. Breakdowns cover referrers, channels, UTM campaigns, browsers, devices, and operating systems, with visitor locations on a world map once an optional MaxMind key is added. Custom events, global properties such as plan or app version, and outbound link tracking show what visitors actually do, while user journey diagrams and funnels reveal where they drift away. Session replay is opt-in per tracking script, masks text and form inputs by default, and can keep recordings in your own S3-compatible bucket. Error tracking groups JavaScript errors with stack traces, a session trail, and a link to the matching replay. Uptime and SSL monitors alert through Slack, Discord, Teams, or webhooks and feed public status pages on your own domain. Teammates join by invitation, two-factor login is available, and a built-in MCP server lets Claude, Cursor, or Codex answer traffic questions. A script of about 3.5 KB or a WordPress plugin handles installation. Running on a dedicated VPS on RepoCloud with guaranteed CPU, RAM, and SSD, full root SSH access, and a browser serial console. AGPL-3.0 licensed.
AIUsage
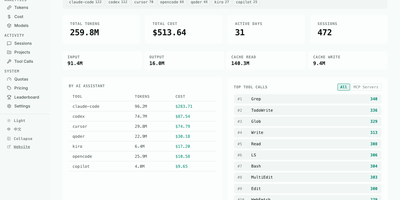
AIUsage shows where your AI coding spend actually went: it reads the session logs that Claude Code, Codex, Cursor, OpenCode, Copilot, Gemini CLI, and many other assistants leave behind, then turns them into one dashboard with tokens, estimated dollars, and activity. The Overview page totals tokens, cost, active days, and sessions for today, this week, this month, or all time, and filters by tool or device. Cost and Tokens pages chart daily spending and input, output, cache, and thinking usage, and Models ranks every model by share. The Sessions table lists duration, tool count, and cost per session, and a detail view walks through each API call and the tools it triggered. Tool Calls shows which built-in, MCP, and skill actions agents use most, Projects ranks directories by spend, and Quotas tracks subscription limits. Optional sync through GitHub, S3, R2, or MinIO merges several machines, and a public leaderboard accepts aggregate totals only. Running on a dedicated VPS on RepoCloud with guaranteed CPU, RAM, and SSD, full root SSH access, and a browser serial console. MIT licensed.
Marketing Dashboard
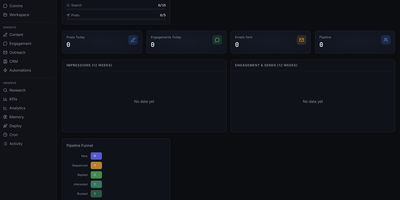
This is a marketing operations control center that replaces fragmented CRM, outreach, content, and analytics tools with a unified self-hosted interface designed for AI agent-assisted go-to-market teams. The CRM module manages leads through a configurable pipeline funnel with stages from New through Sequenced, Replied, Interested, and Booked, tracking source attribution, industry segments, company size, lead quality scores, and LinkedIn URLs per contact. Outreach sequencing supports email campaigns with pause controls, audit endpoints, suppression workflows, and engagement tracking. The content operations surface provides calendar views, content item management, performance metrics, and approval queues for editorial control. Analytics and KPI dashboards show impressions, engagement, and send volumes over configurable time periods, with optional connectors to Plausible, Google Analytics 4, X, and LinkedIn for cross-platform reporting. The OpenClaw-native agent runtime enables dynamic agent and squad discovery, workspace management, session monitoring, and communications surfaces. Automation scheduling uses cron job templates with OpenClaw-compatible schedule variants including cron expressions, every intervals, and at timestamps. The tech stack combines Next.js 16 App Router with React 19, Tailwind CSS 4, Recharts, and Zustand for state management. Authentication supports session cookies, API keys, and optional Google OAuth with role-based access controls. All state persists locally in SQLite via better-sqlite3 with no required external infrastructure. On RepoCloud, deploy Marketing Dashboard on a dedicated VPS with persistent SQLite storage, root SSH access, and complete control over your marketing operations data, all under the MIT license.
HitKeep
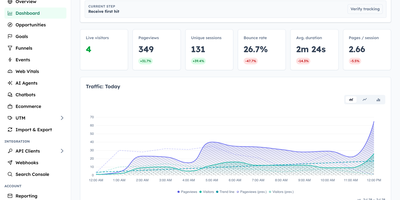
HitKeep is a sovereign web analytics platform that consolidates cookieless visitor telemetry, conversion funnels, e-commerce revenue reports, and AI engine visibility into a privacy-respecting dashboard that replaces Google Analytics and complex tracking clouds. Marketing teams can monitor inbound visitor journeys without installing intrusive consent banners or violating regional GDPR regulations. Custom conversion funnels and goal milestones track user registrations, checkout transactions, newsletter subscriptions, and software downloads with exact revenue attribution. Integrated Google Search Console synchronization brings organic search queries, keyword impression rankings, and click-through metrics directly alongside real-time pageview logs. A dedicated artificial intelligence visibility dashboard monitors crawling bots, retrieval citations, and direct referral visits originating from ChatGPT, Claude, Perplexity, and other generative search agents. Growth analysts can pose natural language questions to an embedded AI reporting assistant, generating instant cohort breakdowns and engagement trends without assembling complex manual filters. Site operators can configure custom tracking domains, whitelist reverse proxy networks, filter out referrer spam, and schedule automated database backups across persistent storage volumes. Complete data sovereignty controls allow teams to export raw event telemetry into open Parquet and CSV archives or stream metrics into external business intelligence warehouses via webhooks. Running on a dedicated VPS on RepoCloud with guaranteed CPU, RAM, and SSD, full root SSH access, and a browser serial console. MIT licensed.
LinkBreeze
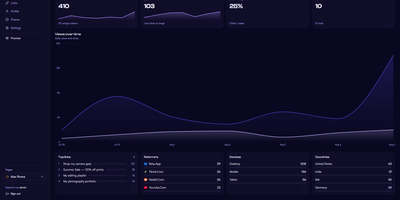
LinkBreeze is a self-hosted link-in-bio platform that lets you publish unlimited, fully themed link pages from your own server instead of renting one by the month. A guided setup wizard covers the admin credentials, profile, and theme, then a floating phone-frame preview refreshes as you edit while autosave stores your changes. Each page gets its own slug, theme, SEO tags, QR code, and analytics, so one install can serve a personal profile, a band, and a shop. Eleven built-in themes cover Aurora, Glassmorphism, Neon Cyberpunk, and Terminal Mono, backed by a token customizer for fonts, backgrounds, card styles, and raw CSS. Links pull in favicons automatically, accept thumbnails, and can be scheduled to appear and vanish on set dates, while embed widgets drop in YouTube, Spotify, SoundCloud, Vimeo, and Bandcamp players. A migration wizard imports profiles from Linktree, Bento, Hopp.bio, LittleLink, or an HTML or JSON export. Visitors can subscribe with an email address that you export to CSV, save your page as a vCard contact, or scan a QR code that downloads as SVG or PNG. Cookieless analytics track views, clicks, referrers, devices, and countries with hashed visitor IPs, and Plausible, Umami, Matomo, or Google Analytics can be added with one paste. The admin panel supports TOTP two-factor authentication, a UTM builder, JSON backup and restore, and seven interface languages. Running on a dedicated VPS on RepoCloud with guaranteed CPU, RAM, and SSD, full root SSH access, and a browser serial console. MIT licensed.
DAC
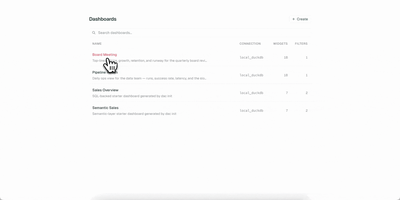
Your dashboards deserve version control, code review, and reproducible builds, just like the rest of your stack. DAC lets you define interactive data dashboards in YAML or TSX, validate them in CI, and serve them from a single Go binary that embeds a full React frontend. Choose from 21 chart types including line, bar, area, pie, scatter, bubble, funnel, sankey, heatmap, calendar, sparkline, waterfall, gauge, treemap, radar, and candlestick, plus metric cards, data tables, text blocks, and image widgets. The built-in semantic layer lets you define metrics and dimensions once in reusable model files, then reference them from any widget while DAC generates the SQL automatically. Connect to Postgres, MySQL, Snowflake, BigQuery, Redshift, Databricks, and DuckDB through standard Bruin connection configs. Interactive filters with date pickers, dropdowns, multiselects, and search inputs inject values via Jinja templating and re-execute only affected widgets. Live reload via Server-Sent Events refreshes connected browsers instantly when you save a file. Export dashboards as self-contained static HTML with baked-in query results for S3, GitHub Pages, or offline sharing, and render slide decks via the Google Slides export command. On RepoCloud, deploy DAC on a dedicated VPS with root SSH access and persistent storage for your dashboard definitions and database connections under the AGPL-3.0 license.
Immich Insights
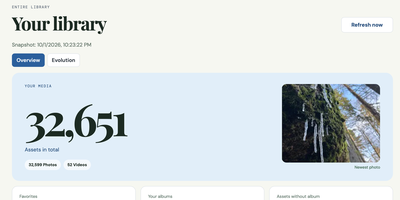
Immich Insights turns the photo library you already keep in Immich into a year-in-review style dashboard of how you actually shoot. Connect it with your own Immich API key and it reads your asset metadata into a local snapshot, without copying your original photos, then builds the overview Immich itself never shows: total photos and videos, storage used, favorites, albums, and your newest additions. Pick any year or a custom date range and see that period's shooting volume, favorites, albums, and devices. Camera statistics break your library down by device and manufacturer, with leaderboards you can correct when the same camera appears under different names. Exposure analysis shows your ISO, focal length, and shutter speed distributions, the focal lengths you reach for most, and how your settings shift by hour of day. Rhythm charts map your shooting by month, weekday, and hour, with a calendar heatmap of your most active days. A zoomable timeline marks the moments that matter: first photo, a new device joining the library, your longest gap, your busiest day ever. People and location views count faces and mapped places by country and continent, and a photography profile scores your habits. Clicking any chart value opens the matching photo thumbnails, and reports export as PDF, CSV, or JPG. Running on a dedicated VPS on RepoCloud with guaranteed CPU, RAM, and SSD, full root SSH access, and a browser serial console. MIT licensed.

LynxDB
LynxDB is a single-binary log analytics database that ingests logs once into indexed columnar storage, so you can query the same events repeatedly without re-reading raw files or standing up a JVM stack. Pipe kubectl output or local files straight into the LynxFlow query engine for ad hoc investigation, or run the persistent server and let shippers deliver logs through Elasticsearch bulk, OpenTelemetry OTLP, Splunk HEC, syslog, and raw HTTP ingest paths. LynxFlow pipelines parse JSON, regex, key-value, CSV, and other formats at read time, then extend fields, filter with typed predicates, aggregate with stats, join CTEs, and rank results, all in one explicit grammar with time-series helpers for buckets, percentiles, gap filling, and trend lines. Full-text search runs on an FST dictionary, roaring bitmap postings, and bloom filters that skip cold segments, and materialized views keep partial aggregates ready so dashboards rewrite onto rollups automatically. Convert Sigma detections into LynxFlow queries for security hunting, tail live results as new logs arrive, and tier older data out to S3. Individual analysts use it to dissect local application logs, and platform teams run it as a cluster for shared observability with the Web UI and REST API open to everyone. Running on a dedicated VPS on RepoCloud with guaranteed CPU, RAM, and SSD, full root SSH access, and a browser serial console. Apache-2.0 licensed.
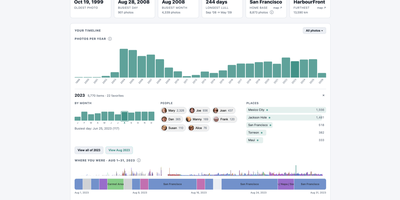
Pictaria Server
Pictaria Server sits beside your Immich instance and makes a photo library of thirty thousand images legible again, surfacing the trips, people, and best shots buried under duplicate bursts and forgotten folders. It starts with Insights: a clickable timeline of your years, detected trips, a people constellation linked by who appears together, place and camera rankings, and records like your busiest day. Click any number and you land on the actual photos, ready to open in Immich, turn into an album, or send onward. Enrich puts an AI to work describing what it sees, writing captions, menu-driven tags, and quality scores for every photo using a local model through Ollama or LM Studio, or a cloud provider with your own key, on a scheduled daily budget. Those tags can sync back into Immich, so searching improves everywhere, not just here. Curate then collapses bursts and near-duplicates into stacks with a suggested keeper, and one keystroke keeps the best and skips the rest. Smart Albums compose rules from people, places, dates, cameras, and tags, preview the result count, and maintain real Immich albums on a schedule. Frame owners get remote control, display metrics, and voice photo questions, while the Activity feed and runtime-editable Settings keep the whole box manageable from the browser. It connects with a limited-permissions API key and cannot delete a single photo. Running on a dedicated VPS on RepoCloud with guaranteed CPU, RAM, and SSD, full root SSH access, and a browser serial console. AGPL-3.0 licensed.
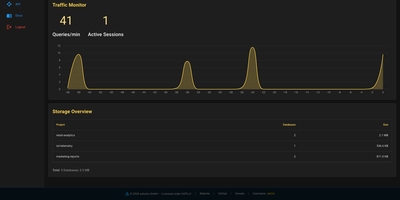
WebDuck
A DuckDB file is fast, but sharing one across a team usually means passing it around by hand. WebDuck puts DuckDB behind a server, so analysts and applications reach the same databases through a REST API or a dark amber web interface. Projects group databases, and each database can carry its own API password with read, write, or admin access levels. The dashboard shows server status, a live view of incoming REST traffic, and storage use. A browse view offers tree navigation, infinite scroll, and inline cell editing. The SQL editor runs multi-statement scripts, keeps a query history, accepts Alt+Enter to execute, and can load a whole SQL file. Import and export handle CSV, Parquet, and JSON up to 256 MB. Deleted databases move to a trash where they can be restored. Per-database write protection and a compression action keep files safe and small. Administrators sign in with bcrypt-hashed passwords and JWT tokens, and the interface ships in English and German. Setup comes through Docker, pip, or a YAML file, and a small command line initializes the server, adds users, and reports status. Running on a dedicated VPS on RepoCloud with guaranteed CPU, RAM, and SSD, full root SSH access, and a browser serial console. AGPL-3.0 licensed.
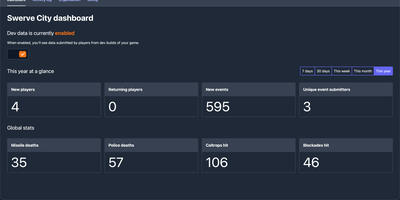
Talo
Shipping a game is hard enough without also building account systems, and Talo is the self-hosted backend that gives your Godot or Unity title player authentication, leaderboards, cloud saves, and analytics on infrastructure you control. Players persist across sessions with segments you define, so you can group testers, whales, or speedrunners and treat each group differently. Leaderboards sort ascending or descending, refresh on daily or weekly schedules, hide suspicious entries from the dashboard, and sync with Steamworks in one click. Event tracking records individual and global player actions, and the dashboard turns that stream into charts you can filter by group when a balance patch lands badly. Game saves load and store flexible state that also works offline, while global and per-player stats track everything from completions to currency earned. Live config lets you tune game settings from the web and push changes to running games with zero downtime. Channels carry real-time messages between subscribed players, presence shows who is online with custom statuses, and relationships add friends and followers when your game grows social. Steamworks, Google Play Games, and Apple Game Center integrations verify ownership and authenticate players through the platforms they already use. Running on a dedicated VPS on RepoCloud with guaranteed CPU, RAM, and SSD, full root SSH access, and a browser serial console. MIT licensed.
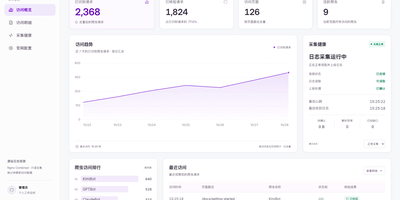
Geo-Monitor
Search is being answered by AI crawlers first and humans second, yet most site owners cannot name a single bot that read their pages last week; Geo-Monitor answers that from the access logs you already have. A small collector sits beside Nginx or OpenResty, mounts the log read-only, and streams only new lines in batches, resuming after outages and surviving log rotation without ever touching your site's code. The console separates today, the last week, and the last month into identified requests, crawled pages, active crawlers, and trend lines, then drills into every visit with time, path, method, status code, claimed identity, and verification state. Identification and verification are deliberately different things here: a user agent only proves what a request claims to be, while a verified badge requires trusted log addresses and official IP evidence to agree. Twenty built-in identities cover OpenAI, Anthropic, Perplexity, Kimi, and Bytespider crawlers, and you can add, edit, or disable rules as new bots appear. Your sitemap syncs or imports as the content catalog, so coverage views show which pages crawlers actually reached, and collector health exposes heartbeat, backlog, and parsing problems. Running on a dedicated VPS on RepoCloud with guaranteed CPU, RAM, and SSD, full root SSH access, and a browser serial console. Apache-2.0 licensed.
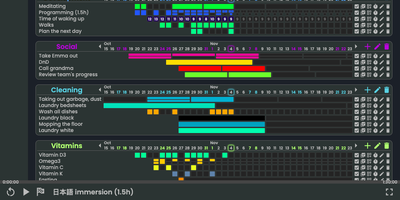
Neohabit
Most habit trackers punish a single missed day, so Neohabit lets you build routines that happen X times in Y days, like three workouts in five days or one deep-work session every three days, and adjust the target mid-streak as the habit gets easier. Your progress renders as GitHub-style contribution heatmaps in three styles: monochromatic grids for simple check-ins, numeric grids that record values such as calories, spending, reps, or hours up to two billion, and fractured grids that split each period into up to sixteen segments for habits done many times a day. Related habits group into projects with a one-dimensional daily view, and skill trees let you plan progressions, for example raising a reading target from twenty minutes to an hour in planned steps. You can ease into a new routine by starting at once in four days instead of daily, track things you want to reduce as well as build, hover any cell for period details, and rearrange projects and habits by dragging them. Multiple accounts, light and dark themes, keyboard shortcuts, and a polished mobile browser interface round out daily use, and a single command brings the whole thing up with prebuilt images ready to go. Running on a dedicated VPS on RepoCloud with guaranteed CPU, RAM, and SSD, full root SSH access, and a browser serial console. AGPL-3.0 licensed.