Stars
Forks
Watchers
Developer links
Tianji
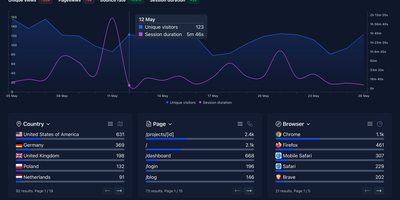
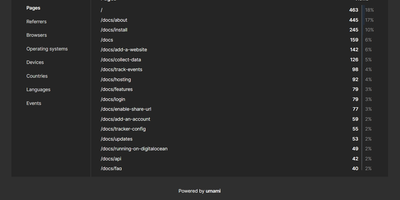
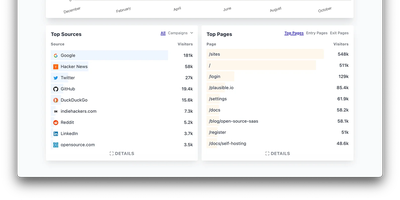
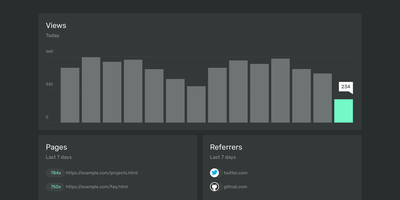
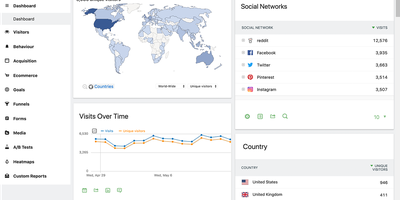
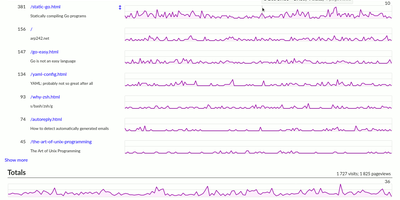
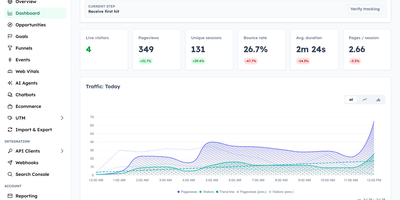
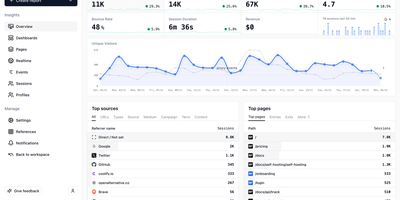
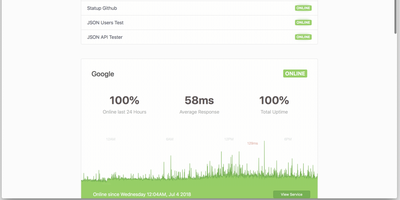
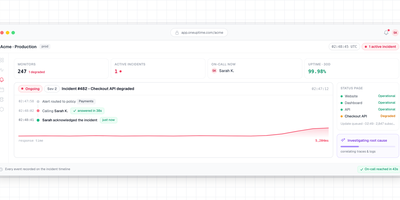
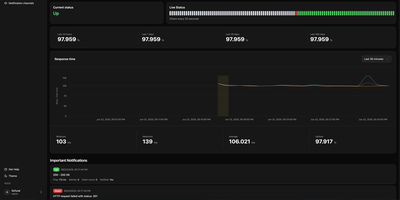
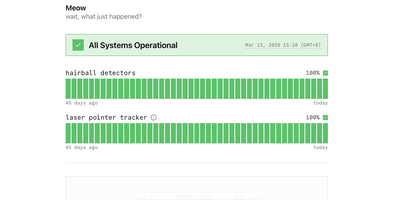
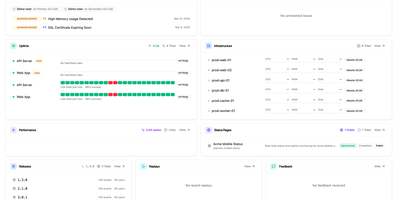
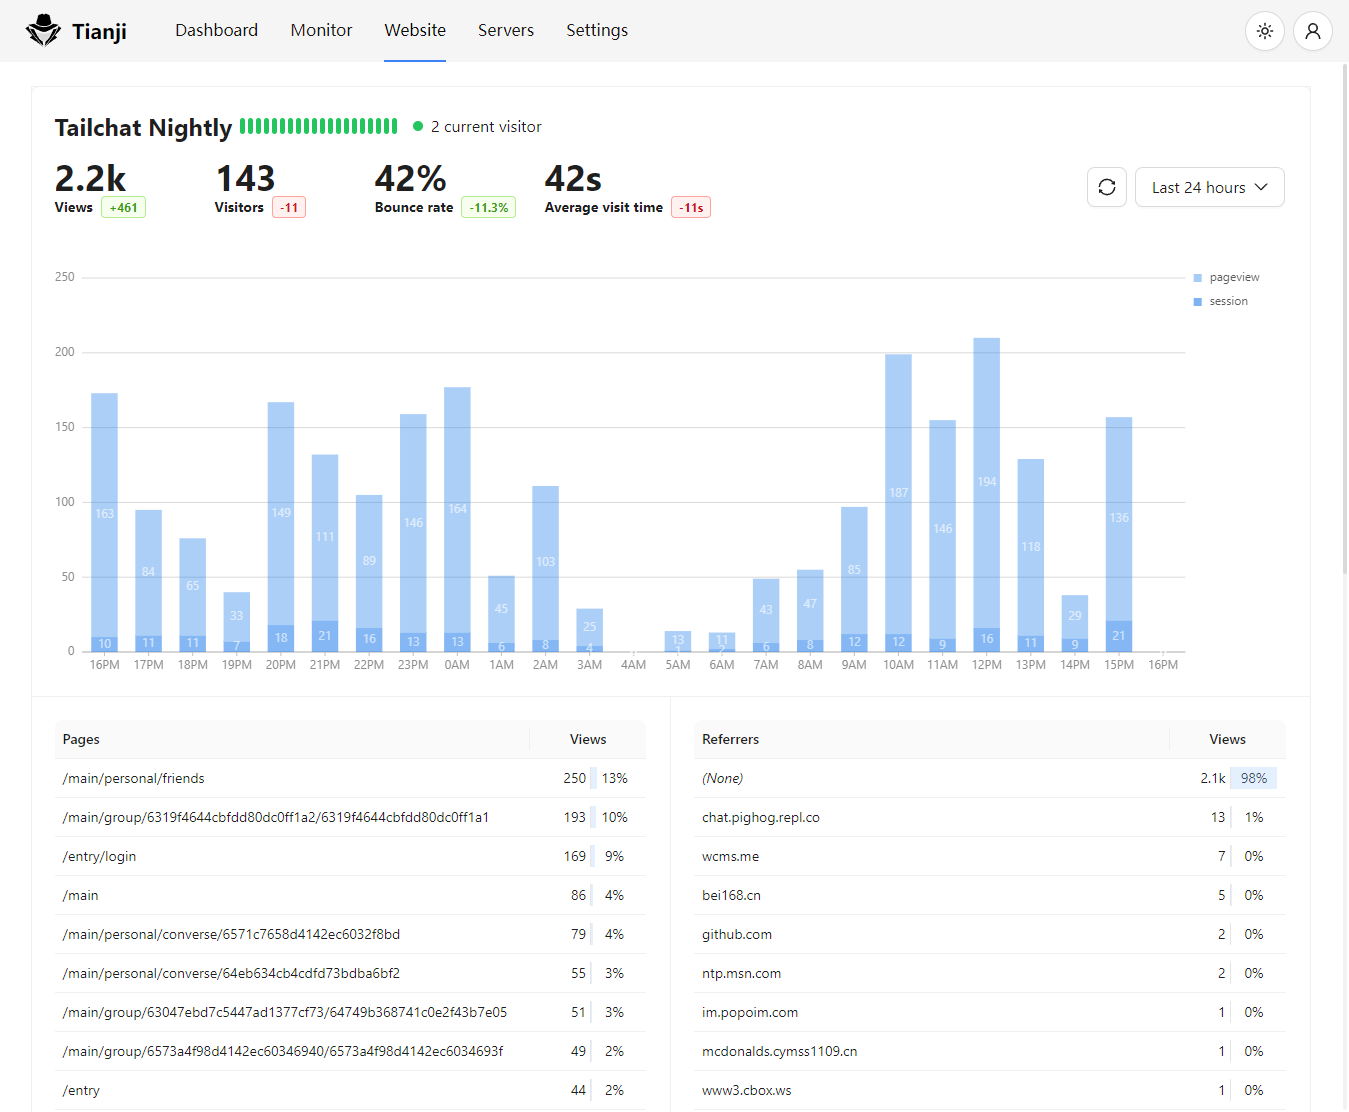
Website analytics, uptime monitoring, and server status - three tools most teams run separately - combined in Tianji, an open-source observability platform. The analytics layer tracks page views, unique visitors, referrers, and UTM parameters with a lightweight cookie-less script, which keeps collection GDPR and CCPA friendly. The uptime monitor checks availability and latency on configurable intervals, accepts passively reported results, and publishes public status pages for incident communication. Server status agents report CPU, memory, disk, and network metrics with threshold-based alerts, and notifications route through webhooks, Slack, Telegram, and other channels with noise control. It also includes anonymous telemetry for tracking deployments of your own open-source projects, surveys, waitlists, team collaboration, and an OpenAPI interface for integrations and exports. The consolidation is the point: traffic analytics, uptime checks, and server metrics share one interface and one alerting layer, so diagnosing an incident does not mean hopping between Google Analytics, Uptime Kuma, and Prometheus - and the built-in public status pages replace a separate paid Statuspage-style subscription. Because collection uses no cookies with IP truncation and aggregation by default, basic traffic measurement requires no consent banner. Built in TypeScript under the Apache 2.0 license and inspired by Umami and Uptime Kuma, it is deliberately right-sized for independent developers and small SaaS teams whose monitoring needs are real but lightweight.
Benefits
- Three Tools Collapsed Into One
- Traffic analytics, uptime checks, and server metrics share one interface and one alerting layer, so diagnosing an incident does not mean hopping between GA, Uptime Kuma, and Prometheus.
- Cookie-Less, Compliant Analytics
- No cookies, IP truncation, and data aggregation by default mean no consent banner is required for basic traffic measurement, and visitor data never reaches a third party.
- Status Pages Without Another Subscription
- Public status pages with real-time uptime and incident reporting are built in, replacing a separate paid Statuspage-style service.
- Right-Sized for Small Teams
- Deliberately lightweight features cover what independent developers and small SaaS teams actually check daily, without the operational weight of a full enterprise monitoring stack.
Features
- Website Analytics
- Page views, unique visitors, referrers, traffic sources, and UTM campaign tracking collected by a small cookie-less script.
- Uptime Monitoring
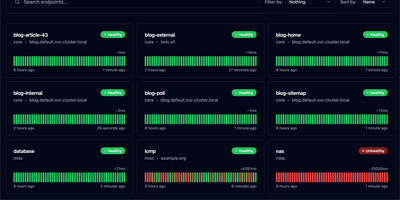
- Active checks on custom intervals plus passive result reception, tracking availability, latency, and errors across your endpoints.
- Server Status Agents
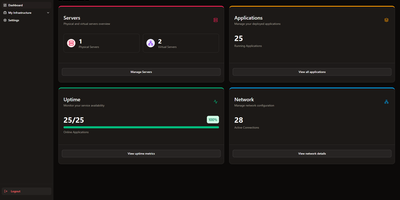
- Report CPU, memory, disk, and network usage from your servers into dashboards with configurable alert thresholds.
- Public Status Pages
- Customer-facing pages showing real-time service health and incidents, hosted directly from your instance.
- Alerting Channels
- Route problem notifications to webhooks, Slack, Telegram, and other channels with noise control.
- Telemetry, Surveys, and OpenAPI
- Collect anonymous deployment telemetry for your own open-source projects, run surveys and waitlists, and integrate everything through a documented OpenAPI interface with team collaboration support.