OpenStatus screenshot thumbnail

OpenStatus

Trusted by Cal.com, WhiteBIT, and Documenso and backed by 8,800+ GitHub stars, OpenStatus delivers the open-source status page and uptime monitoring platform that replaces Atlassian Statuspage, Better Stack, and Instatus with a single self-hosted deployment. The monitoring engine runs Go-based probes across 28 global regions on three cloud providers checking HTTP, TCP, and DNS endpoints in parallel with configurable intervals and multi-region consensus to eliminate false-positive alerts. Status pages ship with custom domain support, password and email-domain access controls, maintenance windows, grouped monitor components, and subscriber notifications via email and RSS. Incident management provides structured status reports with investigating, identified, monitoring, and resolved timeline phases that publish automatically to affected status pages. The monitoring-as-code workflow supports YAML configuration synced through the CLI, a GitHub Actions integration for CI/CD pipelines, and a Terraform provider for infrastructure-as-code deployments. The typed ConnectRPC JSON-over-HTTP API exposes a published OpenAPI specification with a Node SDK for programmatic access, while an MCP server connects AI assistants like Claude, ChatGPT, and Cursor directly to workspace data. The tech stack combines Next.js with shadcn/ui for the dashboard, Hono for the API server, Drizzle ORM over Turso for application data, and Tinybird for analytics. Private monitoring locations deploy as a single 8.5MB Docker image behind firewalls to check internal services. Running on a dedicated VPS on RepoCloud with guaranteed CPU, RAM, and SSD, full root SSH access, and a browser serial console. AGPL-3.0 licensed.

Deploy
Maintenant screenshot thumbnail

Maintenant

Maintenant replaces three to five separate monitoring tools with a single Go binary that consolidates container discovery, endpoint monitoring, SSL tracking, resource metrics, and public status pages without requiring any external database. The embedded Vue 3 frontend serves on port 8080 immediately after deployment, auto-discovering Docker containers and Kubernetes pods through direct socket and API access without configuration. HTTP and TCP endpoint monitoring validates availability with configurable intervals, while TLS certificate tracking alerts before expiration across all monitored domains. Resource metrics collect CPU, RAM, network throughput, and disk usage per container with real-time Server-Sent Events streaming to the dashboard. Heartbeat and cron monitoring accepts pings from external scheduled jobs, triggering alerts on missed check-ins via webhook callbacks and Discord notifications. The built-in alert engine supports escalation rules and notification batching. Public status pages expose component health to end users without authentication, customizable per monitored service. Network security insights analyze exposed ports, container privilege levels, and host configuration to produce a posture score. Update intelligence scans OCI registries to detect available container image updates with digest comparison. The REST API with SSE broker enables automation, and the integrated MCP server provides tooling for AI assistant integration. SQLite in WAL mode stores all data with zero operational overhead. Running on a dedicated VPS on RepoCloud with guaranteed CPU, RAM, and SSD, full root SSH access, and a browser serial console. AGPL-3.0 licensed.

Deploy
Tianji screenshot thumbnail

Tianji

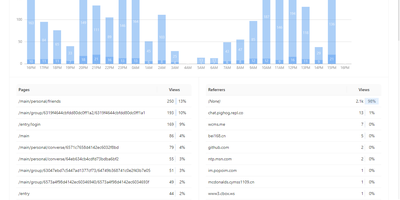
Website analytics, uptime monitoring, and server status - three tools most teams run separately - combined in Tianji, an open-source observability platform. The analytics layer tracks page views, unique visitors, referrers, and UTM parameters with a lightweight cookie-less script, which keeps collection GDPR and CCPA friendly. The uptime monitor checks availability and latency on configurable intervals, accepts passively reported results, and publishes public status pages for incident communication. Server status agents report CPU, memory, disk, and network metrics with threshold-based alerts, and notifications route through webhooks, Slack, Telegram, and other channels with noise control. It also includes anonymous telemetry for tracking deployments of your own open-source projects, surveys, waitlists, team collaboration, and an OpenAPI interface for integrations and exports. The consolidation is the point: traffic analytics, uptime checks, and server metrics share one interface and one alerting layer, so diagnosing an incident does not mean hopping between Google Analytics, Uptime Kuma, and Prometheus - and the built-in public status pages replace a separate paid Statuspage-style subscription. Because collection uses no cookies with IP truncation and aggregation by default, basic traffic measurement requires no consent banner. Built in TypeScript under the Apache 2.0 license and inspired by Umami and Uptime Kuma, it is deliberately right-sized for independent developers and small SaaS teams whose monitoring needs are real but lightweight.
Deploy
Statping-ng screenshot thumbnail

Statping-ng

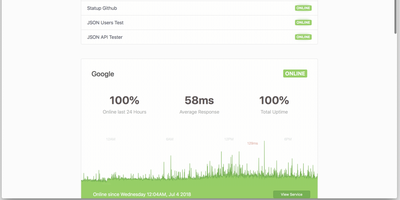
A status page and uptime monitor in one Go binary: Statping-ng - the actively maintained fork of Statping - replaces the UptimeRobot-plus-Statuspage combo with a ~20 MB Docker image using under 50 MB of RAM. It checks services over HTTP, TCP, UDP, ICMP ping, and gRPC health checks on configurable intervals, with per-service timeouts, expected status codes, POST requests with custom JSON bodies, SSL verification, and failure thresholds before alerting. The public status page is the differentiator against plain monitors: visitors see live status, uptime percentages, and latency charts grouped into service categories, with incident announcements and scheduled-maintenance messages you publish from the dashboard - and Sass-based custom styling matches the page to your brand rather than a vendor template. When something fails, notifiers fire immediately: Slack, Discord, Telegram, SMTP email, PagerDuty, Twilio SMS, Pushover, and custom webhooks, each testable before saving. Because notifiers are single Go files, the plugin system makes new channels straightforward. A RESTful API manages services and reads uptime data programmatically, and the free Statping mobile app connects to your server via QR code for on-the-go monitoring. Data persists to SQLite, MySQL, or PostgreSQL. Point it at internal services too - anything the container can reach is monitorable.

Deploy
Kener screenshot thumbnail

Kener

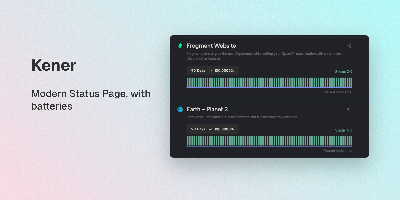
A polished public status page without Statuspage prices or a heavyweight observability suite: Kener is a status and uptime monitoring system built with SvelteKit and Node.js. It runs 11 monitor types - API, Ping, TCP, DNS, SSL certificate, SQL query, Heartbeat, gRPC, and GameDig game-server checks among them - each with configurable intervals and thresholds. Incident management covers the full lifecycle: structured timelines from investigation through resolution, acknowledgements, and subscriber-visible updates, plus maintenance windows with RRULE-based recurring schedules and automatic status transitions. Notifications reach email, Slack, Discord, and custom webhooks through trigger-based workflows with template-driven messaging. One instance can serve multiple branded status pages - per product, team, or region - with custom logos, colors, and CSS, localization into 21 languages, timezone-aware displays, and server-rendered pages that stay fast and SEO-friendly. Operations tooling includes role-based access for teams, API key management, a secrets vault, analytics integrations (Google Analytics, Plausible, Umami, and others), and a REST API with 17+ endpoints for automating incidents and monitors from CI/CD. MIT-licensed; Docker deployment with Redis, SQLite by default, PostgreSQL or MySQL for production.
Deploy
Vigil screenshot thumbnail

Vigil

Vigil monitors your entire distributed infrastructure and generates a public status page from a single Rust binary small enough to run on a Raspberry Pi, consuming minimal CPU and memory while providing crash-free reliability. Four distinct monitoring modes cover every topology: poll probes check HTTP, TCP, SSH, and ICMP endpoints for reachability with configurable intervals and thresholds; push probes receive health reports from Vigil Reporter libraries embedded in your application code across Node.js, Python, Golang, Rust, TypeScript, Dart, and C#; local probes delegate monitoring to Vigil Local slave daemons running behind firewalls on separate LANs; and script probes execute custom shell commands for specialized health checks. Each monitored service transitions through healthy, sick, and dead states based on consecutive probe failures, with configurable thresholds controlling state transition sensitivity. When services change state, Vigil dispatches notifications through twelve alert channels including Slack, Email, Twilio SMS, Telegram, Pushover, Gotify, XMPP, Matrix, Zulip, Cisco Webex, and generic webhooks. The generated status page displays service groups organized by category with real-time replica status, system load metrics from reporter probes, and a maintenance announcement system for communicating planned downtime through the Manager HTTP API. Configuration uses a single TOML file defining all probes, services, and notification channels with no database dependency. Docker deployment pulls the official image with volume-mounted configuration. Running on a dedicated VPS on RepoCloud with guaranteed CPU, RAM, and SSD, full root SSH access, and a browser serial console. MPL-2.0 licensed.

Deploy
Moneat screenshot thumbnail

Moneat

Moneat is the open-source observability platform that unifies error tracking, session replay, performance monitoring, logging, uptime checks, synthetics, product analytics, and AI observability into a single self-hosted application — replacing Sentry, Datadog, and Statuspage with one deployment. The Sentry SDK compatibility layer accepts data from @sentry/browser, @sentry/node, @sentry/react, @sentry/nextjs, sentry-sdk for Python, sentry-kotlin, sentry-java, sentry-android, sentry-cocoa, sentry-go, sentry-ruby, and Sentry.NET by updating one DSN endpoint. Datadog Agent compatibility redirects existing fleets by setting dd_url, and native OpenTelemetry OTLP ingestion accepts logs, traces, and metrics from any exporter or Collector. Error monitoring groups exceptions with smart deduplication, session replay records DOM-based user interactions linked to errors, distributed tracing visualizes transaction and span breakdowns with live service maps, and continuous profiling renders flamegraphs in pprof, JFR, and Sentry formats. Uptime monitoring runs HTTP, TCP, and ping checks with public status pages, while synthetics executes API tests, multi-step workflows, SSL checks, and DNS probes. Custom dashboards support drag-and-drop widgets with Grafana import, product analytics provides funnels and retention cohorts, release tracking surfaces crash-free rates with source map upload, and AI observability traces LLM calls end to end. Built on Kotlin and Java with ClickHouse for analytical storage, PostgreSQL for relational data, and Redis for caching, deployment uses Docker Compose with an interactive installer automating secrets and service orchestration. Running on a dedicated VPS on RepoCloud with guaranteed CPU, RAM, and SSD, full root SSH access, and a browser serial console. AGPL-3.0 licensed.

Deploy