Netdata
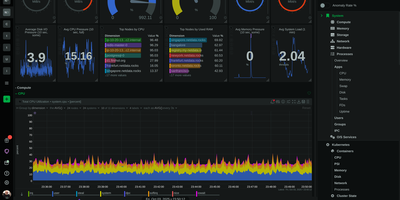
Trusted by millions of engineers and deployed on over 80,000 GitHub stars worth of community confidence, Netdata delivers true real-time monitoring at per-second granularity — 10-60x faster than Prometheus, Datadog, or any conventional monitoring stack that averages away the transient anomalies lasting 2-10 seconds where most production incidents originate. A single installation command deploys the agent with zero configuration, automatically discovering every running process, container, systemd service, network connection, disk, and application on the host within seconds. Unsupervised machine learning trains multiple models per metric directly at the edge, detecting anomalies without thresholds, baselines, or manual tuning. The distributed Parent-Child architecture scales horizontally from a single Raspberry Pi to fleets exceeding 100,000 nodes while maintaining sub-2-second visualization latency and storing metrics at approximately 0.5 bytes per sample through tiered compression. Native network monitoring provides live topology maps, NetFlow and sFlow analytics, SNMP device polling across 200+ profiles, and trap handling — capabilities that typically require a separate NPM product. Hundreds of pre-configured alerts cover systems and applications out of the box, with AI-powered root cause analysis surfacing correlated metrics through natural language via MCP-compatible AI assistants. The agent supports Linux, macOS, FreeBSD, Kubernetes, and Docker with eBPF-based kernel observability requiring no application instrumentation. Running on a dedicated VPS on RepoCloud with guaranteed CPU, RAM, and SSD, full root SSH access, and a browser serial console. GPL v3+ licensed.
Jaeger
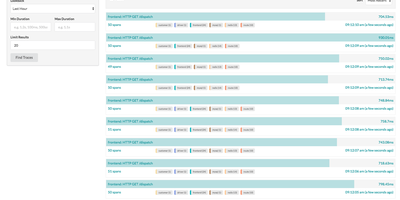
Created by Uber Technologies and graduated as the seventh CNCF top-level project in October 2019 with over 23,000 GitHub stars, Jaeger has become one of the most widely deployed open-source distributed tracing platforms, processing billions of spans per day in production environments at organizations including Uber, Red Hat, and Shopify. Version 2 rebuilt the platform on the OpenTelemetry Collector framework, inheriting its extensible pipeline architecture while implementing Jaeger-specific features as extensions and components, enabling seamless integration with the OpenTelemetry ecosystem through native OTLP protocol support. The platform stores traces in Cassandra 4.0+, Elasticsearch 7.x/8.x, OpenSearch 1.0+, ClickHouse, or the embedded Badger database for development setups. Three sampling strategies control trace volume: head-based sampling with constant, probabilistic, and rate-limiting modes, tail-based sampling using the OpenTelemetry Collector processor that evaluates complete traces before storage decisions, and adaptive sampling that dynamically adjusts probabilities based on observed traffic patterns. Service Performance Monitoring computes RED metrics directly from spans, displaying request rates, error rates, and latency percentiles in the Monitor tab with drill-down from aggregate service views to individual traces. The web UI provides trace search with multi-field filtering, trace detail views with span timeline visualization, trace comparison across services, and dependency graphs mapping service relationships from actual traffic. Deployment options range from a single all-in-one binary for development to distributed collector-ingester-query configurations with Kafka intermediate buffering for production scale. Running on a dedicated VPS on RepoCloud with guaranteed CPU, RAM, and SSD, full root SSH access, and a browser serial console. Apache 2.0 licensed.

Grafana
The de facto dashboard of observability: Grafana is the open-source frontend that turns the data stores you already run into interactive graphs. It does not store metrics itself; it connects to the data stores you already run and turns their contents into interactive dashboards. Supported sources number over 150 via plugins: Prometheus, Loki, Tempo, InfluxDB, Elasticsearch, MySQL, PostgreSQL, Microsoft SQL Server, AWS CloudWatch, Azure Monitor, Google Cloud Monitoring, and many more. Dashboards are built from a large library of panel types (time series, heatmaps, tables, gauges, logs) with template variables for reusable, parameterized views. Unified alerting evaluates rules against any connected data source, not just Prometheus, and routes notifications to Slack, PagerDuty, email, and other channels with grouping and silencing - unlike Prometheus Alertmanager, a single rule can combine a Loki log pattern, a PostgreSQL query result, and a CloudWatch metric. Dashboards serialize to JSON and data sources configure via provisioning files, so the entire observability setup can live in Git and deploy repeatably across environments. Explore mode adds ad-hoc querying outside dashboards, with split view for correlating a metric spike against the matching log lines, and access control spans organizations, teams, folder permissions, and OAuth, LDAP, and SAML integration. Written in Go and TypeScript, AGPL-licensed. Self-hosting gives you unlimited users, dashboards, and queries at flat hosting cost, without Grafana Cloud's usage-based pricing.
Coroot
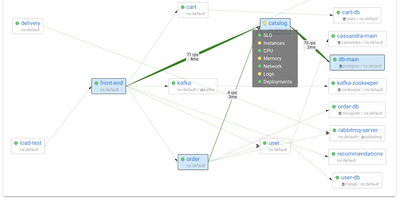
Coroot uses eBPF to capture metrics, distributed traces, logs, and continuous CPU profiles directly from the Linux kernel, delivering full observability without any application code changes, SDKs, or sidecars. From the first minute of deployment, an automatically generated service map covers every microservice, database, message queue, and external dependency with request rate, error rate, and latency measurements. When a service breaches its SLO, AI-powered inspections analyze telemetry across all dimensions to pinpoint the root cause and send a single consolidated alert with findings, replacing the flood of fragmented notifications typical of traditional monitoring. Deployment tracking automatically discovers Kubernetes rollouts and compares each release against the previous one to detect performance regressions, resource spikes, and cost impacts without CI/CD pipeline integration. Continuous profiling captures CPU flame graphs down to the line of code with negligible overhead. Integrated cost monitoring tracks cloud spending across AWS, GCP, and Azure, attributing expenses to individual services and deployments. Coroot supports Prometheus, OpenTelemetry, and ClickHouse as data sources and works identically on Kubernetes clusters, virtual machines, and bare-metal hosts. 7,700+ GitHub stars. Apache-2.0 licensed.

RocketplaneIO
RocketplaneIO is a self-hosted AI SRE platform that gives Kubernetes clusters zero-instrumentation eBPF observability plus a copilot capable of safely diagnosing and fixing issues without your telemetry ever leaving your infrastructure. Point it at any cluster, and an eBPF DaemonSet starts capturing HTTP, gRPC, SQL, Redis, and Kafka spans across every service, including compiled binaries, with cross-service context propagation and no code changes required. The live service map draws itself from actual network traffic, matching technology logos from container images and coloring each node's health from RED metrics. Every log line sits two clicks from its parent distributed trace, and a PromQL query engine, embedded from the real Prometheus evaluator, runs over ClickHouse for long-term metric retention. The complete Kubernetes inventory (Services, Ingress, ConfigMaps, network policies, persistent volumes, CRDs) syncs continuously and is searchable alongside traces and logs. When the copilot identifies a problem, it picks from a catalog of roughly 30 risk-classified safe actions; each action verifies its preconditions, captures a before-state snapshot, executes, checks the result, and rolls back automatically on failure. Disruptive operations pause for explicit human approval before proceeding. An MCP endpoint exposes the identical guardrailed toolbox to external AI agents, so Claude Code or Cursor can operate the cluster through the same safety boundary the browser copilot uses. Complex remediations compose as searchable, forkable Starlark workflows that compile deterministically at save. Running on a dedicated VPS on RepoCloud with guaranteed CPU, RAM, and SSD, full root SSH access, and a browser serial console. Apache-2.0 licensed.