Metabase screenshot thumbnail

Metabase

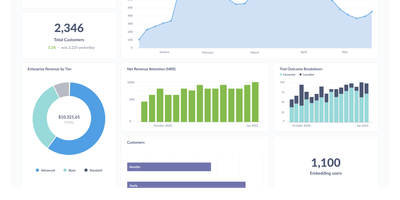
The most widely deployed open-source BI tool, Metabase is a visualization and query layer that sits on top of your existing databases without ingesting or copying data. Non-technical users ask questions through a visual query builder with drill-through menus that answer follow-ups like "broken down by month" without writing a new query, while analysts use the native SQL editor with variables and templates for complex work. Questions assemble into interactive dashboards with filters, auto-refresh, fullscreen mode, and custom click behavior, and dashboard subscriptions email or Slack scheduled reports to stakeholders. It connects to 20+ data sources including PostgreSQL, MySQL, MongoDB, SQL Server, BigQuery, Snowflake, Redshift, and ClickHouse - always querying in place, so there is no second data store to secure, sync, or pay for, and results are always current. Models and metrics let a data team define official, reusable starting points so self-service stays consistent, collections with permissions organize content, and alerts fire when a metric crosses a threshold. The practical effect is cutting the ad-hoc query queue that lands on the data team, since non-technical staff can answer their own questions. Written in Clojure, licensed AGPL, and shipped as a single JAR or Docker image with an embedded application database - a working BI instance runs before most tools finish their installer - the open-source edition has no limits on users, dashboards, or connected databases, where commercial BI platforms price per viewer as well as per creator.
Deploy
Redash screenshot thumbnail

Redash

Used by millions of users at thousands of organizations worldwide and holding 29,000+ GitHub stars, Redash is the most established open-source SQL-first business intelligence tool — enabling anyone from analysts to executives to query databases, visualize results, and share dashboards without writing a single line of application code. The browser-based query editor supports SQL and NoSQL with schema browsing, auto-complete, query snippets, and parameterized queries that turn static reports into interactive data applications. Native connectors span 35+ data sources including PostgreSQL, MySQL, Amazon Redshift, Google BigQuery, Snowflake, ClickHouse, MongoDB, Elasticsearch, Databricks, Apache Presto, Microsoft SQL Server, and REST APIs — with an extensible data source API for custom integrations. Visualization types cover line, bar, area, pie, scatter, box plot, funnel, cohort, sankey, sunburst, choropleth map, and pivot tables, all draggable onto shared dashboards with cross-filtering parameters. Scheduled refreshes automatically update query results at configurable intervals, while threshold-based alerts notify teams via email, Slack, or webhook when metrics cross defined boundaries. SAML and Google OAuth SSO integration, role-based access control, API key management, and query-level permissions ensure enterprise-grade security for sensitive datasets. The self-hosted stack deploys via Docker Compose with PostgreSQL for metadata storage, Redis for job queuing, and Celery workers for background task execution. Running on a dedicated VPS on RepoCloud with guaranteed CPU, RAM, and SSD, full root SSH access, and a browser serial console. BSD 2-Clause licensed.

Deploy
Countly screenshot thumbnail

Countly

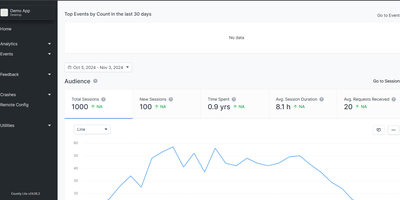
Mixpanel, OneSignal, and Crashlytics in one self-hosted stack - Countly is an all-in-one product analytics and engagement platform where every byte of first-party data stays on your server. A Node.js application over MongoDB, it collects through ten battle-tested SDKs spanning iOS, Android, web JavaScript, React Native, Flutter, Unity, and desktop (plus a data write API for anything else), and has powered tens of thousands of mobile, web, and desktop apps since 2012. The analytics core covers sessions, custom events, views, user profiles, and real-time dashboards, with exploration tools built for product managers as much as analysts. What separates Countly from pure analytics tools is acting on the data without third parties: built-in push notifications send automated, transactional, and personalized messages to iOS (APNs), Android (Firebase), and Huawei devices, with the SDK handling token retrieval and permission flows automatically; crash reporting captures symbolicated native crashes on iOS and Android plus JavaScript errors, correlated with the same user and session data. Email reports keep stakeholders updated, and the plugin-based architecture means features load as modules. For GDPR-sensitive products, engagement without piping user data to advertising companies is the entire point. AGPL-licensed server, installable in minutes.

Deploy
Chartbrew screenshot thumbnail

Chartbrew

Chartbrew transforms raw database queries and API responses into polished, shareable dashboards without requiring a data engineering team. Connect to MySQL, PostgreSQL, MongoDB, Firestore, or any REST API, then build datasets using the visual query editor with syntax highlighting and auto-completion. Charts render through Chart.js with line, bar, pie, donut, radar, polar, KPI card, and table visualizations, each customizable with colors, legends, filters, and goal indicators. An AI assistant accelerates dashboard creation by generating queries and suggesting chart configurations from natural language descriptions of the metrics you want to track. Reusable datasets let teams prepare data transformations once and share them across multiple charts, while automatic scheduling through BullMQ and Redis refreshes data at intervals from every 10 minutes to monthly. The embed feature generates standalone chart URLs for insertion into external websites, internal tools, or customer portals, and the Reporting API enables programmatic dashboard management and automated report delivery. Team workspaces with role-based permissions control who can view, edit, or manage data connections. Nearly 4,000 GitHub stars reflect steady community adoption. The platform runs on Node.js with Express and Sequelize ORM, supporting MySQL or PostgreSQL as its application database. Running on a dedicated VPS on RepoCloud with guaranteed CPU, RAM, and SSD, full root SSH access, and a browser serial console. FSL-1.1-MIT licensed (converts to MIT two years after each release).

Deploy
Frappe Insights screenshot thumbnail

Frappe Insights

Frappe Insights delivers a self-hosted business intelligence platform where non-technical users build complex analytical queries without writing SQL. The visual query builder uses Ibis under the hood to compose optimized SQL from drag-and-drop column selections, filters, aggregations, and group-by operations — translating point-and-click interactions into performant database queries across MySQL, PostgreSQL, DuckDB, and BigQuery. The join editor provides a graphical interface for defining multi-table relationships, letting analysts connect data across schemas without understanding foreign keys or join types. The chart builder renders interactive visualizations using Apache eCharts with support for bar, line, area, pie, scatter, funnel, and pivot table chart types — each configurable with axes, colors, legends, and formatting options. Dashboards combine multiple charts into shareable views with layout customization, auto-refresh intervals, and filter propagation across widgets. Data source management handles connection pooling across multiple databases simultaneously, enabling cross-database analysis in single queries. Server scripts extend query capabilities with custom Python transformations for complex business logic that visual tools cannot express. Built on the Frappe Framework's full-stack architecture, deployment uses Docker via the official easy-install script that provisions the complete stack including MariaDB, Redis, and Nginx. Running on a dedicated VPS on RepoCloud with guaranteed CPU, RAM, and SSD, full root SSH access, and a browser serial console. AGPL-3.0 licensed.

Deploy
SerpBear screenshot thumbnail

SerpBear

Unlimited domains, unlimited keywords, daily Google position checks with stored history and trend charts: SerpBear is an open-source search engine rank tracker. Retrieval works through your choice of third-party SERP APIs - ScrapingAnt, ScrapingRobot, SerpApi, SearchApi, HasData - or your own proxy IP pool, and a flexible scrape-strategy system (Basic, Custom, or Smart, set globally or per domain) works around Google's removal of the 100-results-per-page parameter by choosing how many pages to check per keyword. Google Search Console integration adds real visit counts, impressions, and click-through rates per tracked keyword and surfaces top-performing pages and countries; Google Ads integration supplies monthly search volumes and auto-generates keyword ideas from your site's content. Email notifications report position changes daily, weekly, or monthly, a built-in REST API feeds dashboards and reporting tools, and data exports to CSV. Built with Next.js on SQLite, deployed via Docker, installable as a PWA on mobile - with no per-keyword or monthly SaaS fees.
Deploy