Categories
Self-Hosted Open Source Error Tracking Session Replay Crash Reporting Mobile Monitoring App Performance ANR DetectionStars
Forks
Watchers
Developer links
Measure
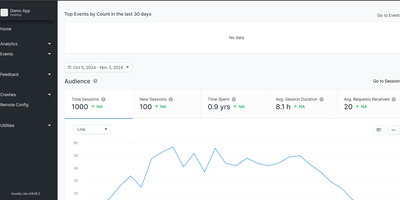
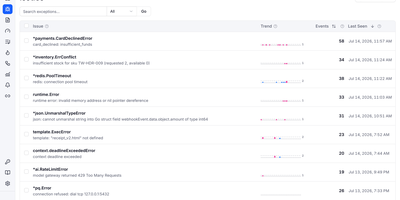
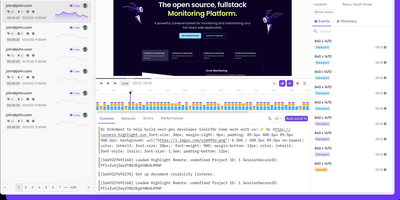
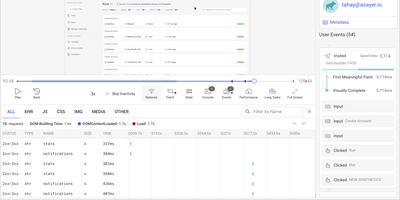
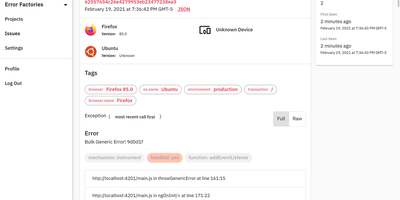
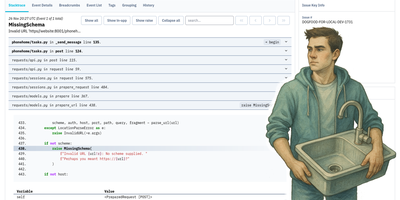
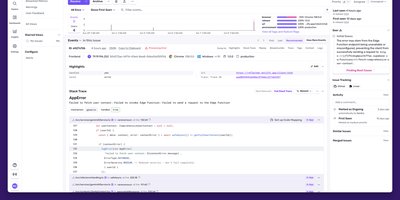
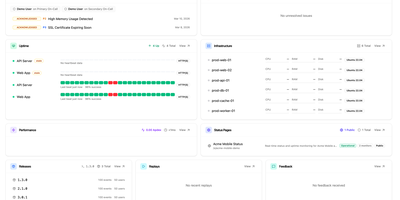
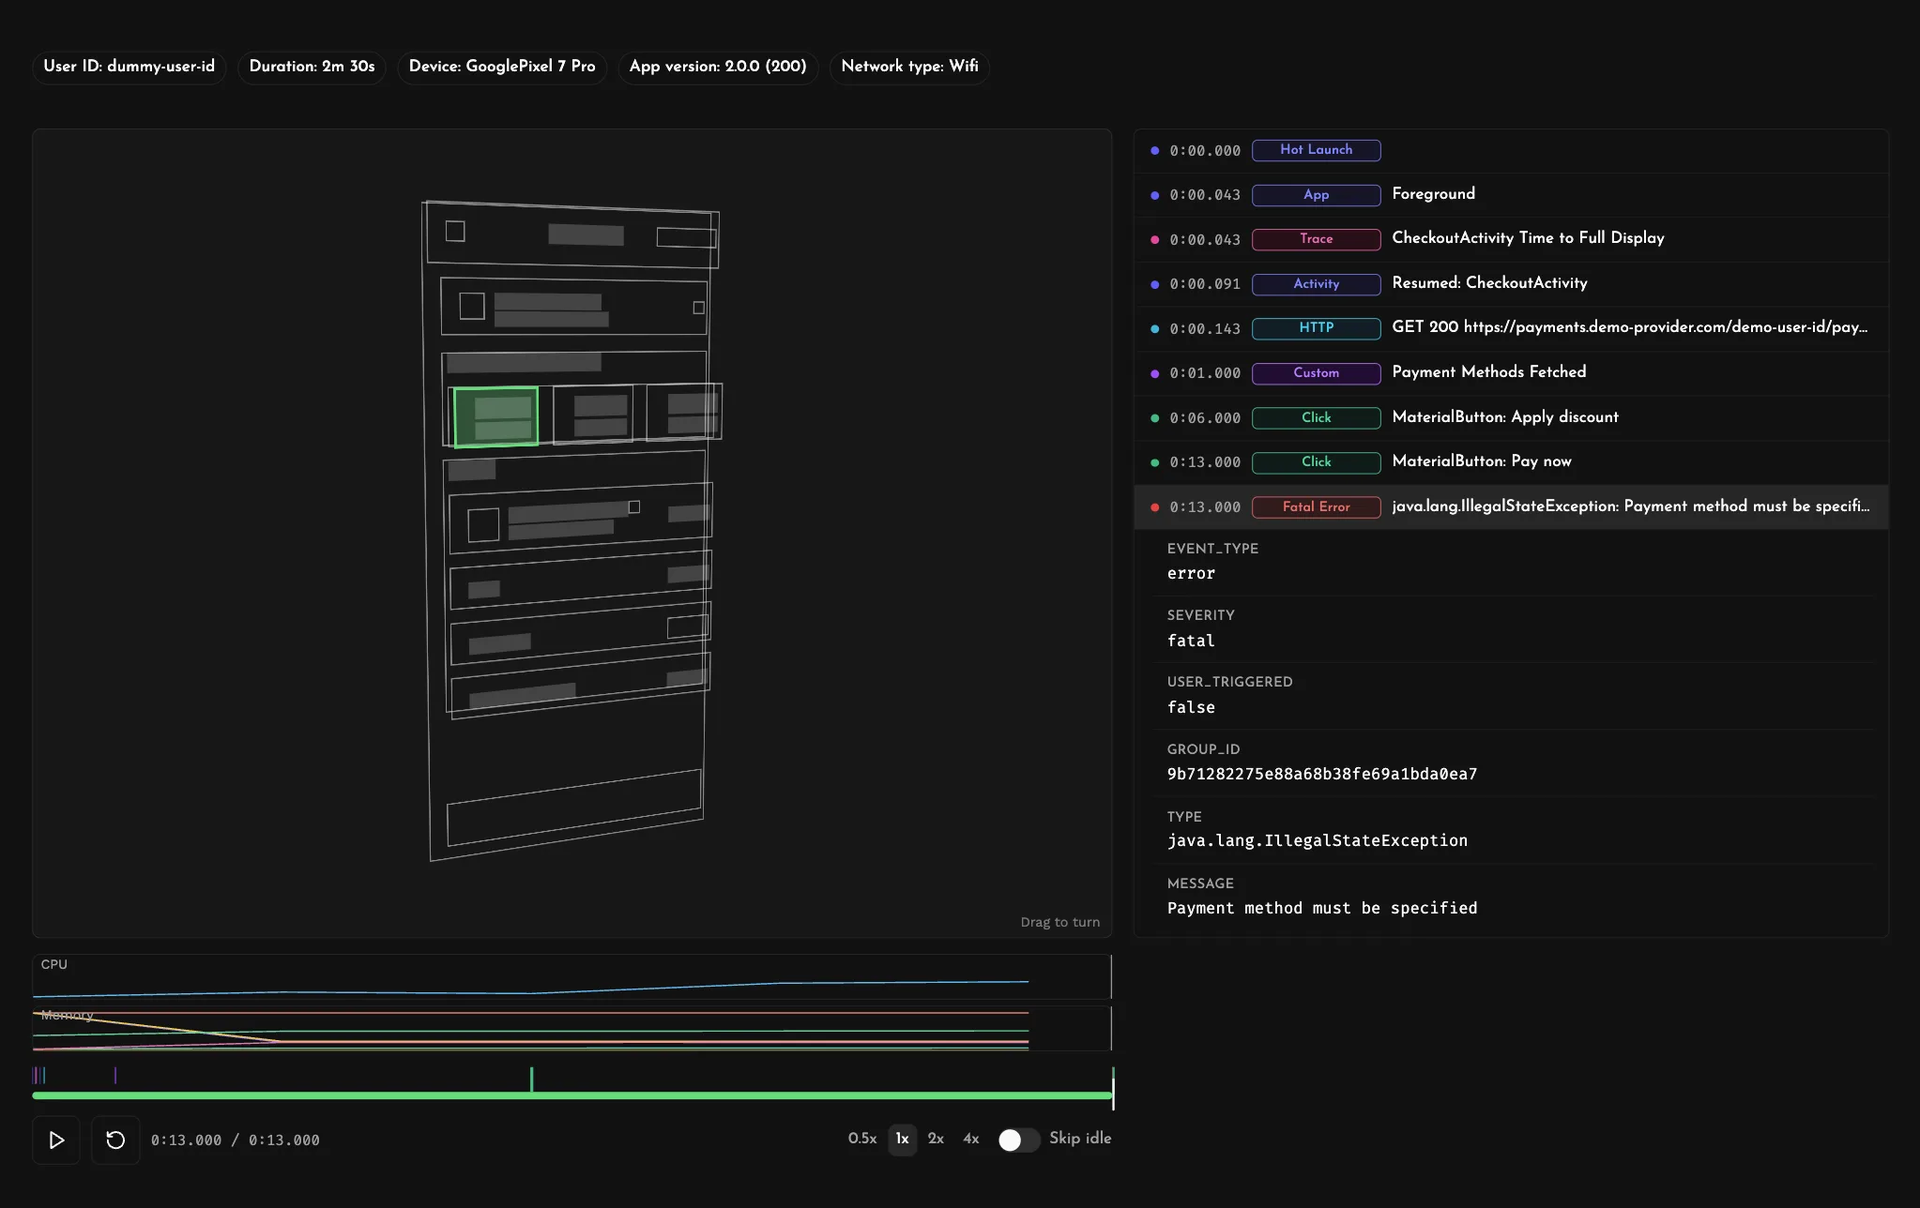
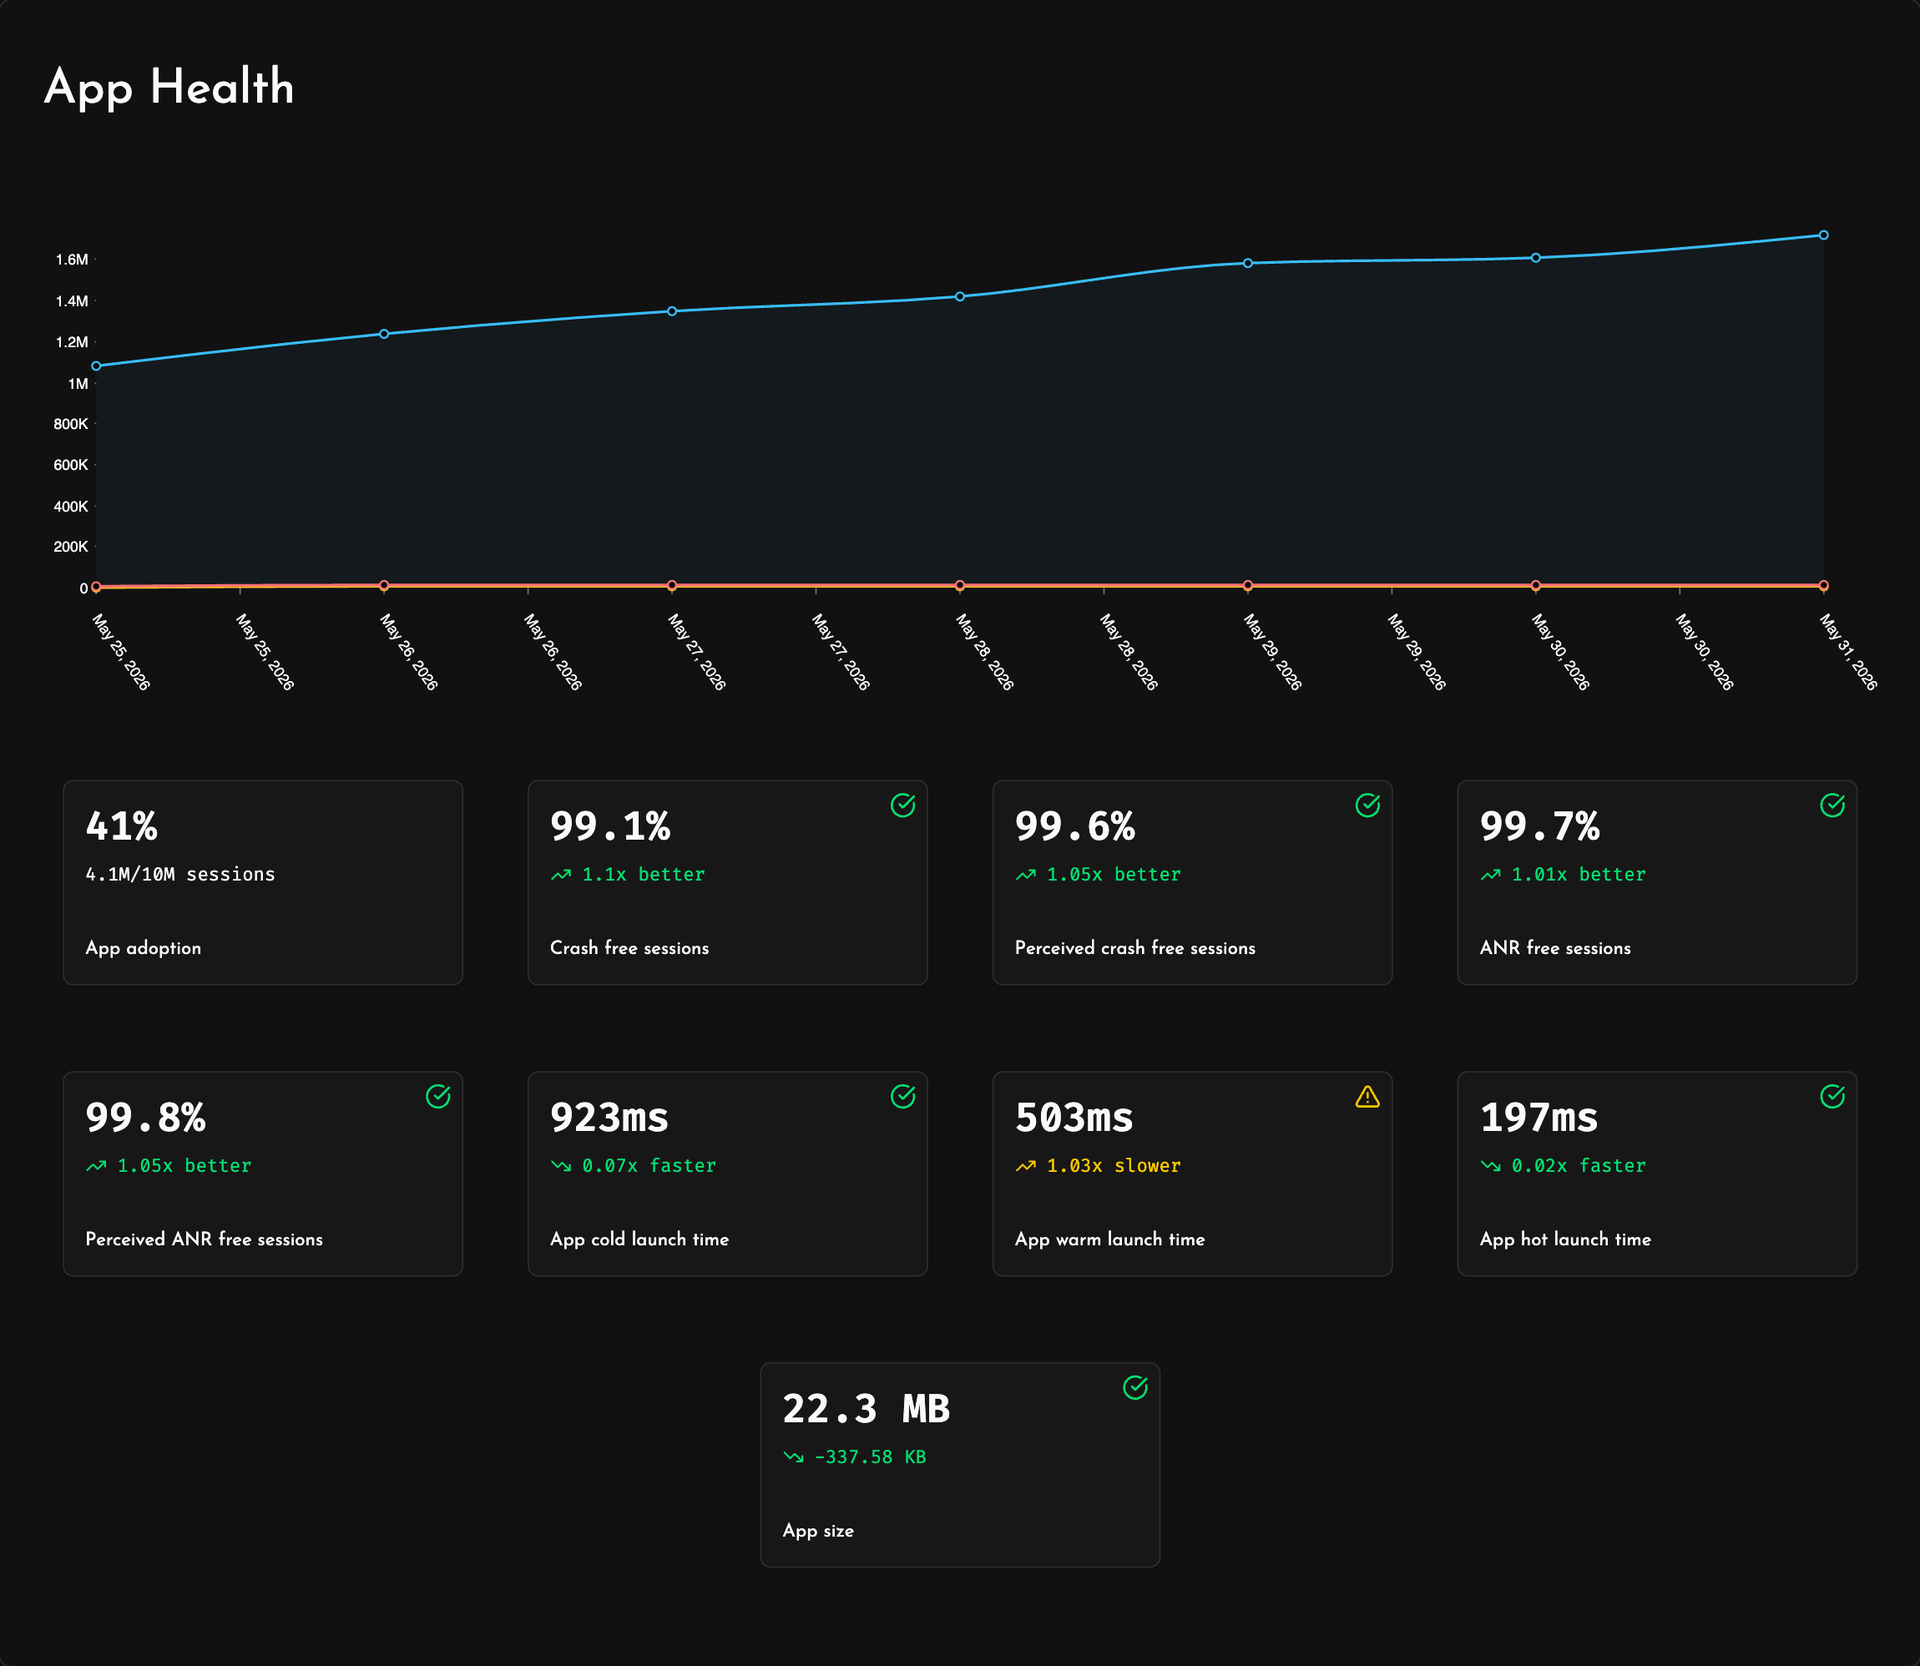
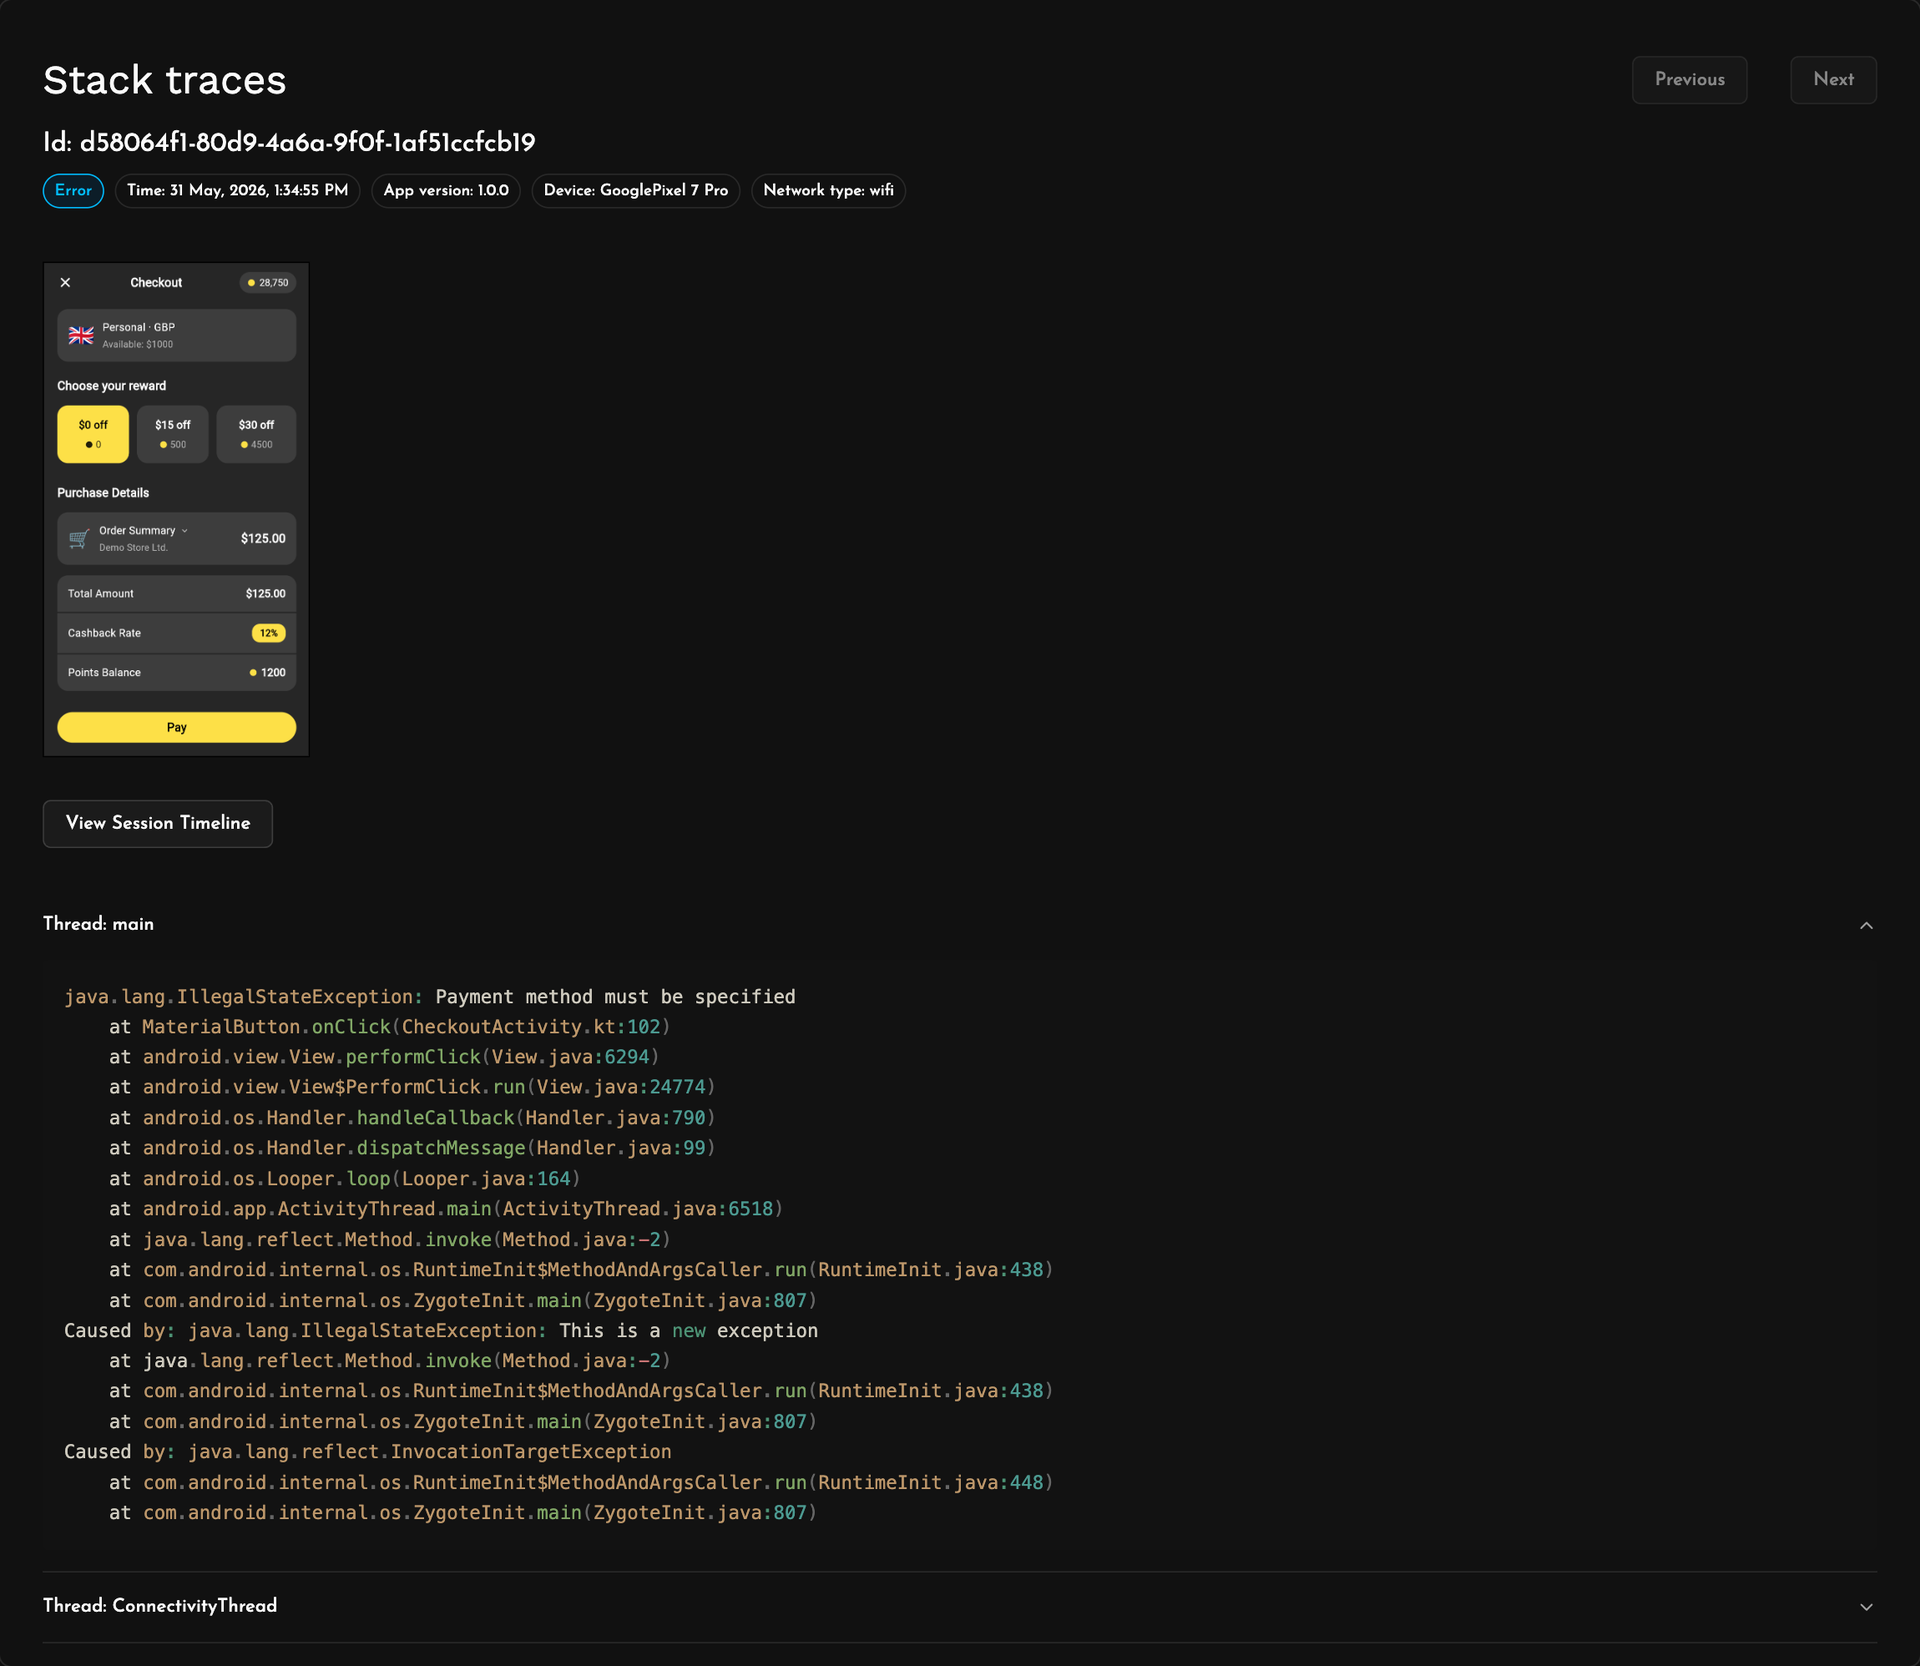
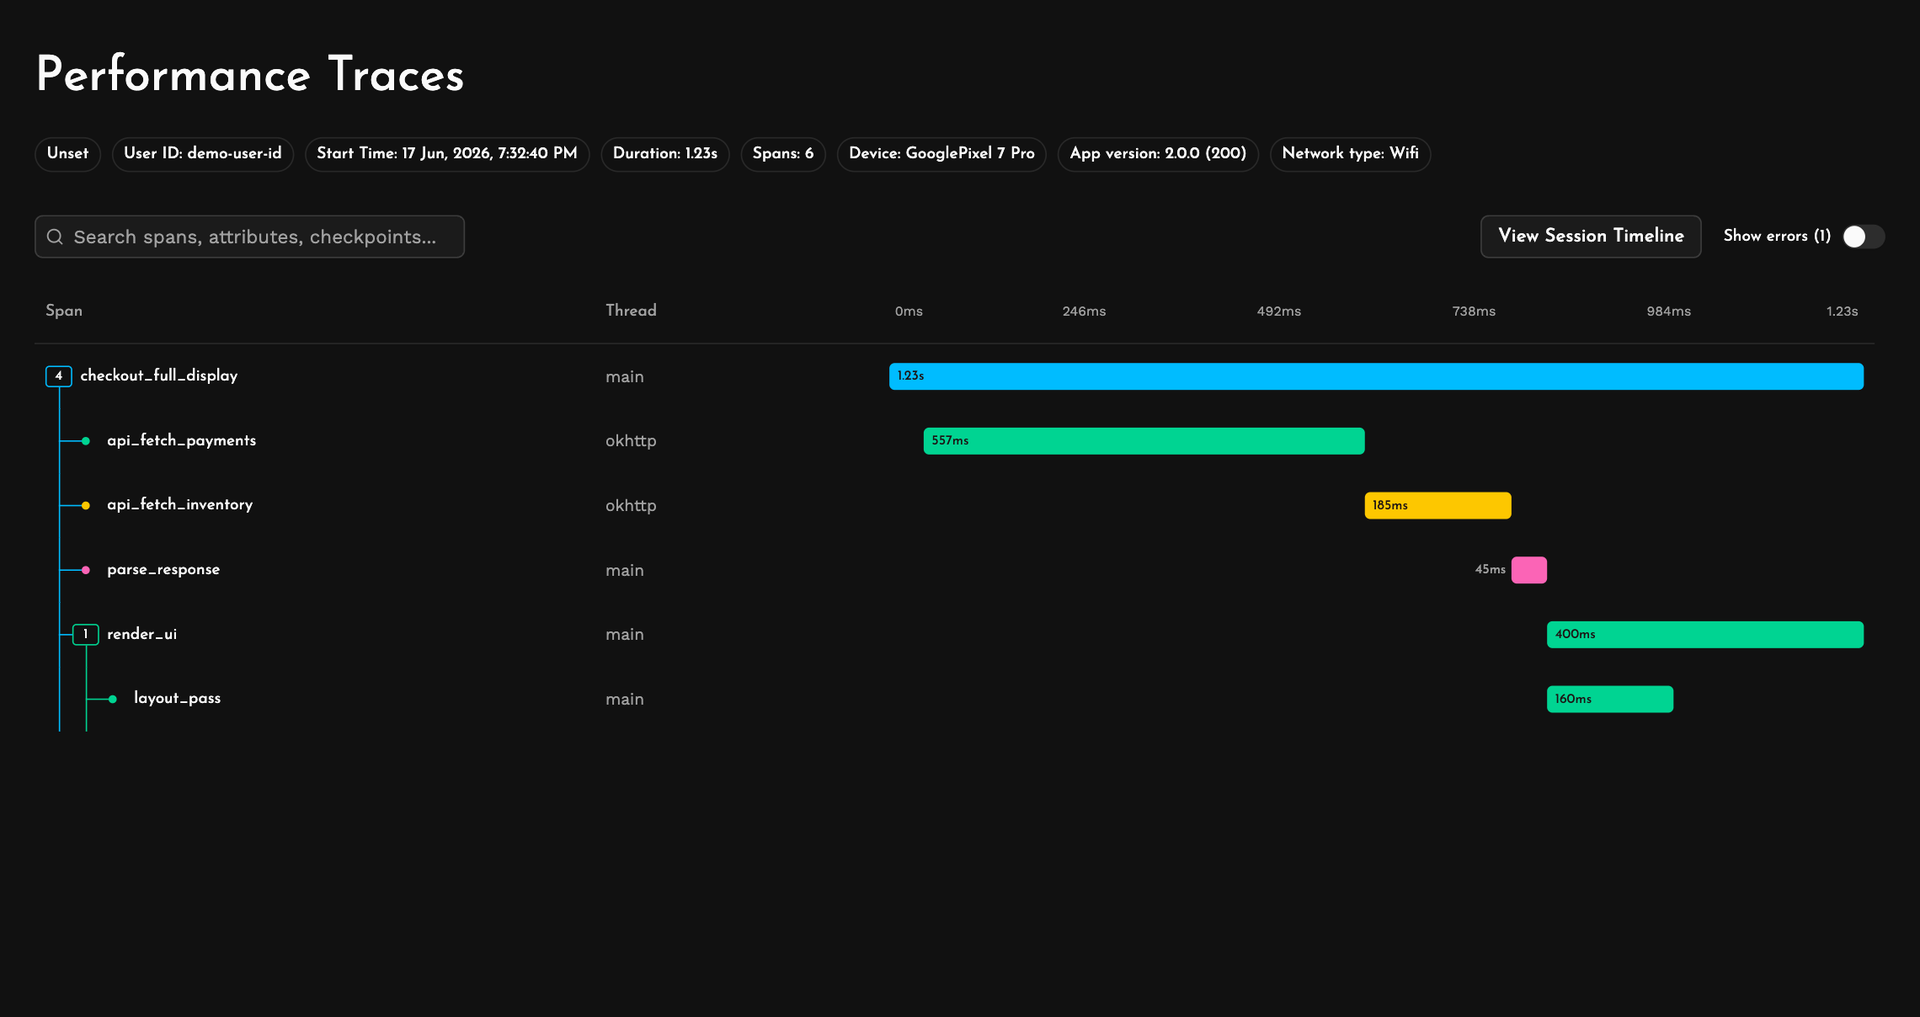
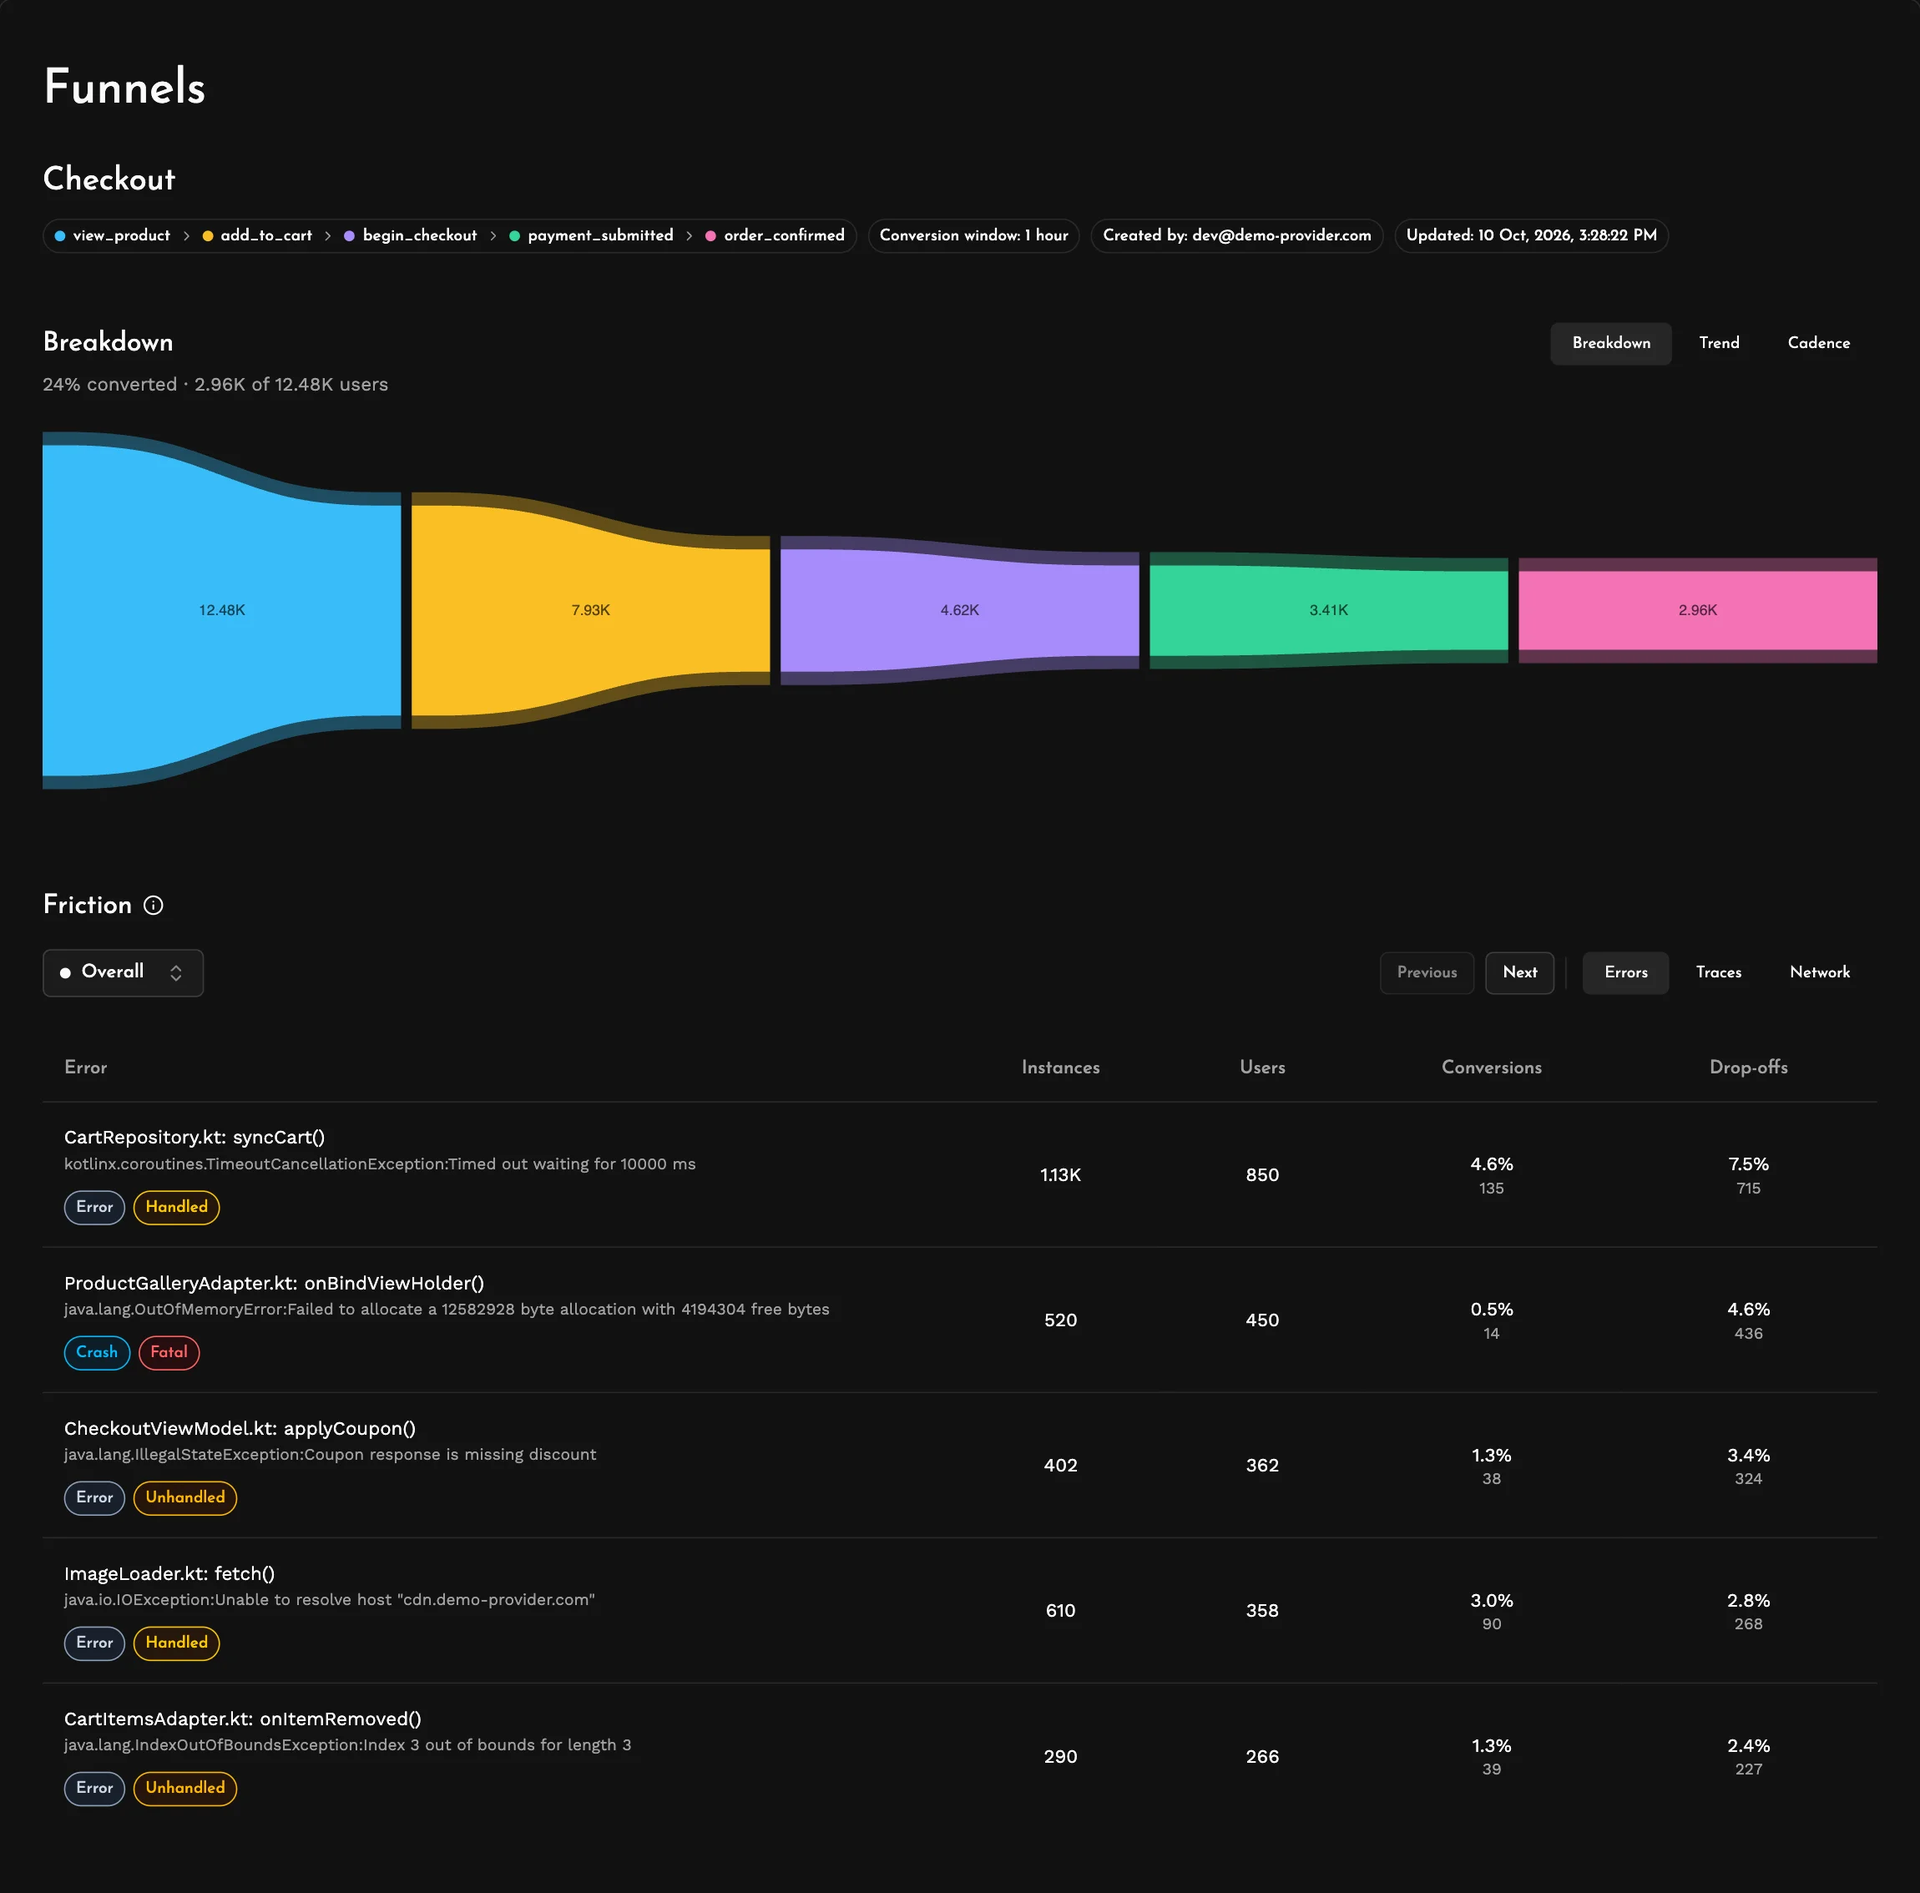
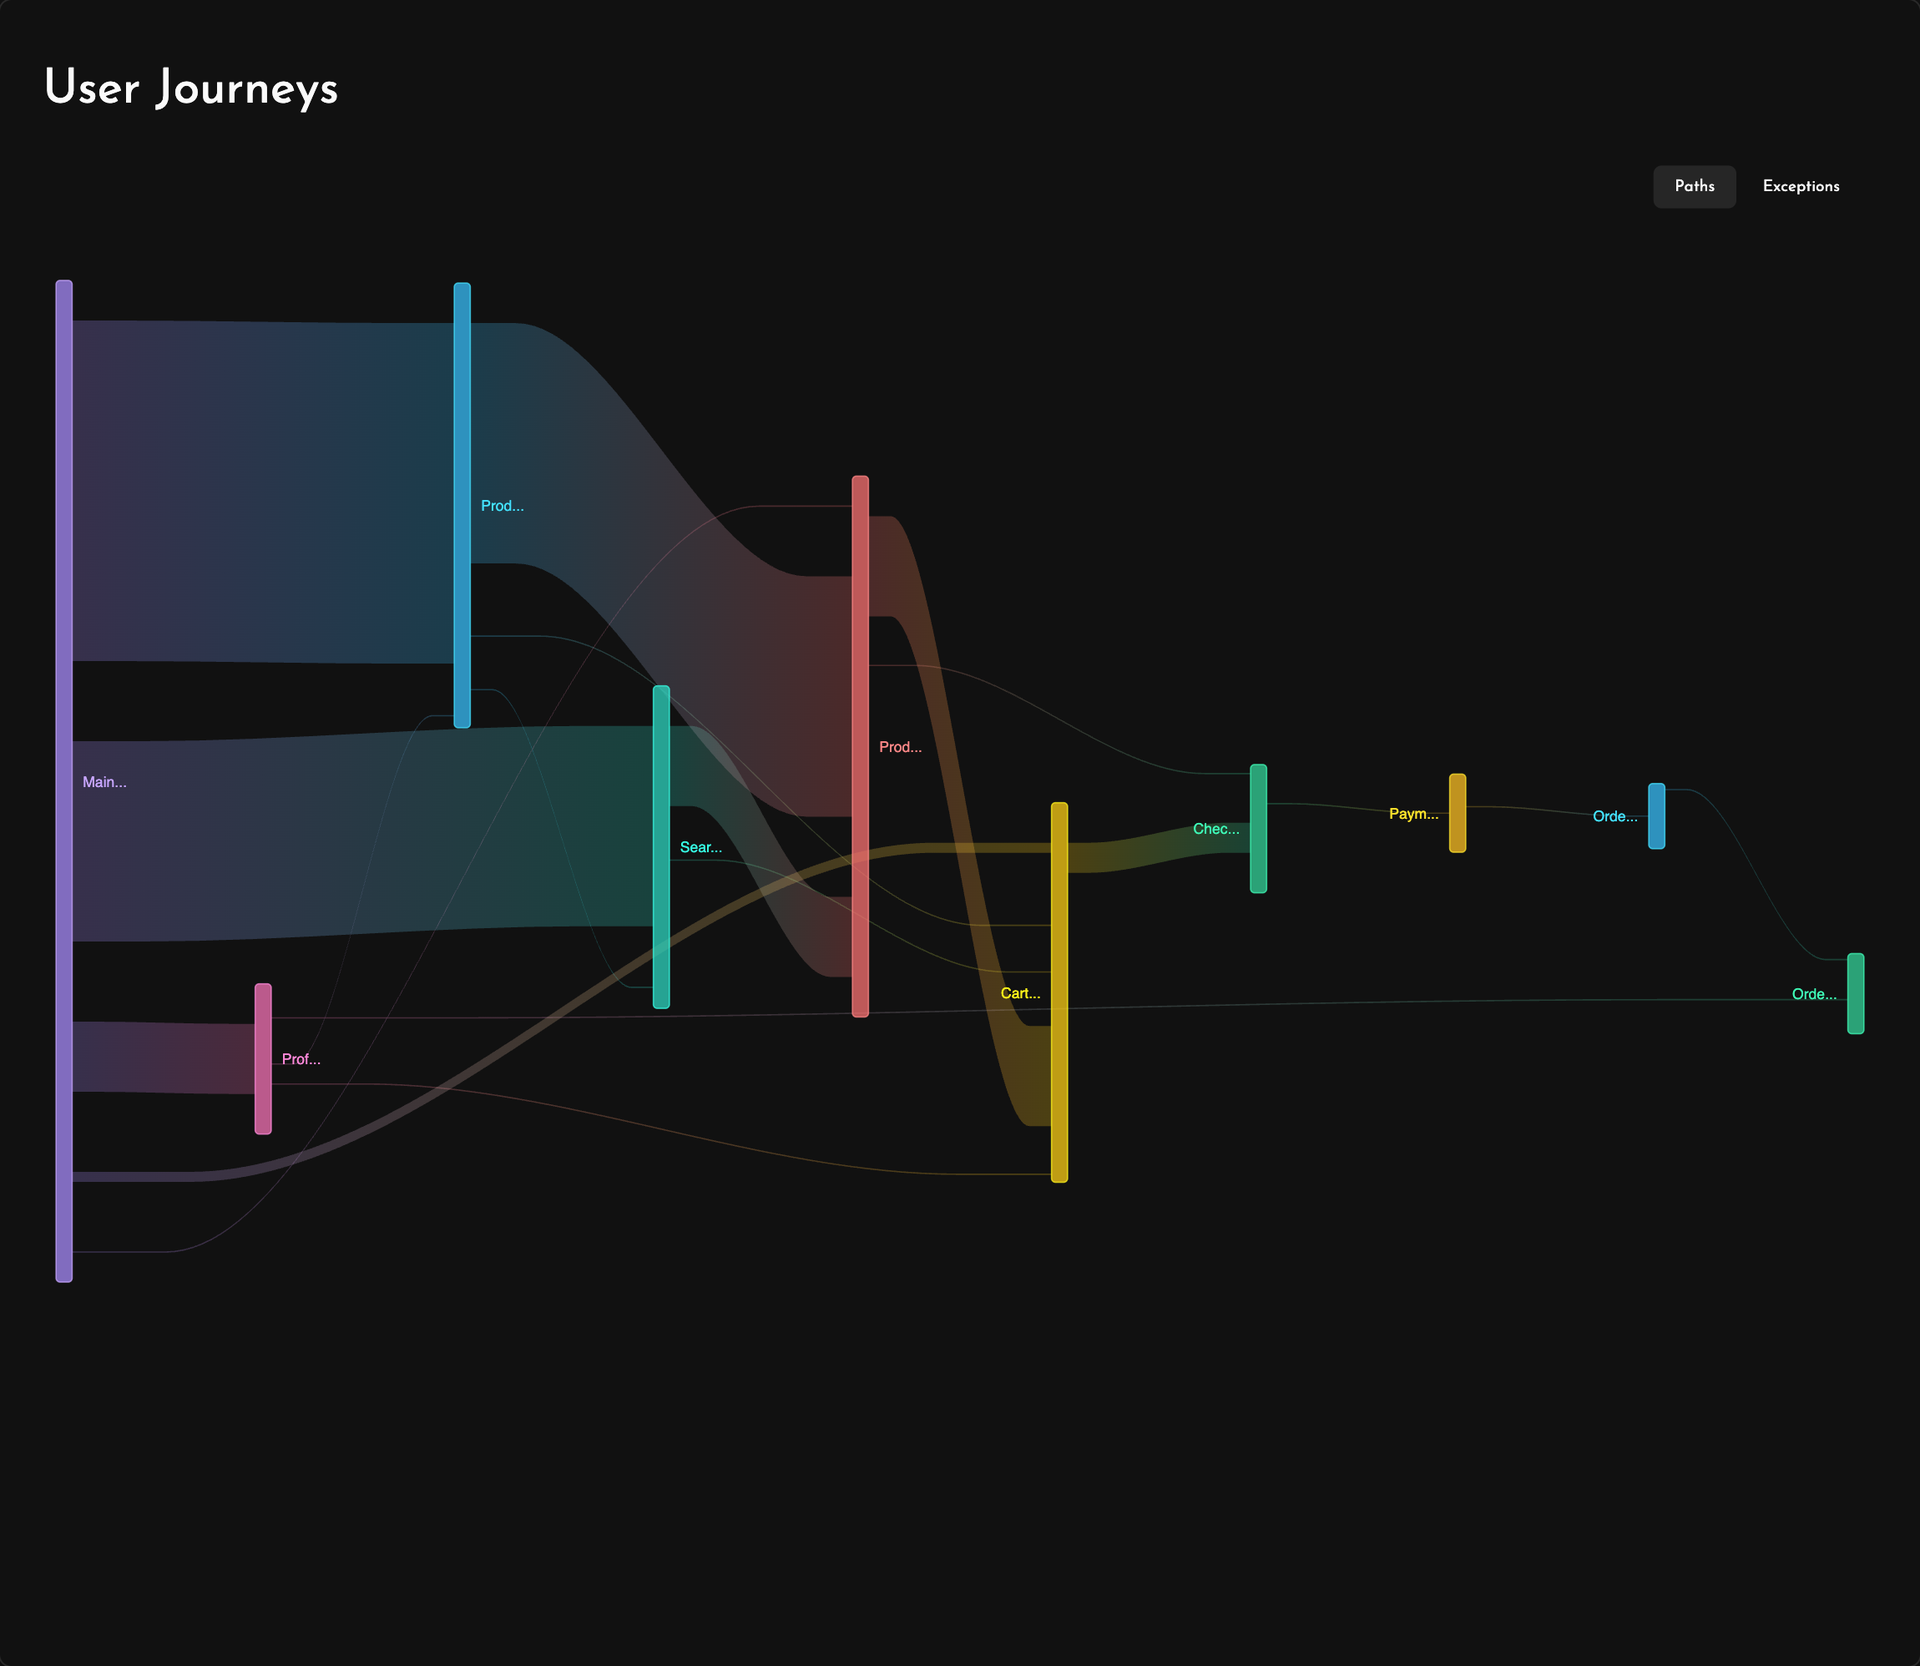
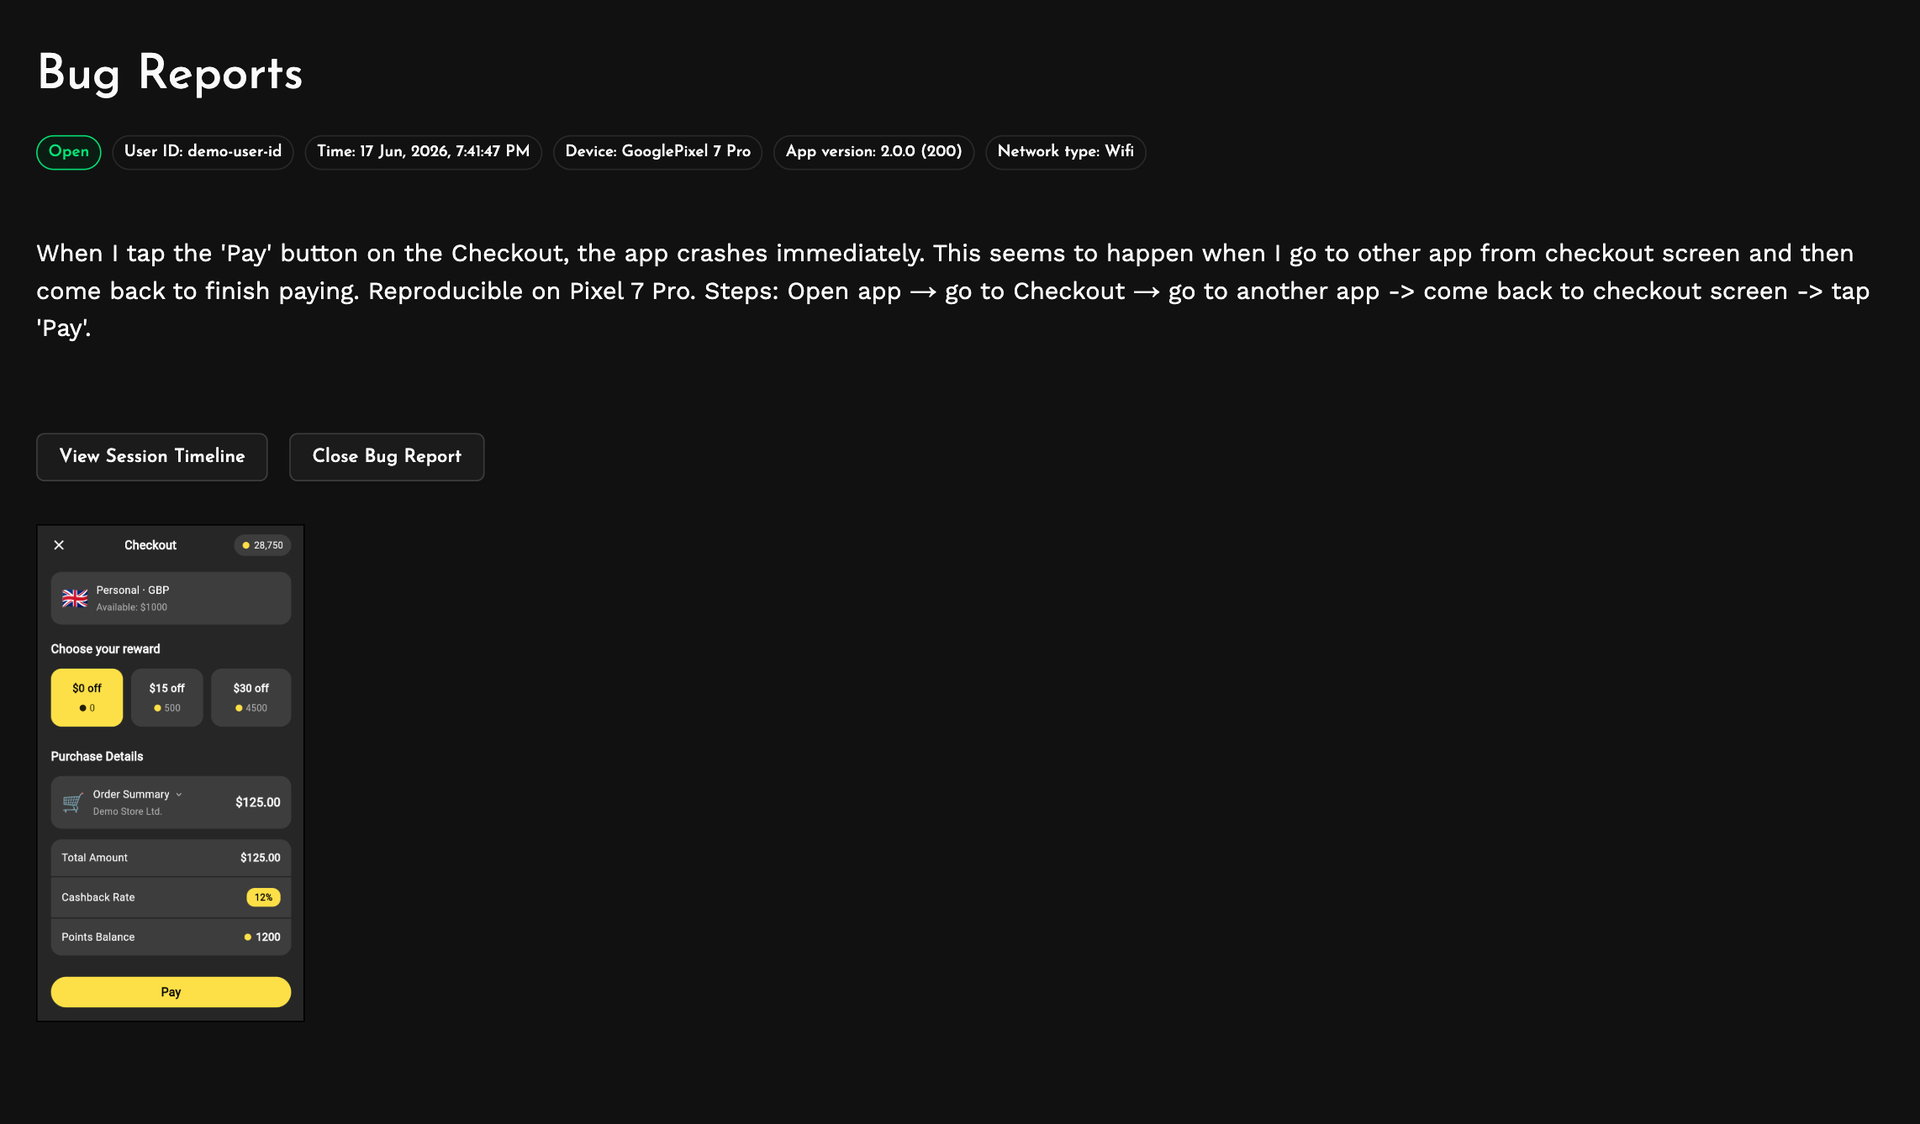
Measure is an open-source mobile monitoring platform that shows mobile teams what broke, how often, and what the user did right before it happened. Crashes, ANRs, and app hangs are grouped into single issues, and each fatal error arrives with a session replay: an ordered timeline of screens opened, taps, network calls, logs, and lifecycle events, with CPU and memory charts alongside screenshots and wireframe layout snapshots. Bug reports can be filed with a device shake or an SDK call and carry the same history of user actions. Performance traces and spans break slow startups and screens into steps, and network monitoring ranks the slowest and most error-prone endpoints. Funnels built from custom events show conversion and drop-off at each step, with a Friction view that ties every step to the crashes, errors, slow traces, and network requests users hit there. User journeys chart how people move between screens, and Adaptive Capture changes sampling, replay length, and screenshot masking remotely, with no new app build. SDKs cover Android, iOS, Flutter, React Native, and Kotlin Multiplatform. Teams sign in with Google or GitHub, invite colleagues by email, and send alerts to Slack, and an optional Measure Agent lets a coding agent or Slack help debug production issues. Running on a dedicated VPS on RepoCloud with guaranteed CPU, RAM, and SSD, full root SSH access, and a browser serial console. Apache-2.0 licensed.
Benefits
- Debug crashes with full context
- Every fatal error, ANR, and bug report ships with a session replay covering the previous five minutes, so teams retrace screens, taps, logs, and network calls instead of guessing.
- Tune data collection without releases
- Adaptive Capture adjusts sampling rates, replay duration, and screenshot masking from the dashboard, so teams can collect more during a rollout and less afterward without shipping a new build.
- Cover every major mobile platform
- Official SDKs for Android, iOS, Flutter, React Native, and Kotlin Multiplatform report into one dashboard, so cross-platform teams track the health of a single product in one place.
- Keep mobile telemetry on your servers
- Run the whole stack on one Linux VM and keep crash data, session replays, and screenshots under your control, with Google or GitHub sign-in, SMTP team invites, and optional Slack alerts.
Features
- Crash and ANR tracking
- Groups crashes, ANRs, and app hangs into issues with stack traces and screenshots; on Android 11 and above, ANRs are read from ApplicationExitInfo for accurate reports.
- Session replay timelines
- Orders screens, gestures, logs, network calls, and lifecycle events beside CPU and memory charts, with screenshots and wireframe layout snapshots showing what the user saw.
- Performance traces and spans
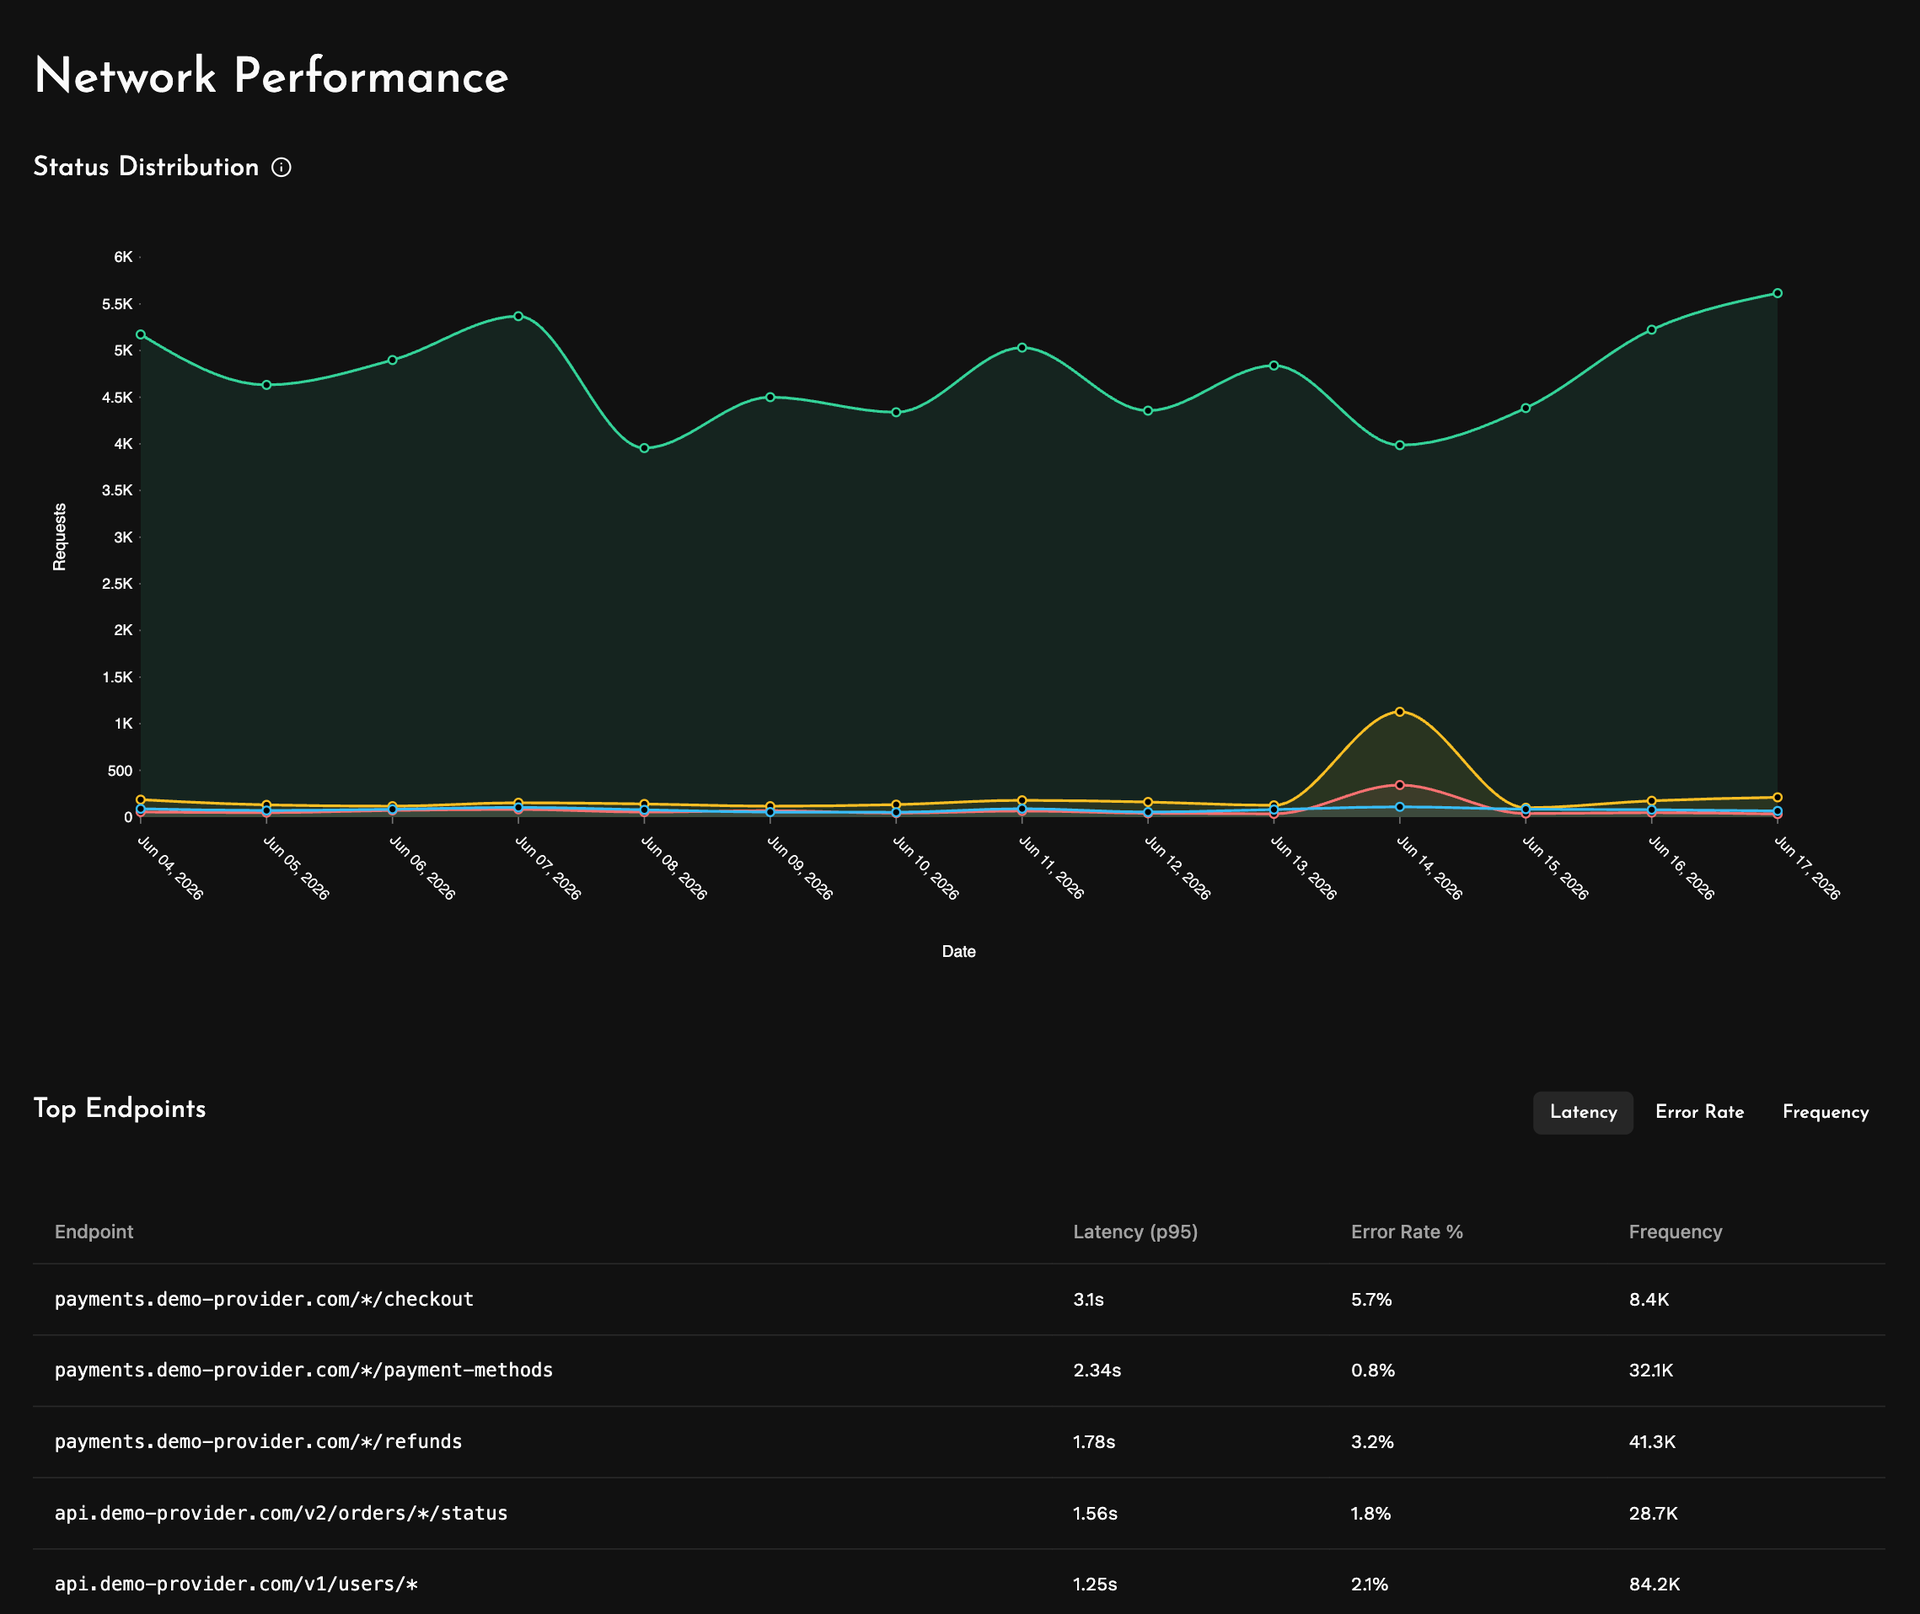
- Breaks slow operations into traces and spans, and ranks the slowest and most error-prone network endpoints so engineers see where latency and failures concentrate.
- Adaptive Capture controls
- Changes sampling, replay length, and screenshot mask levels remotely; defaults report every fatal and unhandled error and mask all text and media in captured screenshots.
- Funnels and friction analysis
- Builds funnels from custom events to show conversion and drop-off per step, and links each step to crashes, errors, slow traces, and network requests.
- Docker Compose self-hosting
- An install script sets up Docker or Podman services on Ubuntu 24.04 or Debian 12, with Caddy as the suggested reverse proxy for the dashboard, API, and ingest endpoints.