LogTide
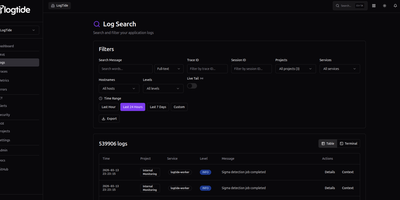
Every production incident starts the same way: someone asks "what do the logs say?" and the answer takes 45 minutes to find. LogTide collapses that search into seconds with a unified observability platform that indexes logs, traces, and metrics into a single queryable interface, backed by your choice of TimescaleDB, ClickHouse, or MongoDB. The log search interface supports full-text queries across millions of entries with filters for trace ID, session ID, project, service, hostname, and severity level, plus a live tail mode that streams new log lines as they arrive. Distributed traces render as waterfall timelines showing every span, its duration, and cross-service dependencies, while correlated logs for each trace are one click away. The metrics explorer visualizes OTLP gauge and counter data from your applications with system CPU, memory, disk, and network panels that update in near real-time. Where LogTide diverges from standard observability is its built-in SIEM engine: Sigma-compatible detection rules scan incoming logs for security threats like SQL injection, privilege escalation, lateral movement, and C2 communication, surfacing findings on a dedicated security dashboard with severity distribution, detection timelines, and affected service breakdowns. Alerting pushes notifications to Email, Slack, or Discord webhooks when thresholds trip or security rules fire. Native SDKs for Node.js, Python, Go, PHP, Kotlin, and Ruby ship logs with retry logic and circuit breakers, and the platform accepts OpenTelemetry data natively. Running on a dedicated VPS on RepoCloud with guaranteed CPU, RAM, and SSD, full root SSH access, and a browser serial console. AGPL-3.0 licensed.
CPA Manager Plus
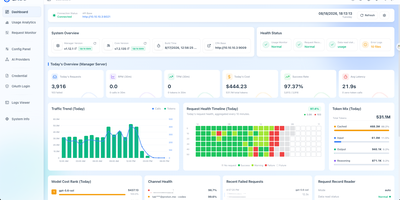
CPA Manager Plus is a self-hosted observability dashboard and management panel that tracks every AI request flowing through your CLI Proxy API gateway, breaking down failures, costs, and account health across providers like OpenAI, Anthropic, xAI, and Codex in one interface. When a request fails, drill into the persistent history to see status codes, affected models, latency, and redacted failure evidence without exposing raw response bodies. The cost analytics engine breaks down token consumption and estimated spend by model, provider, account, API key, project, channel, and time range while tracking input, output, reasoning, cache, and service-tier pricing semantics separately. Model prices sync automatically from models.dev with LiteLLM and OpenRouter fallbacks, and you can add local overrides for aliases or internal models. For teams running Codex or xAI accounts, the health inspector reads quota windows, reset evidence, credential state, and workspace status on a configurable schedule, routing credential failures into an action queue for review rather than letting them silently degrade throughput. Deploy the Lightweight Panel to replace your existing CPA management UI without adding another service, or run Full Mode as a single Docker container that adds the Manager Server with persistent SQLite storage for request history, historical analytics, and automated account inspections. Export or import request history as JSONL for external analysis, and back up the SQLite files alongside your encrypted management keys. Running on a dedicated VPS on RepoCloud with guaranteed CPU, RAM, and SSD, full root SSH access, and a browser serial console. MIT licensed.
OpenStatus
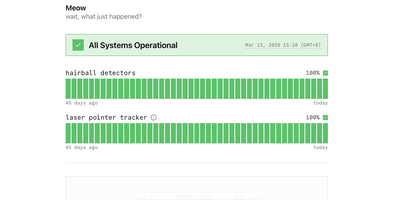
Trusted by Cal.com, WhiteBIT, and Documenso and backed by 8,800+ GitHub stars, OpenStatus delivers the open-source status page and uptime monitoring platform that replaces Atlassian Statuspage, Better Stack, and Instatus with a single self-hosted deployment. The monitoring engine runs Go-based probes across 28 global regions on three cloud providers checking HTTP, TCP, and DNS endpoints in parallel with configurable intervals and multi-region consensus to eliminate false-positive alerts. Status pages ship with custom domain support, password and email-domain access controls, maintenance windows, grouped monitor components, and subscriber notifications via email and RSS. Incident management provides structured status reports with investigating, identified, monitoring, and resolved timeline phases that publish automatically to affected status pages. The monitoring-as-code workflow supports YAML configuration synced through the CLI, a GitHub Actions integration for CI/CD pipelines, and a Terraform provider for infrastructure-as-code deployments. The typed ConnectRPC JSON-over-HTTP API exposes a published OpenAPI specification with a Node SDK for programmatic access, while an MCP server connects AI assistants like Claude, ChatGPT, and Cursor directly to workspace data. The tech stack combines Next.js with shadcn/ui for the dashboard, Hono for the API server, Drizzle ORM over Turso for application data, and Tinybird for analytics. Private monitoring locations deploy as a single 8.5MB Docker image behind firewalls to check internal services. Running on a dedicated VPS on RepoCloud with guaranteed CPU, RAM, and SSD, full root SSH access, and a browser serial console. AGPL-3.0 licensed.
pgAdmin
pgAdmin 4 is the reference administration GUI for PostgreSQL, bundled by virtually every Linux distribution and supporting versions 14 through 18 including EDB Advanced Server — browse schemas in a hierarchical tree, write and optimize queries with AI assistance, design entity-relationship diagrams visually, monitor live sessions, and run backup/restore operations entirely from the browser. Built on Python Flask with a ReactJS frontend, version 9.17 delivers a comprehensive web-based platform accessible from any device. The Query Tool provides syntax highlighting, auto-completion, query history, an EXPLAIN plan visualizer with graphical node representation, AI-powered SQL generation from natural language prompts, and AI Insights for execution plan analysis that identifies performance bottlenecks. The Graph Visualiser renders query results as line charts, bar charts, stacked charts, and pie charts directly in the interface. The ERD Tool auto-generates entity-relationship diagrams from existing schemas for visual database design. The Schema Browser presents databases, schemas, tables, views, functions, sequences, roles, and extensions in a navigable hierarchy. Server monitoring dashboards display real-time active sessions, locks, transaction throughput, and vacuum status. GUI-driven backup and restore wraps pg_dump and pg_restore with format and compression options. Authentication supports internal, LDAP, Kerberos, OAuth2/OIDC, and webserver modes. The Helm chart includes an HTTPRoute template for Kubernetes Gateway API deployments. Bundled pg_dump, pg_restore, and psql utilities version 18.4. Deploy via Docker with the official dpage/pgadmin4 image. Running on a dedicated VPS on RepoCloud with guaranteed CPU, RAM, and SSD, full root SSH access, and a browser serial console. PostgreSQL License.
Arcane
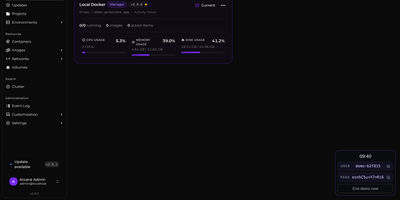
Arcane gives you a single polished dashboard to manage Docker containers, images, volumes, networks, and Compose projects across unlimited remote hosts. The SvelteKit frontend paired with a Go backend delivers real-time resource monitoring with historical graphs, container lifecycle controls including shell exec and live log streaming, and one-click Docker Compose deployment with Git repository synchronization for version-controlled stack definitions. The manager-agent architecture connects remote environments via Direct TCP on port 3553 or Edge mode where agents initiate outbound gRPC/WebSocket connections through NAT and firewalls without requiring inbound ports, all secured with mTLS certificates. Vulnerability scanning identifies security issues in running container images directly from the interface. The backup system enables scheduled container snapshots with configurable retention for disaster recovery. Network and volume administration includes visual relationship mapping between services, and the responsive interface supports dark/light themes with full mobile optimization and community-driven internationalization via Crowdin. 6,500+ stars and 89 releases since April 2025 reflect a rapid development cadence. Running on a dedicated VPS on RepoCloud with guaranteed CPU, RAM, and SSD, full root SSH access, and a browser serial console. BSD-3-Clause licensed.
OpenLIT
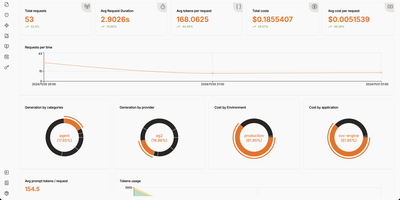
Your AI application is burning through API tokens faster than you can refresh the billing page, and you have no idea which prompt template is responsible. OpenLIT plugs that visibility gap with a self-hosted observability platform built specifically for LLM workloads. Add one line of code to instrument 90+ LLM providers, agent frameworks, and vector databases, then watch every request flow through a tracing dashboard that shows tokens consumed, latency measured, and dollars spent per call, per model, per environment. The requests view lists every LLM interaction with provider, model, cost, and token breakdown in a filterable table, while the trace detail panel lets you drill into individual spans to read the exact prompt sent and response received. Prompt Hub turns prompts into versioned artifacts you deploy, rollback, and A/B test without touching application code. OpenGround compares models side by side on the same input, so you can evaluate cost-versus-quality tradeoffs before committing to a provider. Automated evaluations run LLM-as-a-judge scoring on live production traces, flagging hallucinations, bias, and toxicity in real time. The Vault stores and rotates API keys centrally so secrets stay out of your codebase. Custom dashboards let you build drag-and-drop monitoring views with charts, stat cards, and tables backed by SQL queries against ClickHouse. GPU utilization, memory, temperature, and power metrics feed into the same platform for end-to-end infrastructure visibility. Running on a dedicated VPS on RepoCloud with guaranteed CPU, RAM, and SSD, full root SSH access, and a browser serial console. Apache 2.0 licensed.
Jaeger
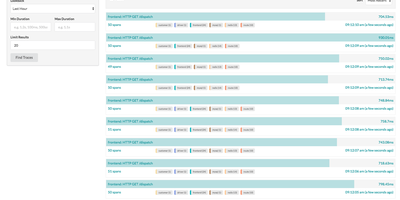
Created by Uber Technologies and graduated as the seventh CNCF top-level project in October 2019 with over 23,000 GitHub stars, Jaeger has become one of the most widely deployed open-source distributed tracing platforms, processing billions of spans per day in production environments at organizations including Uber, Red Hat, and Shopify. Version 2 rebuilt the platform on the OpenTelemetry Collector framework, inheriting its extensible pipeline architecture while implementing Jaeger-specific features as extensions and components, enabling seamless integration with the OpenTelemetry ecosystem through native OTLP protocol support. The platform stores traces in Cassandra 4.0+, Elasticsearch 7.x/8.x, OpenSearch 1.0+, ClickHouse, or the embedded Badger database for development setups. Three sampling strategies control trace volume: head-based sampling with constant, probabilistic, and rate-limiting modes, tail-based sampling using the OpenTelemetry Collector processor that evaluates complete traces before storage decisions, and adaptive sampling that dynamically adjusts probabilities based on observed traffic patterns. Service Performance Monitoring computes RED metrics directly from spans, displaying request rates, error rates, and latency percentiles in the Monitor tab with drill-down from aggregate service views to individual traces. The web UI provides trace search with multi-field filtering, trace detail views with span timeline visualization, trace comparison across services, and dependency graphs mapping service relationships from actual traffic. Deployment options range from a single all-in-one binary for development to distributed collector-ingester-query configurations with Kafka intermediate buffering for production scale. Running on a dedicated VPS on RepoCloud with guaranteed CPU, RAM, and SSD, full root SSH access, and a browser serial console. Apache 2.0 licensed.
KubeSphere
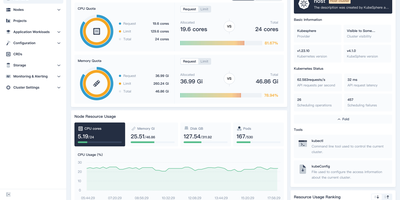
Managing Kubernetes shouldn't require every developer to become a Kubernetes expert — KubeSphere wraps cluster operations, CI/CD, service mesh, and observability into guided web workflows that operations teams configure once and developers consume without kubectl. The LuBan extensible architecture treats each capability as an independently installable extension plugging into a lightweight microkernel: enable DevOps without service mesh, add monitoring without the app store, compose exactly what your organization needs. Multi-cluster management provides a centralized control plane for provisioning and operating clusters across cloud providers, data centers, and edge locations with unified identity and resource quotas. The DevOps extension integrates Jenkins for graphical pipeline creation with S2I and B2I workflows, while Argo CD powers GitOps continuous deployment with real-time sync status. Istio-based service mesh provides traffic management, canary deployments, circuit breaking, and distributed tracing through the console without CLI knowledge. Prometheus monitoring with custom dashboards, Fluentd log collection with multi-tenant search, and alerting via Slack and email complete the observability stack. Multi-tenant workspace hierarchy enforces resource quotas and fine-grained RBAC roles across teams. A built-in Helm-based app store handles lifecycle management across clusters. KubeKey deploys production-grade clusters on bare metal or VMs with air-gapped support. Running on a dedicated VPS on RepoCloud with guaranteed CPU, RAM, and SSD, full root SSH access, and a browser serial console. Apache-2.0 licensed.
GoAccess
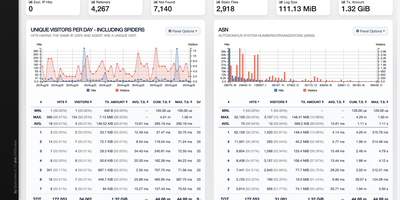
GoAccess processes millions of web log entries in seconds and renders the results as interactive dashboards that update every 200 milliseconds in the terminal or every second via WebSocket-connected HTML reports. Written entirely in C with only ncurses as a dependency, it achieves exceptional performance even on resource-constrained servers, reducing memory usage by approximately 20% and parsing time by 35% in recent releases through optimized in-memory hash tables with on-disk persistence support. The analyzer parses virtually every web log format out of the box (Apache Combined and Common, Nginx, Amazon CloudFront, Amazon S3, AWS Elastic Load Balancing, Google Cloud Storage, Squid, W3C IIS, Caddy JSON, and Traefik) while supporting fully custom log format strings for non-standard configurations. The self-contained HTML dashboard displays 15+ interactive panels covering unique visitors, requested files, static files, 404 errors, referring sites, search keyphrases, geographic location with city-level GeoIP resolution, operating systems, browsers, HTTP status codes, time distribution, and virtual host metrics. WebSocket authentication via JWT provides secure remote access, and incremental log processing ensures data continuity across daemon restarts. Docker deployment requires a single command with volume-mapped access logs. Over 20,800 stars with active development since 2010. Running on a dedicated VPS on RepoCloud with guaranteed CPU, RAM, and SSD, full root SSH access, and a browser serial console. MIT licensed.
OpenSearch
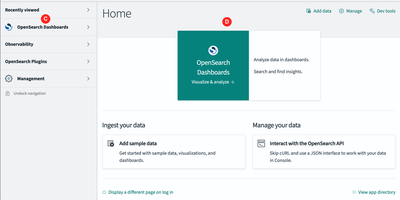
OpenSearch is a search and analytics platforms, powering full-text search, log analytics, observability, and AI-powered vector retrieval at petabyte scale. The distributed engine provides BM25 full-text search alongside k-NN vector search using NMSLIB, Faiss, and Lucene libraries, enabling semantic search, hybrid search combining keyword and vector scoring through normalization processors, neural sparse search, and retrieval-augmented generation workflows with built-in ML Commons for model hosting. OpenSearch Dashboards delivers interactive visualization with Discover for log exploration, custom dashboards, alerting, anomaly detection using Random Cut Forest algorithms, and Security Analytics with detection rules mapped to MITRE ATT&CK. Native Prometheus integration with full PromQL support unifies metrics alongside logs and traces in a single observability interface, while Data Prepper handles telemetry ingestion from OpenTelemetry collectors, Fluent Bit, and Logstash-compatible pipelines. SQL and Piped Processing Language queries with a visual PPL builder enable analysts to query data without learning the native DSL. Index State Management automates index lifecycle with rollover, shrink, and delete policies, while cross-cluster replication and searchable snapshots on S3-compatible storage provide disaster recovery. Scoped API keys, field-level security, document-level security, and audit logging deliver enterprise-grade access control. Docker Compose deploys multi-node clusters alongside the Kubernetes operator for orchestrated production environments. Running on a dedicated VPS on RepoCloud with guaranteed CPU, RAM, and SSD, full root SSH access, and a browser serial console. Apache 2.0 licensed.
Langfuse
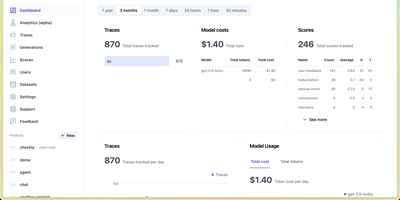
Backed by Y Combinator and trusted by over 2,300 companies processing billions of observations monthly, Langfuse is the most widely adopted open-source platform for building, monitoring, evaluating, and debugging LLM applications. The hierarchical tracing engine captures every LLM call, tool invocation, retrieval step, and agent action as nested spans based on OpenTelemetry, with automatic cost calculation, latency tracking, and token usage attribution across sessions and users. Prompt Management separates prompts from code with versioned artifacts, label-based deployments, one-click rollbacks, and runtime SDK fetching with server-side caching, while linking every generation back to its exact prompt version for attribution analytics. The evaluation system supports LLM-as-a-judge scoring, heuristic code evaluators, user feedback collection, and manual annotation workflows that run automatically on production traces or against curated datasets. The Playground enables interactive prompt testing on real production inputs with side-by-side model comparison across providers. Datasets and Experiments define test cases for systematic benchmarking with comparative result visualization. Native SDKs for Python and TypeScript provide decorator-based instrumentation, while 100+ integrations cover LangChain, LlamaIndex, OpenAI SDK, LiteLLM, Vercel AI SDK, and any OpenTelemetry-instrumented framework. The analytics dashboard surfaces cost breakdowns, quality scores, latency percentiles, and usage trends across models and prompt versions. Running on a dedicated VPS on RepoCloud with guaranteed CPU, RAM, and SSD, full root SSH access, and a browser serial console. MIT licensed.
MeshCentral
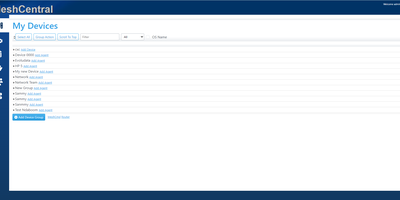
With over 7,000 GitHub stars and continuous development since 2017 by former Intel engineer Ylian Saint-Hilaire, MeshCentral has become the go-to self-hosted alternative to ConnectWise Control and Splashtop for managing devices remotely without per-seat licensing fees. The Node.js server installs via a single npm command and manages Windows, macOS, Linux, and FreeBSD endpoints through lightweight agents that maintain persistent WebSocket connections for real-time remote desktop, terminal access, and file transfer directly in the browser. Intel AMT integration provides out-of-band hardware management including power control and BIOS access even when the operating system is unresponsive. Device groups organize endpoints by location, customer, or function with granular role-based access control for multi-technician environments. Session recording captures remote desktop interactions for compliance auditing, while Wake-on-LAN powers on machines remotely across subnets. The server supports MongoDB for production deployments handling thousands of agents or the embedded NeDB for smaller setups under 200 devices, with a single 8GB VPS comfortably managing 1,500 concurrent agents. Security features include mandatory TLS with automatic Let's Encrypt certificate provisioning, multi-factor authentication via TOTP and FIDO2, SAML-based single sign-on, IP filtering, and HashiCorp Vault integration for secrets management. The web console provides real-time device monitoring with hardware and software inventory, network topology visualization, and customizable branding. TacticalRMM uses MeshCentral as its remote access layer. Running on a dedicated VPS on RepoCloud with guaranteed CPU, RAM, and SSD, full root SSH access, and a browser serial console. Apache-2.0 licensed.
OpenObserve
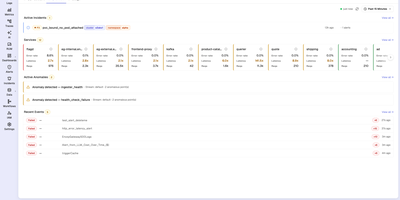
With 20,500+ GitHub stars and over 6,000 organizations running it in production — including a Fortune 100 company ingesting more than 4 PB per day — OpenObserve is the open-source observability platform that replaces your entire Datadog, Splunk, or ELK stack with a single Rust binary deploying in under two minutes. Apache Parquet columnar storage with zstd compression on S3-compatible object storage delivers 140x lower storage costs than Elasticsearch while providing better query performance on a quarter of the hardware. Ingest logs, metrics, and distributed traces via native OpenTelemetry OTLP endpoints with no vendor lock-in. Query logs and traces with standard SQL, metrics with SQL or PromQL — no proprietary query language to learn. The built-in dashboard builder offers 19 chart types including time-series graphs, heatmaps, gauges, tables, and top-K lists with drag-and-drop layout combining data from all signal types. Data pipelines process, enrich, redact, or normalize ingestion streams using Vector Remap Language for real-time transformations including PII redaction and logs-to-metrics conversion. Real User Monitoring captures frontend performance with session replay. The Service Catalog provides topology-based trace analysis with side-panel drill-downs into database queries and error details. Alerting supports real-time and scheduled rules with SQL and PromQL conditions. Native multi-tenancy isolates organizations and streams with complete data separation. Running on a dedicated VPS on RepoCloud with guaranteed CPU, RAM, and SSD, full root SSH access, and a browser serial console. AGPLv3 licensed.
ServerKit
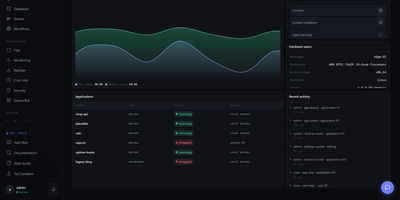
ServerKit delivers a server control panel that fits on a small VPS while managing everything from Docker containers to mail servers. The Python/Flask backend exposes 1,519 REST endpoints across 107 blueprints with full OpenAPI documentation at /api/v1/docs, while the React frontend spans 65 screens in a 1.75MB gzipped bundle served entirely from your own infrastructure. Docker management includes full container lifecycle control, Docker Compose project orchestration, real-time log streaming, and terminal access. Database panels cover MySQL/MariaDB and PostgreSQL with user management, browser-based query consoles, and automated backups to S3, Backblaze B2, or local storage. Nginx virtual host management automates Let's Encrypt certificate provisioning with hardened TLS 1.2+ configurations and Cloudflare-aware setups. The Go-based cross-platform agent enables multi-server fleet management with HMAC-SHA256 authentication over a WebSocket gateway, supporting Linux, Windows, and macOS across amd64 and ARM64 architectures. Fleet monitoring provides cross-server heatmaps, metric comparison charts, alert thresholds, anomaly detection, and capacity forecasting. A built-in marketplace distributes 106 one-click application templates using a declarative YAML schema with Docker Compose stacks. The extension system allows community plugins for Kubernetes management, Redis browsers, and WordPress site orchestration. Running on a dedicated VPS on RepoCloud with guaranteed CPU, RAM, and SSD, full root SSH access, and a browser serial console. MIT licensed.
UptimeKuma
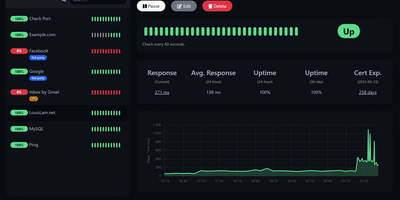
Sixty-thousand-plus GitHub stars make Uptime Kuma the most popular self-hosted monitoring tool - MIT-licensed, Node.js, and the standard replacement for UptimeRobot, Pingdom, and Freshping. It watches a dozen monitor types: HTTP(S) endpoints with keyword and JSON-query content validation, TCP ports, ICMP ping, DNS records, WebSockets, Docker containers via the socket, Steam game servers, MQTT brokers, gRPC services, and push-based heartbeats for cron jobs and internal workers. Checks run at intervals as tight as 20 seconds - versus UptimeRobot's 5-minute free tier - with unlimited monitors and unlimited data retention. When something fails, alerts fan out through 90+ notification channels: Slack, Discord, Telegram, email with LiquidJS templating, PagerDuty, OpsGenie, ntfy, Gotify, Matrix, and dozens more via native providers plus the Apprise library. Unlimited public or password-protected status pages - mappable to specific domains and organized into monitor groups - communicate health to customers, with maintenance windows that suppress alerts during planned work. The reactive dashboard graphs response times, tracks SSL certificate expiry with advance warnings, supports proxies and 2FA, and ships in dozens of languages. One Docker container with a SQLite volume covers an entire infrastructure.
DAC
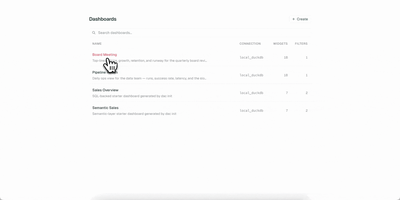
Your dashboards deserve version control, code review, and reproducible builds, just like the rest of your stack. DAC lets you define interactive data dashboards in YAML or TSX, validate them in CI, and serve them from a single Go binary that embeds a full React frontend. Choose from 21 chart types including line, bar, area, pie, scatter, bubble, funnel, sankey, heatmap, calendar, sparkline, waterfall, gauge, treemap, radar, and candlestick, plus metric cards, data tables, text blocks, and image widgets. The built-in semantic layer lets you define metrics and dimensions once in reusable model files, then reference them from any widget while DAC generates the SQL automatically. Connect to Postgres, MySQL, Snowflake, BigQuery, Redshift, Databricks, and DuckDB through standard Bruin connection configs. Interactive filters with date pickers, dropdowns, multiselects, and search inputs inject values via Jinja templating and re-execute only affected widgets. Live reload via Server-Sent Events refreshes connected browsers instantly when you save a file. Export dashboards as self-contained static HTML with baked-in query results for S3, GitHub Pages, or offline sharing, and render slide decks via the Google Slides export command. On RepoCloud, deploy DAC on a dedicated VPS with root SSH access and persistent storage for your dashboard definitions and database connections under the AGPL-3.0 license.

Grafana
The de facto dashboard of observability: Grafana is the open-source frontend that turns the data stores you already run into interactive graphs. It does not store metrics itself; it connects to the data stores you already run and turns their contents into interactive dashboards. Supported sources number over 150 via plugins: Prometheus, Loki, Tempo, InfluxDB, Elasticsearch, MySQL, PostgreSQL, Microsoft SQL Server, AWS CloudWatch, Azure Monitor, Google Cloud Monitoring, and many more. Dashboards are built from a large library of panel types (time series, heatmaps, tables, gauges, logs) with template variables for reusable, parameterized views. Unified alerting evaluates rules against any connected data source, not just Prometheus, and routes notifications to Slack, PagerDuty, email, and other channels with grouping and silencing - unlike Prometheus Alertmanager, a single rule can combine a Loki log pattern, a PostgreSQL query result, and a CloudWatch metric. Dashboards serialize to JSON and data sources configure via provisioning files, so the entire observability setup can live in Git and deploy repeatably across environments. Explore mode adds ad-hoc querying outside dashboards, with split view for correlating a metric spike against the matching log lines, and access control spans organizations, teams, folder permissions, and OAuth, LDAP, and SAML integration. Written in Go and TypeScript, AGPL-licensed. Self-hosting gives you unlimited users, dashboards, and queries at flat hosting cost, without Grafana Cloud's usage-based pricing.
Exceptionless
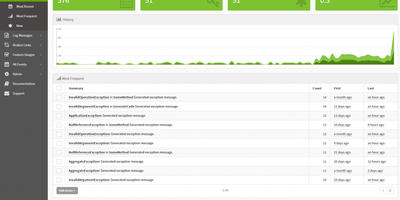
Exceptionless has earned over 2,400 GitHub stars and has been processing production errors since 2014 as the real-time event monitoring platform that captures far more than crashes. Built with ASP.NET Core on Elasticsearch for storage and Redis for caching, Exceptionless ingests exceptions, log messages, feature usage events, broken links, and custom event types through official SDKs for JavaScript, Node.js, .NET Core, ASP.NET, WPF, Web API, WebForms, Console apps, and React Native. Automatic event stacking groups related occurrences by exception type, message, and call stack into single actionable items, while manual stacking keys let developers create custom groupings for specific features or workflows. The real-time dashboard displays Most Frequent, Most Recent, and New event views with filtering by project, date range, environment, and custom tags. Stack management tracks resolution status with version-aware regression detection that automatically reopens resolved issues when the same error surfaces in a newer release. Webhook integrations connect to Slack, Discord, and external services through Zapier for automated issue tracking in GitHub Issues and Jira. Per-project notification settings control email and chat alerts for new errors, regressions, and critical events. OpenTelemetry support captures distributed traces alongside error data. The v8.6.0 release introduced a hosted Model Context Protocol server at the /mcp endpoint, enabling AI tools to query error data via OAuth-authenticated access. Deploy via Docker with the exceptionless/exceptionless image alongside Elasticsearch and Redis. Running on a dedicated VPS on RepoCloud with guaranteed CPU, RAM, and SSD, full root SSH access, and a browser serial console. Apache 2.0 licensed.