BackupX
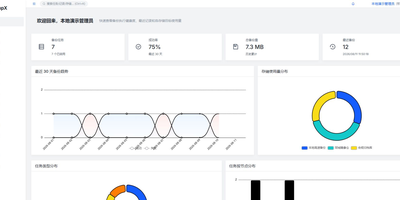
BackupX puts every server backup you are responsible for into one web console, so cron lines scattered across machines become scheduled, visible, and verifiable tasks. Files and directories from multiple sources, MySQL, PostgreSQL, SQLite, SQL Server, and SAP HANA databases all back up on cron schedules you can also build in a visual editor, with automatic retention by days or count cleaning up what expires. More than seventy destinations are reachable through rclone, from S3 and other object stores to Google Drive, WebDAV, FTP, SFTP, Azure Blob, Dropbox, and OneDrive, and storage targets show connection health and live capacity before a job ever fails against a full disk. A master and agent design lets remote servers poll outward only, even through proxies, private certificate authorities, or SSH bastions, so agents run tasks locally with no inbound connectivity to defend. Per-node bandwidth caps and concurrency limits keep a small node polite and a big node busy, each at its own pace. Success and failure notifications arrive by email, webhook, or Telegram, while Prometheus metrics, health probes, an SLA breach gauge, and a full audit log keep the platform observable, and signed audit webhooks forward events to SIEM or WORM storage for compliance records. Running on a dedicated VPS on RepoCloud with guaranteed CPU, RAM, and SSD, full root SSH access, and a browser serial console. Apache-2.0 licensed.
Cachet
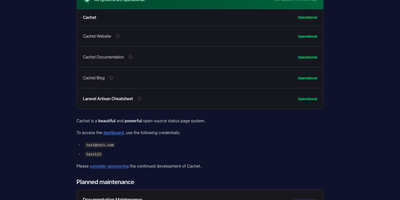
Cachet Core is the open-source engine behind Cachet 3.x status pages, giving your team a self-hosted page where incidents, maintenance windows, component health, and live metrics keep customers informed during downtime. You publish an incident with a name, status, and visibility, then post updates on its timeline as work progresses, and the public page reflects every change immediately. Services become components you can group and mark operational, degraded, partially out, or fully down, so visitors see exactly which part of your platform is affected. Maintenance gets scheduled ahead with its own updates, and subscribers receive notifications when new incidents appear or change. Custom metrics accept data points through the API and render as charts on the page, turning response times or queue depths into public proof of recovery. A JSON API creates and updates incidents from your monitoring stack, and webhooks push incident events to the chat rooms and tools your team already watches. The dashboard handles components, incidents, metrics, subscribers, tags, and user accounts, with status page customization and localization in more than 10 languages. Running on a dedicated VPS on RepoCloud with guaranteed CPU, RAM, and SSD, full root SSH access, and a browser serial console. MIT licensed.
OmniSight
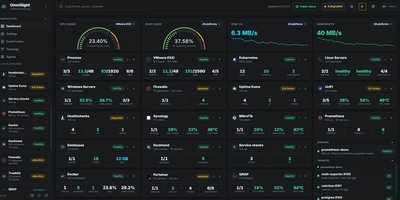
OmniSight ends the homelab ritual of a dozen admin panels open in a dozen tabs, each with its own login and its own idea of what healthy looks like. It folds all of them into one page that answers the only question you actually have: is everything fine? Watch Proxmox nodes with their VMs, containers, backup status, and Ceph health next to VMware hosts and datastores, Linux and Windows servers, and Kubernetes pods with live log viewing. Add Docker hosts and see container status, ports, resource use, and image updates, check OPNsense firewalls, TrueNAS and QNAP storage, and PostgreSQL, MySQL, and MongoDB databases without leaving the dashboard. A small push agent installs with one copied command and self-registers within seconds, needing no inbound firewall rules, so machines behind NAT report in on their own. Follow relationships on the topology map, restart a service from the detail view, export a full backup, and publish a read-only public status page for anyone who asks how things are running. Running on a dedicated VPS on RepoCloud with guaranteed CPU, RAM, and SSD, full root SSH access, and a browser serial console. GPL-2.0 licensed.
Workbench
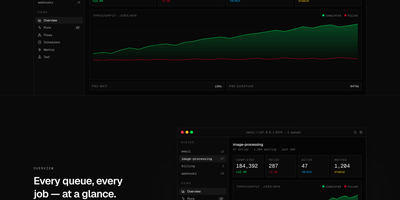
For teams running BullMQ, Workbench makes the inside of your job system visible, searchable, and fixable from a single browser dashboard. Live counters track completed, failed, active, and waiting jobs per queue alongside p50 and p95 latency and throughput, so a backing-up queue announces itself before your users do. Every run sits in a filterable table where you can expand the full payload and attempt history, retry with a keystroke, or click a line in a failed job's stack trace and land on that exact file in your editor. Failures are grouped by error class and ranked by frequency with a 24-hour trend, which makes a fresh regression obvious the moment it spikes. Parent and child jobs render as a real graph you can drill into and replay subtree by subtree, schedulers can be paused or edited without a redeploy, and new jobs can be enqueued from a form that validates the payload first. Running on a dedicated VPS on RepoCloud with guaranteed CPU, RAM, and SSD, full root SSH access, and a browser serial console. MIT licensed.

Saki Panel
Saki Panel is a self-hosted operations console that manages your game servers, containers, and background processes across multiple Linux machines, with an AI assistant sitting inside the workspace when something breaks. Start, stop, restart, and monitor nine kinds of instances, from Minecraft and Steam game servers to Docker containers, Compose stacks, Node and Python apps, and plain shell commands. Remote nodes connect over SSH and report CPU, memory, and disk metrics to a cluster dashboard, so every machine is visible in one place. When an instance crashes, Saki Watch records the exit and its error fingerprint, then helps diagnose the cause from live logs, files, and metrics instead of making you copy text between a terminal and a chat window. Proposed fixes appear as diffs that need your approval, are graded by risk level, and can roll back automatically if verification fails after a patch. Day to day work happens in the same console: a web terminal, a file manager with an editor and archive support, database tools for SQLite, MySQL, PostgreSQL, and Redis, and cron-scheduled tasks with full run history. Role-based access with dozens of permission codes, audit logs, and incident notifications through webhooks or Telegram keep a small team in control. Running on a dedicated VPS on RepoCloud with guaranteed CPU, RAM, and SSD, full root SSH access, and a browser serial console. Apache-2.0 licensed.
Geo-Monitor
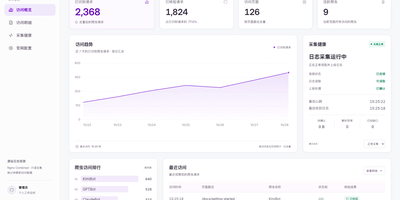
Search is being answered by AI crawlers first and humans second, yet most site owners cannot name a single bot that read their pages last week; Geo-Monitor answers that from the access logs you already have. A small collector sits beside Nginx or OpenResty, mounts the log read-only, and streams only new lines in batches, resuming after outages and surviving log rotation without ever touching your site's code. The console separates today, the last week, and the last month into identified requests, crawled pages, active crawlers, and trend lines, then drills into every visit with time, path, method, status code, claimed identity, and verification state. Identification and verification are deliberately different things here: a user agent only proves what a request claims to be, while a verified badge requires trusted log addresses and official IP evidence to agree. Twenty built-in identities cover OpenAI, Anthropic, Perplexity, Kimi, and Bytespider crawlers, and you can add, edit, or disable rules as new bots appear. Your sitemap syncs or imports as the content catalog, so coverage views show which pages crawlers actually reached, and collector health exposes heartbeat, backlog, and parsing problems. Running on a dedicated VPS on RepoCloud with guaranteed CPU, RAM, and SSD, full root SSH access, and a browser serial console. Apache-2.0 licensed.
Craftsail Growth
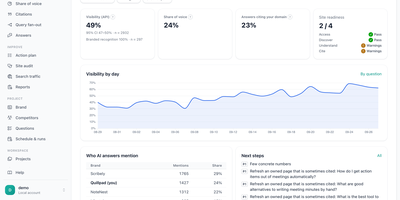
Buyers now ask an AI assistant for recommendations instead of typing a search, and Craftsail Growth shows whether those answers name your brand or a competitor. It puts your buyers' questions to ChatGPT, Claude, Gemini, Grok, Perplexity, DeepSeek, Kimi, Doubao, GLM, and MiniMax through their official APIs several times a day, so visibility per engine and per question carries confidence intervals instead of one vanity number. Share of voice ranks you against the competitors you track with a leaderboard and a trend line. Citation reports sort every cited URL into owned, competitor, review, social, and reference sources next to the web searches the engines actually ran. A site audit works through access, discovery, understanding, and citation in fix order, checking robots rules for AI crawlers, llms.txt, structured data, and answerable content. A ranked action plan blends citations, the audit, and Search Console data, and each accepted action carries an acceptance check that verifies itself on the next run. Creating a project from your website address crawls the site and drafts brand facts, competitors, and buyer prompts for you to review. Google Search Console and GA4 import, generated llms.txt, JSON-LD, and FAQ snippets, scheduled runs, reports, several projects and users, manual sampling sheets, and a dashboard in English, Chinese, and Portuguese round it out. Running on a dedicated VPS on RepoCloud with guaranteed CPU, RAM, and SSD, full root SSH access, and a browser serial console. AGPL-3.0 licensed.
Tunnel Panel
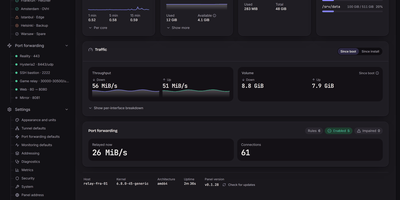
Tunnel Panel manages GRE tunnels and port forwarding on Linux servers from a web panel that previews every change before it runs and verifies the result against the kernel. Create GRE, GRETAP, IP6GRE, and IP6GRETAP tunnels and see the exact commands, unit file, and rollback before anything is applied. The far end configures itself from a pairing code, as text or QR, with the sides flipped automatically so the two ends cannot disagree by a typo. Native ICMP probing with hysteresis keeps a single dropped packet from flapping a tunnel between down and back, and when ICMP is filtered the panel knocks over TCP and says so instead of crying wolf. Forward any TCP or UDP port, or a whole range, with round-robin, source-hash, or weighted balancing across destinations, and a backend that stops answering its health knock leaves the ruleset until it recovers. Watch every connection crossing the relay, who connected, which destination took them, and how much has moved, and set traffic limits per tunnel, rule, or destination. When something breaks, diagnostics reach a verdict with evidence and a suggested fix, backed by a streaming manual probe and a path-MTU search that offers to apply its findings. The panel reads your kernel's relay limits, recommends values from the host's memory and cores, and refuses changes that would lock you out of your own server. Running on a dedicated VPS on RepoCloud with guaranteed CPU, RAM, and SSD, full root SSH access, and a browser serial console. AGPL-3.0 licensed.
Regen
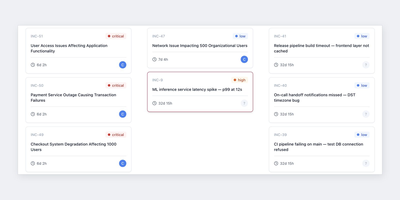
When a production alert fires at 3 a.m., Regen is the self-hosted on-call and incident management platform that makes sure a human answers it, keeping alerts, incidents, schedules, and escalations on one shared timeline instead of split across three tools. Alerts stream in from Prometheus Alertmanager, Grafana, AWS CloudWatch, or any webhook, and deduplication collapses repeat firings before Regen opens an incident automatically; responders can also declare one by hand and let AI draft the title and summary. Layered on-call rotations absorb overrides, holidays, and leave, while multi-step escalation policies with timeouts keep paging the next person until somebody acknowledges, so a critical page never dies in one inbox. The incident timeline syncs to Slack and Microsoft Teams, where bot commands acknowledge, escalate, and post updates without leaving chat, and Telegram notifications cover teams that live there instead. One-click summaries and handoff digests brief the incoming shift, editable postmortem drafts are assembled from the timeline using your own templates, and similar past incidents resurface with what worked last time. AI is bring-your-own-key through OpenAI, Anthropic, or a local Ollama model, and the platform loses nothing core if you never enable it. Schedules and escalation policies import in one click from PagerDuty, Grafana OnCall, or Opsgenie, SAML single sign-on through Okta, Azure AD, or Google Workspace is free, and nothing caps your incidents, schedules, or postmortems. Running on a dedicated VPS on RepoCloud with guaranteed CPU, RAM, and SSD, full root SSH access, and a browser serial console. AGPL-3.0 licensed.
Simon
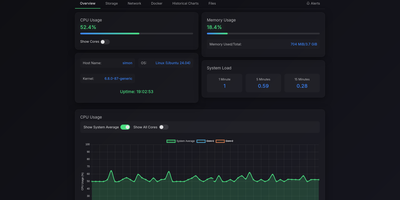
Simon is a lightweight self-hosted system monitor that shows live CPU, memory, disk, and network metrics for your server and its Docker containers in one web dashboard, with threshold alerts and a built-in file browser. Open the dashboard to watch real-time gauges alongside historical charts, so a slow memory leak becomes visible hours before it takes a service down. Every running container appears with its own CPU and memory stats, and its logs open in a searchable viewer, so routine diagnosis never needs a terminal session on the host. The file browser lets you navigate the directories you choose to expose, preview file contents, upload with drag and drop, create folders, and move or delete items. Downloads support range requests, which means large files resume cleanly after a dropped connection and media files stream instead of failing halfway. Alert rules fire when CPU, memory, disk, or network activity crosses thresholds you set, and notifications arrive through Telegram, ntfy, Gotify, Pushover, Pushbullet, Matrix, or any custom webhook. Prebuilt notification templates get common setups running in minutes, and password authentication keeps the dashboard private on a public server. Resource-constrained machines benefit most: the monitor runs comfortably on single-board computers and small instances where heavier monitoring stacks would consume the very memory they exist to watch. Running on a dedicated VPS on RepoCloud with guaranteed CPU, RAM, and SSD, full root SSH access, and a browser serial console. MIT licensed.
Cited
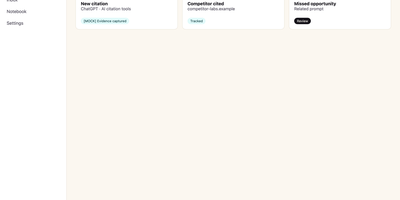
Buyers now ask an AI assistant before they ever visit your website, and Cited tells you whether your brand made it into the answer. Verify your domain with a DNS record, choose the buyer-like prompts worth watching, and Cited checks them on schedule across ChatGPT, Claude, Gemini, Perplexity, Google AI Mode, and Google AI Overviews. Every meaningful appearance becomes a durable evidence note in your citation inbox: open one to see the exact prompt, the response snapshot, where your domain appeared, and the first-seen history. It distinguishes a true source citation from a brand mention without a link, an explicit recommendation, and the uncomfortable one, a missed opportunity where a competitor got cited and you did not. Competitor tracking runs continuously, so you see rivals earning answers in your category while there is still time to respond. Notes can be annotated, organized through new, seen, saved, and resolved states, and exported for reporting. Email alerts flag meaningful new events and a weekly digest summarizes what changed, so checking becomes a habit instead of another dashboard to babysit. Workspace roles and local credentials keep a small marketing team organized on your own PostgreSQL database. Running on a dedicated VPS on RepoCloud with guaranteed CPU, RAM, and SSD, full root SSH access, and a browser serial console. AGPL-3.0 licensed.
InfraCanvas
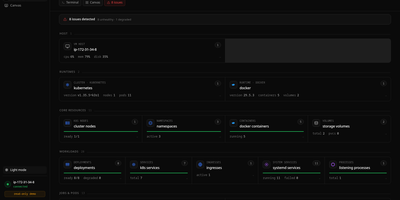
InfraCanvas draws the picture ten terminal commands cannot: a live map in your browser of every container, pod, service, volume and network on a machine, showing what runs where, what talks to what, and what is broken in one glance. Nodes turn green, amber or red from real state, including container health, pod phases, ready replicas, zombie processes and host thresholds, and real connection edges appear between processes, like your app server talking to Postgres on port 5432, read straight from the machine. It works where workloads already live: Docker and Podman containers, full Kubernetes object graphs from nodes to ingresses, LXD and Incus containers, and plain systemd or PM2 services on VMs with no container runtime. From any node you can shell into the container, pod or host, tail logs, restart or stop a service, scale a deployment, run a rolling restart, change an image or kill a process, with secrets masked before anything reaches the screen. A second machine joins through an outbound-only agent, and clusters connect by dropping in a kubeconfig with nothing installed inside them. The self-hosted binary needs no account, sends no telemetry and opens no inbound port: it binds localhost on port 7777 behind a random per-install token, with an optional read-only mode, and every action is audit-logged. Running on a dedicated VPS on RepoCloud with guaranteed CPU, RAM, and SSD, full root SSH access, and a browser serial console. AGPL-3.0 licensed.
OCI Core
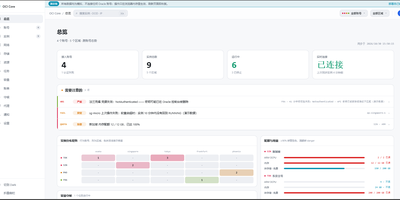
Anyone juggling several Oracle Cloud accounts knows the tab-switching ritual; OCI Core ends it by pulling every tenancy's instances into one self-hosted panel. The cross-account list shows state, shape, volumes, and public IPs for each machine, and you can start, stop, resize, rename, or terminate instances without opening Oracle's console. A creation wizard offers every shape in an availability domain, not just the free presets, while long operations such as IP swaps, resizes, and terminations run as background jobs with visible progress. Capacity hunting watches Oracle's read-only capacity reports and retries creation until a scarce shape appears, notifying you when it lands. Networking tools edit VCNs, subnets, and security rules visually, swap public IPs, enable IPv6, and manage extra network cards. Storage views resize boot and block volumes, and a rescue mode moves a broken system disk to a healthy machine for repair. Billing breaks spend down by service and region, tracks the monthly free egress allowance, and shows real usage for free-tier accounts. Accounts are checked for connectivity, quotas, and credential health, with emails, IPs, and OCIDs masked by default and revealed only on demand. Alerts reach Telegram, WeCom, DingTalk, email, or webhooks, and access is guarded by argon2id passwords, TOTP two-factor sign-in, session controls, and an audit log. Running on a dedicated VPS on RepoCloud with guaranteed CPU, RAM, and SSD, full root SSH access, and a browser serial console. MIT licensed.
Netmon
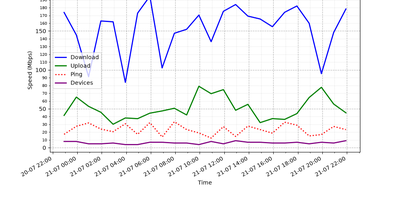
Every half hour, Netmon speed-tests your internet connection, counts the devices on your local network, and reports to your Telegram or Discord with charts and a sarcastic AI-written verdict. Each cycle measures download, upload, ping, ISP, and test server with a single-connection test that mimics one real download, then scans the subnet to tally phones, laptops, and mystery gadgets. Results land in a local SQLite database, building the trend history behind every report. Every four hours you get the full picture: a 24-hour speed graph plus an AI analysis that notices the evening drop, counts the new devices, and names the likely bandwidth hog in plain language. Between reports, short status alerts keep you posted with a simple all-good or line-is-dying. The AI commentary can run on a cloud model or a local one through Ollama or LM Studio, graphs and alerts convert cleanly between Telegram formatting and Discord embeds, and the whole bot runs unattended as a background service. Running on a dedicated VPS on RepoCloud with guaranteed CPU, RAM, and SSD, full root SSH access, and a browser serial console. MIT licensed.
Steward
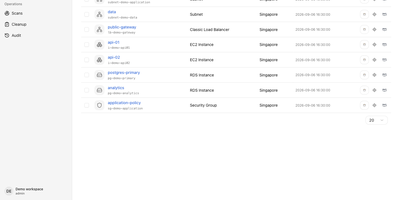
Every cloud account grows the same way: a test instance nobody shut down, a storage bucket from a migration two years ago, a database whose owner left the company. Steward walks all four of your clouds, AWS, Alibaba Cloud, Google Cloud and Microsoft Azure, and writes down what is actually running in one inventory you can search instead of four consoles you half remember. The point is not the list, it is what the list connects to: open any resource and see its relationships, which services depend on it, what shares its network, what breaks if it disappears. Cleanup stops being a leap of faith, because every candidate deletion is reviewed against that dependency map first, showing the impact before execution and following the result of each action afterwards. Scheduled scans keep the picture honest without you remembering to look, reporting exactly which resources each scan added, removed or modified, and pinging Slack, Feishu, DingTalk or WeCom when a scan fails. Connect accounts, including through OIDC, run the first sweep, and the orphaned, idle and forgotten start standing out from the infrastructure you actually need. It runs as a single executable with the web console and database built in, under systemd on your server, behind your HTTPS proxy with token sign-in. Running on a dedicated VPS on RepoCloud with guaranteed CPU, RAM, and SSD, full root SSH access, and a browser serial console. Apache-2.0 licensed.
Netra
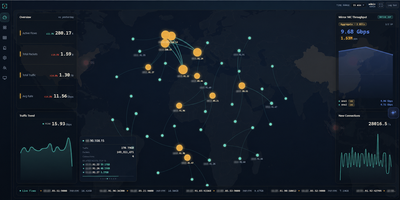
Netra watches your network from the side, plugged into a switch mirror port, and turns everything it sees into a live picture of your traffic without ever sitting in the forwarding path. A single binary loads its eBPF collectors in the kernel, so aggregation happens before packets reach user space and multi-gigabit mirror feeds stay observable instead of dropping samples. The dashboard opens on totals, protocol share, and traffic trends, then lets you drill into flows by address, port, domain, or service, check which countries your traffic talks to on a world map, and read the internal topology as a live graph. Domains surface passively from TLS handshakes, public addresses are enriched with country and organization data, and heuristic detectors flag scanning, flooding, and single-host surges, pushing alerts to your team chat with an optional AI-written explanation. You can ask the built-in assistant questions about real recorded history, connect external MCP servers so it can call your own tools while it answers, and stream flows onward to Kafka for other consumers. History rolls into compressed columnar files on a schedule and stays queryable for a month by default. Running on a dedicated VPS on RepoCloud with guaranteed CPU, RAM, and SSD, full root SSH access, and a browser serial console. GPL-3.0 licensed.
PRISM
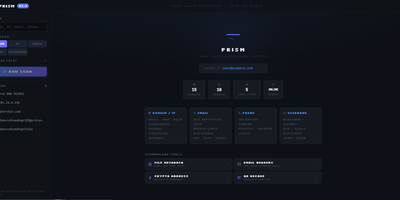
PRISM consolidates passive reconnaissance, credential leak detection, and network asset mapping into a unified operational dashboard to replace fragmented command-line security tools. Analysts can launch simultaneous multi-source investigations against domains, internet protocol addresses, email mailboxes, phone numbers, and online handles to uncover domain registrations, open network ports, cryptographic certificates, and historical web archives. The platform interrogates threat feeds and leak repositories to expose credential leaks, dark web mirrors, and email routing anomalies with automated SMTP mailbox verification. Cross-platform identity engines crawl thousands of social networks and public registries to correlate aliases, discover leaked commit identities, and trace digital footprints across the web. Discovered assets render into interactive entity relationship graphs alongside geographic internet protocol maps to help investigators visualize infrastructure clusters and ownership links. An automated operational security calculator evaluates exposure vulnerabilities across identity, web, and infrastructure vectors, producing an aggregated risk score with granular hardening recommendations. Scheduled watchlists continually monitor target infrastructure, dispatching webhook notifications to chat channels whenever new subdomains, ports, or credential leaks appear. Investigators can export comprehensive audit dossiers as self-contained HTML files, styled PDF documents, or structured spreadsheets. Running on a dedicated VPS on RepoCloud with guaranteed CPU, RAM, and SSD, full root SSH access, and a browser serial console. MIT licensed.
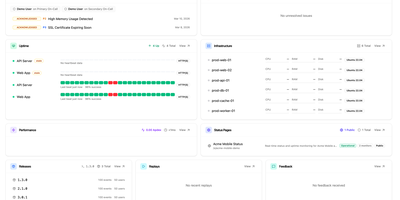
Moneat
Moneat is the open-source observability platform that unifies error tracking, session replay, performance monitoring, logging, uptime checks, synthetics, product analytics, and AI observability into a single self-hosted application — replacing Sentry, Datadog, and Statuspage with one deployment. The Sentry SDK compatibility layer accepts data from @sentry/browser, @sentry/node, @sentry/react, @sentry/nextjs, sentry-sdk for Python, sentry-kotlin, sentry-java, sentry-android, sentry-cocoa, sentry-go, sentry-ruby, and Sentry.NET by updating one DSN endpoint. Datadog Agent compatibility redirects existing fleets by setting dd_url, and native OpenTelemetry OTLP ingestion accepts logs, traces, and metrics from any exporter or Collector. Error monitoring groups exceptions with smart deduplication, session replay records DOM-based user interactions linked to errors, distributed tracing visualizes transaction and span breakdowns with live service maps, and continuous profiling renders flamegraphs in pprof, JFR, and Sentry formats. Uptime monitoring runs HTTP, TCP, and ping checks with public status pages, while synthetics executes API tests, multi-step workflows, SSL checks, and DNS probes. Custom dashboards support drag-and-drop widgets with Grafana import, product analytics provides funnels and retention cohorts, release tracking surfaces crash-free rates with source map upload, and AI observability traces LLM calls end to end. Built on Kotlin and Java with ClickHouse for analytical storage, PostgreSQL for relational data, and Redis for caching, deployment uses Docker Compose with an interactive installer automating secrets and service orchestration. Running on a dedicated VPS on RepoCloud with guaranteed CPU, RAM, and SSD, full root SSH access, and a browser serial console. AGPL-3.0 licensed.