Stars
Forks
Watchers
Developer links
Netra
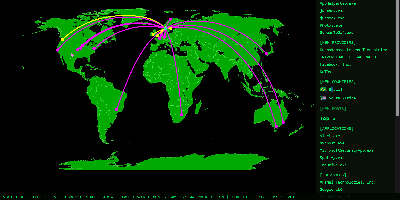
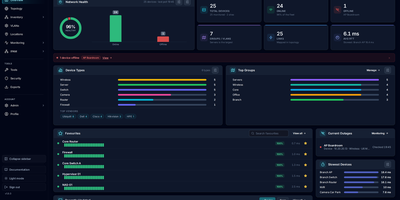
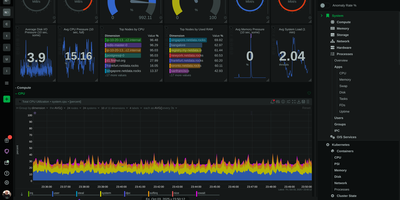
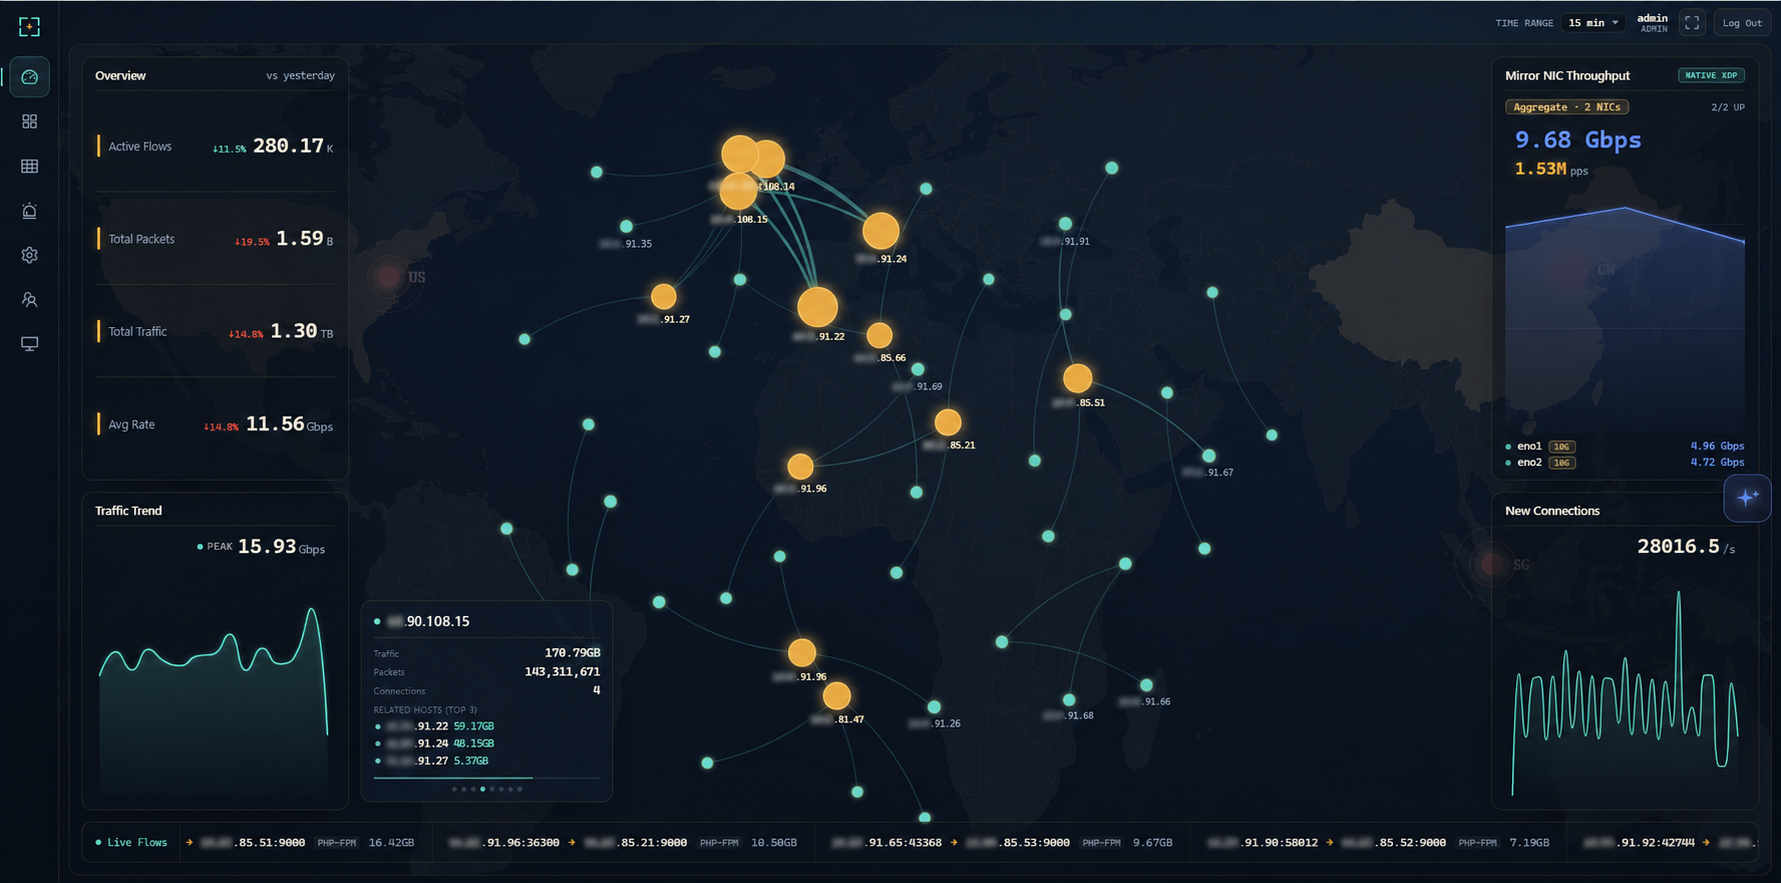
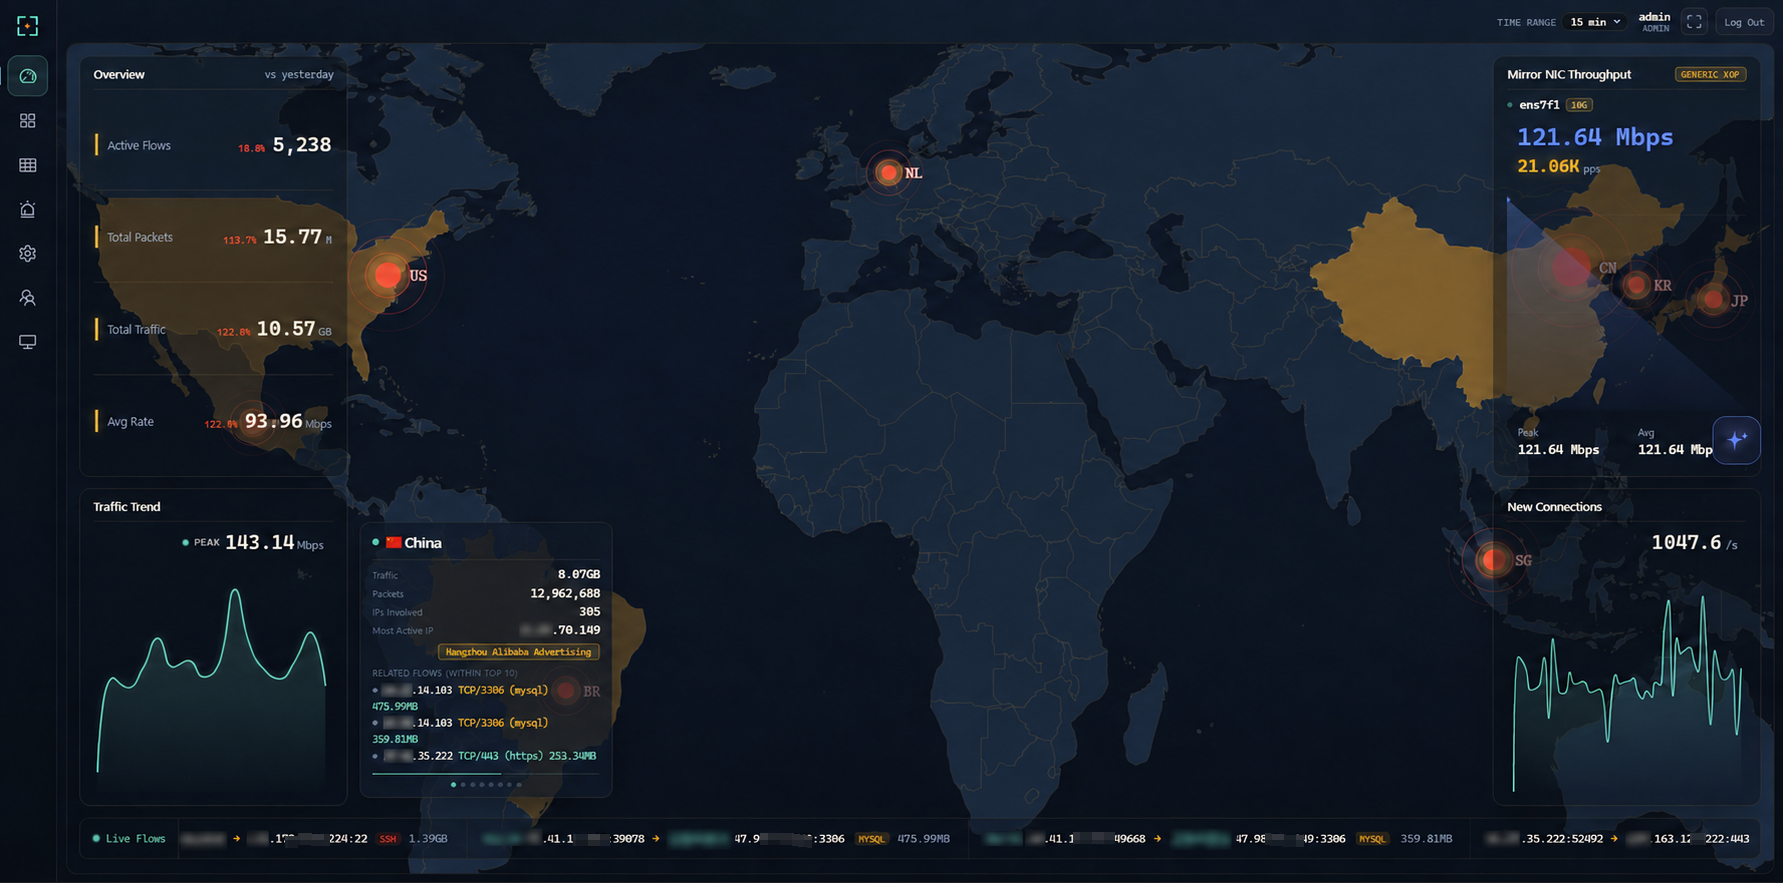
Netra watches your network from the side, plugged into a switch mirror port, and turns everything it sees into a live picture of your traffic without ever sitting in the forwarding path. A single binary loads its eBPF collectors in the kernel, so aggregation happens before packets reach user space and multi-gigabit mirror feeds stay observable instead of dropping samples. The dashboard opens on totals, protocol share, and traffic trends, then lets you drill into flows by address, port, domain, or service, check which countries your traffic talks to on a world map, and read the internal topology as a live graph. Domains surface passively from TLS handshakes, public addresses are enriched with country and organization data, and heuristic detectors flag scanning, flooding, and single-host surges, pushing alerts to your team chat with an optional AI-written explanation. You can ask the built-in assistant questions about real recorded history, connect external MCP servers so it can call your own tools while it answers, and stream flows onward to Kafka for other consumers. History rolls into compressed columnar files on a schedule and stays queryable for a month by default. Running on a dedicated VPS on RepoCloud with guaranteed CPU, RAM, and SSD, full root SSH access, and a browser serial console. GPL-3.0 licensed.
Benefits
- See Traffic Without Touching It
- Netra attaches to a switch SPAN mirror port and reads a copy of your traffic, so the forwarding path never depends on it, and a Netra failure can never take your network down with it.
- Kernel-Speed Collection, One Binary
- XDP programs aggregate packets inside the kernel before user space gets involved, which kept a 10.1 Gbps, 1.6 million packets per second feed lossless while the process used about 3 percent of a 40-core host.
- History That Answers Fast
- Flow history rolls into Parquet files by the hour and is queried by embedded DuckDB, keeping searches across a hundred million recorded flows in the two-to-three-second range with no separate database.
- Ask Your Network Questions
- The built-in assistant answers questions against real recorded traffic through any OpenAI-compatible model, can call tools from external MCP servers over HTTP or stdio while it works, and explains the heuristic alerts it raises.
Features
- Realtime Traffic Console
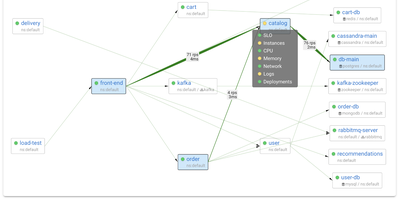
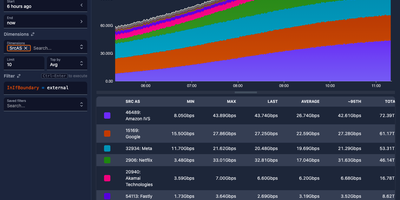
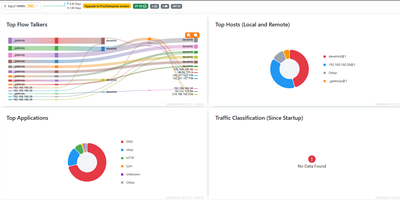
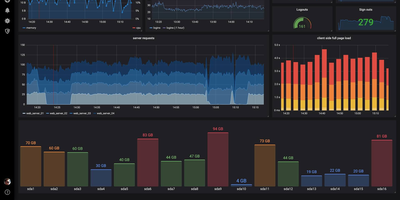
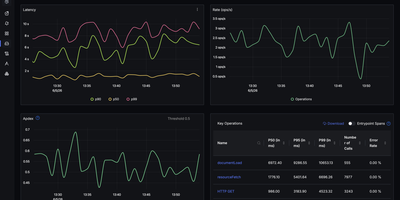
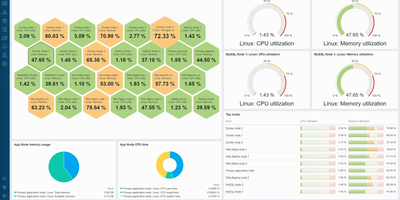
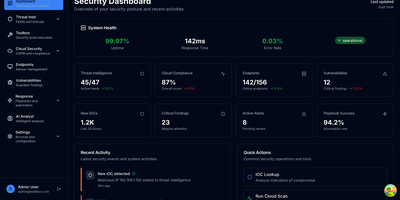
- A web console on port 10211 shows traffic totals, protocol share, trends, top talkers by IP, port, and domain, plus a country world map and live topology graph.
- Threat and Anomaly Heuristics
- Built-in detectors flag port scanning, DDoS-style flooding, and single-IP traffic surges, then push alerts to WeCom, DingTalk, or Feishu, optionally with a natural-language explanation generated by the AI assistant.
- Passive Domain and GeoIP Insight
- Domains are identified passively from TLS SNI without decrypting anything, and public addresses are enriched with MaxMind GeoLite2 country and ASN organization data for the map and flow views.
- MCP-Extensible AI Assistant
- Connect any OpenAI-protocol-compatible model for questions over your traffic history, and attach MCP servers over HTTP or stdio with Basic or Bearer authentication so answers can use your internal tools.
- Kafka Flow Export
- An optional asynchronous Kafka export republishes observed flows to a topic your own pipelines consume, while SQLite holds configuration, users, and alerts beside the DuckDB traffic history.