
Gods Eye View
God's Eye View turns your browser into a real-time spatial intelligence command center, rendering thousands of live aircraft, ships, satellites, earthquakes, traffic flows, and public cameras on a photorealistic 3D Earth powered by CesiumJS and Google Photorealistic 3D Tiles. Click any aircraft to see its transponder telemetry from OpenSky and adsb.lol, including route history, altitude, speed, and callsign; track live vessel positions worldwide through AIS beacon data from AISStream; or follow roughly 840 satellites color-coded by class using orbital elements from CelesTrak. A hands-free voice agent powered by the OpenAI Realtime API lets you ask the planet questions in natural language, and the globe annotates your answer directly in 3D space. Toggle FLIR mode for a thermal camera aesthetic, layer in NASA FIRMS wildfire data, switch between Google 3D, Bing aerial, and OpenStreetMap base layers, or tune into a geolocated world radio dial. Public CCTV cameras are projected into 3D city geometry with viewshed cones and direct-manipulation calibration. The cockpit mode provides a pilot-style briefing surface with mission-specific overlays. Entity inspection panels show detailed metadata for every tracked object, and shareable links let you send any scene configuration to a colleague. Ten of the thirteen live data layers work with zero API keys, while the required Google Maps key offers 1,000 free 3D tile sessions per month. Running on a dedicated VPS on RepoCloud with guaranteed CPU, RAM, and SSD, full root SSH access, and a browser serial console. MIT licensed.
SpiderFoot
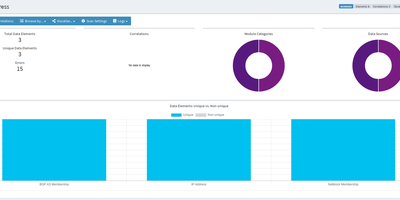
SpiderFoot is an open-source OSINT automation platform, replacing hours of manual reconnaissance with automated intelligence gathering across more than 200 data collection modules. The platform accepts ten distinct target types including IP addresses, domains, hostnames, network subnets, ASNs, email addresses, phone numbers, usernames, person names, and Bitcoin addresses, then feeds them through a publisher-subscriber event bus where each module's findings trigger downstream analysis automatically. SpiderFoot queries Shodan, VirusTotal, HaveIBeenPwned, AlienVault OTX, Censys, crt.sh, WHOIS databases, social media platforms, breach databases, and dozens more sources, with most modules requiring no API keys and many offering free tiers for those that do. The YAML-configurable correlation engine applies 37 pre-defined rules to identify relationships between discovered data points, flagging patterns like shared infrastructure, credential exposure, and domain reputation anomalies. Results export in CSV, JSON, and GEXF graph formats for integration with external analysis tools. TOR integration enables dark web searching, and SpiderFoot can invoke external tools including DNSTwist, Whatweb, Nmap, and CMSeeK for deeper technical assessment. The embedded web server delivers an intuitive dashboard for scan management, data visualization, and result exploration alongside a full command-line interface for scripted automation. Running on a dedicated VPS on RepoCloud with guaranteed CPU, RAM, and SSD, full root SSH access, and a browser serial console. MIT licensed.
OmniRoute
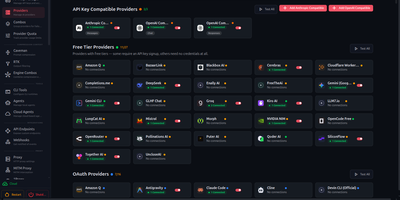
OmniRoute is an AI gateway, aggregating 338 LLM providers including OpenAI, Anthropic Claude, Google Gemini, DeepSeek, Kimi, MiniMax, and GLM into a single OpenAI-compatible endpoint at localhost:20128. The gateway catalogs over 1,200 models across 90 free-tier providers and 40 free-forever providers, automatically rotating through tier-1, tier-2, and tier-3 fallback chains when any provider exhausts its quota or returns errors. RTK plus Caveman stacked token compression reduces eligible context by 15 to 95 percent before forwarding requests, cutting API costs dramatically without degrading output quality. OmniRoute exposes its full routing engine through a built-in MCP server with 104 tools across 31 scopes over stdio, HTTP, and SSE transports, plus an A2A protocol server with six autonomous agent skills and JSON-RPC 2.0 streaming. The gateway integrates directly with Claude Code, Cursor, GitHub Copilot, Codex CLI, OpenCode, and Cline through standard base-URL configuration. Seventeen routing strategies include latency-optimized, cost-minimized, and auto-scoring modes that evaluate candidates on success rate, context fit, model fitness, quota state, and circuit-breaker health. The Next.js dashboard provides real-time provider status, usage analytics, combo chain configuration, and model catalog browsing via a responsive PWA. Running on a dedicated VPS on RepoCloud with guaranteed CPU, RAM, and SSD, full root SSH access, and a browser serial console. MIT licensed.
MindsHub
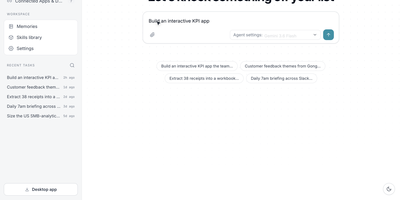
Backed by $50M+ from Benchmark, Y Combinator, and NVIDIA with 800+ contributors and 39,000+ GitHub stars, MindsHub Cowork is the unified AI workspace where open-source models handle entire projects — research, reporting, internal tools, scheduled operations — and return finished, shareable deliverables. The platform runs two interchangeable open-source agent harnesses, Anton and Hermes, swappable from a dropdown without losing context. A built-in Model Router pre-wires 25+ models spanning Anthropic Claude, OpenAI GPT, Google Gemini, DeepSeek, Qwen, Kimi, Grok, and MindsHub Air with automatic failover — no per-provider API keys required. A secure credentials vault connects BigQuery, PostgreSQL, Salesforce, HubSpot, Zendesk, Gong, Gmail, Google Drive, Notion, Linear, Stripe, and Slack, keeping secrets scoped per connection so agents never see raw keys. Agent output becomes publishable artifacts — documents, dashboards, apps, and code — each deployable to a live shareable URL. Cross-session persistent memory, a reusable skill library, and a background scheduler supporting hourly, daily, and weekly cadences enable autonomous recurring workflows. The architecture separates a React/Vite frontend (shipping as both Electron desktop app and web SPA) from a FastAPI backend with a versioned REST API at /api/v1 covering conversations, projects, artifacts, schedules, and connectors. Self-host via Docker Compose with nginx on port 3000 and the API on port 26866, or deploy on-prem, in a VPC, or air-gapped. Running on a dedicated VPS on RepoCloud with guaranteed CPU, RAM, and SSD, full root SSH access, and a browser serial console. MIT licensed.
Matomo
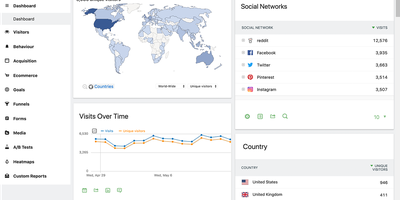
Several EU data protection authorities have ruled Google Analytics deployments unlawful; Matomo (formerly Piwik) is the most complete open-source replacement - a full analytics platform with 30+ report types across visitors, actions, referrers, goals, and ecommerce. The self-hosted PHP/MySQL edition is free and keeps every byte of visitor data on your infrastructure, which matters more each year: several EU data protection authorities have ruled Google Analytics deployments unlawful, while Matomo configured for cookieless tracking is approved by France's CNIL for use without a consent banner. All reporting runs on 100% unsampled data - no extrapolation at high traffic volumes. The GDPR Manager handles data subject requests and deletion, with IP anonymization, retention controls, and Do Not Track support built in. A dedicated importer pulls your historical Google Analytics data so years of trends survive the migration. Core analytics cover campaigns, custom variables and dimensions, entry/exit pages, downloads, site search, and full ecommerce tracking with a comprehensive HTTP API for reporting and ingestion. Premium plugins extend the platform into Hotjar-class behavioral tooling - click and scroll heatmaps, session recordings, conversion funnels, form analytics, A/B testing - plus a tag manager and SAML SSO. For teams that need GA-equivalent depth with actual data ownership, Matomo is the realistic drop-in replacement.
Briefer
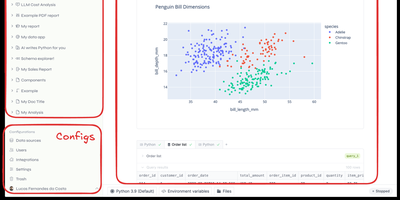
Backed by Y Combinator with 4,300 GitHub stars and growing rapidly since its September 2024 launch, Briefer delivers the first truly unified notebook-and-dashboard platform that eliminates the fragmented workflow of juggling Jupyter for analysis, Tableau for visualization, and Notion for documentation — combining all three in a single Notion-like workspace where SQL query results automatically become Python DataFrames accessible in subsequent code blocks. The built-in AI analyst understands your database schema and notebook context to generate SQL queries, write Python transformations, create visualizations, and fix errors on demand using configurable OpenAI or private LLM backends. Connect directly to PostgreSQL, MySQL, BigQuery, Redshift, Snowflake, and Amazon Athena as data sources, or upload CSV files for immediate analysis. Native point-and-click visualizations produce charts, tables, and dashboards without writing code, while interactive data apps use inputs, dropdowns, and date pickers to create parameterized reports for non-technical stakeholders. Scheduled execution runs notebooks and dashboards periodically with results delivered via Slack integration or public shareable links. Write-back queries modify production data directly from notebooks for ad-hoc pipeline testing. The architecture runs as three Docker containers — web frontend, API server, and optional AI service — backed by PostgreSQL and a Jupyter server for Python execution, deployable via single Docker command, Docker Compose, or Helm charts for Kubernetes. Running on a dedicated VPS on RepoCloud with guaranteed CPU, RAM, and SSD, full root SSH access, and a browser serial console. AGPLv3 licensed.
FastGPT
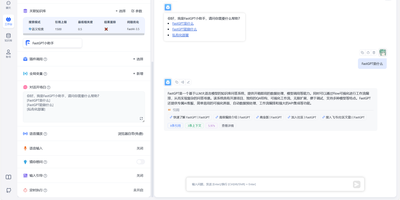
FastGPT lets you build production AI agents and knowledge base chatbots through a visual drag-and-drop workflow editor, connecting any LLM provider to your documents with retrieval-augmented generation that cites sources and reduces hallucination. The workflow canvas chains LLM calls, conditional branching, HTTP requests, code sandbox execution, and plugin nodes into complex conversation flows and agent skill pipelines without writing backend code. The knowledge base engine ingests documents in ten formats (TXT, Markdown, HTML, PDF, DOCX, PPTX, CSV, XLSX, URL scraping, and CSV batch import) then applies automatic chunking, hybrid vector retrieval with semantic reranking, and QA-pair splitting to deliver accurate, citation-backed answers. FastGPT connects to virtually any LLM provider through its AI Proxy aggregation layer: OpenAI GPT-4o, Anthropic Claude, Google Gemini, DeepSeek, Qwen, ERNIE Bot, and models hosted via Ollama all work through a unified OpenAI-compatible API. Bidirectional MCP support enables agents to call external tools and expose their own capabilities to other systems. Completed applications can be shared via login-free links, embedded as iframe widgets, or integrated with WeCom, Lark, DingTalk, and WeChat Official Accounts through the published REST API. Application operation logs, conversation annotation, and per-model usage analytics provide full lifecycle governance for compliance-sensitive deployments. Running on a dedicated VPS on RepoCloud with guaranteed CPU, RAM, and SSD, full root SSH access, and a browser serial console. FastGPT Open Source License (Apache 2.0 based) licensed.
QwenPaw
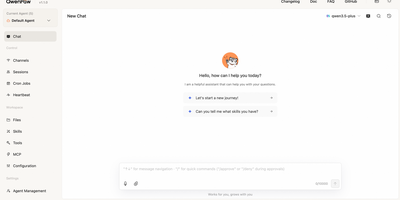
Designed as a unified personal AI workstation, QwenPaw operates as an autonomous digital copilot that coordinates scheduled automations, interactive coding sessions, and multi-channel team communication across everyday messaging apps. Users can dispatch long-running research tasks, process office documents including PDF, Excel, and Word files, and execute browser-based data collection without manual intervention. The built-in web console and terminal interface provide full visibility into agent reasoning, allowing operators to inspect intermediate thinking steps, review proposed file edits, and approve sensitive tool calls. Through direct connectors for Discord, Telegram, DingTalk, Lark, and WeChat, teams can trigger specialized skills or query shared workspaces directly from their existing group channels. A self-evolving personal memory system continuously indexes chat interactions and local resources into editable Markdown files, ensuring knowledge persists across restarts and task delegations. Built-in guardrails including a sandboxed execution runtime, tool access policies, and automated skill scanners protect underlying host files from unauthorized modifications during autonomous scripting runs. Running on a dedicated VPS on RepoCloud with guaranteed CPU, RAM, and SSD, full root SSH access, and a browser serial console. Apache 2.0 licensed.
Local Deep Research
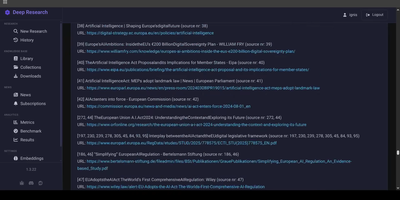
Execute comprehensive multi-angle investigations across scientific journals and web repositories using Local Deep Research, an autonomous intelligence engine designed for researchers, analysts, and knowledge workers. Users can submit complex analytical questions through a self-hosted web console to initiate agentic research cycles powered by LangGraph workflows. The application dynamically queries search providers including SearXNG, arXiv, PubMed, Wikipedia, and Google, iteratively evaluating discovered content to formulate targeted follow-up queries. Discovered academic papers and web sources can be indexed into an encrypted personal library to combine internal documentation with external search intelligence. Reports are synthesized with structured outlines, section headings, and verifiable academic citations that link directly to source references. Individual research sessions, system logs, and user credentials remain isolated in per-user SQLCipher databases protected by AES-256 encryption. Automated subscriptions deliver scheduled news digests and topic monitoring summaries directly to connected notification channels. Running on a dedicated VPS on RepoCloud with guaranteed CPU, RAM, and SSD, full root SSH access, and a browser serial console. MIT licensed.
IRONSIGHT
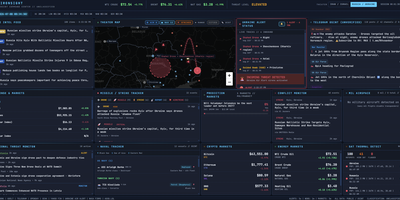
IRONSIGHT fuses over 50 publicly available intelligence sources into a single real-time dashboard that requires zero API keys and zero configuration. The Live Intel Feed aggregates 20+ RSS news sources with keyword relevance filtering from outlets including Reuters, Al Jazeera, and Kyiv Post. The Telegram OSINT module scrapes 27 channels every 60 seconds with automatic translation from Hebrew, Arabic, and Farsi. The interactive Leaflet Theater Map plots military aircraft positions via ADS-B transponder data, naval vessel locations in the Persian Gulf and Eastern Mediterranean, strike markers extracted from news and Telegram, missile trajectory arcs with range rings, and country-border overlays with a distance measurement tool. A header toggle switches the entire dashboard between Iran/Israel and Russia/Ukraine theaters, re-pointing every panel, map layer, and data feed to the selected conflict. The Israel Alert module streams live Pikud HaOref missile alerts with audio notifications, while the Conflict Monitor categorizes events into strikes, defense, diplomatic, and nuclear. Financial panels track defense contractor stocks, S&P 500, VIX, gold, Bitcoin, Ethereum, energy commodities via Yahoo Finance, and Polymarket prediction odds on conflict outcomes. NASA FIRMS satellite thermal detection flags fire and explosion signatures. The Next.js 16 App Router handles server-side data fetching for RSS and API endpoints while client-side React state management drives real-time polling updates. On RepoCloud, deploy IRONSIGHT on a dedicated VPS with persistent storage, root SSH access, and full control over your intelligence monitoring environment, all under the MIT license.
CubeJS
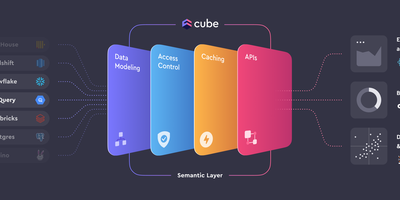
Between your databases and everything that consumes data - BI tools, embedded analytics, AI agents - sits Cube (formerly Cube.js), an open-source semantic layer. Metrics, dimensions, joins, and access rules are defined once as code in YAML, JavaScript, or Python, forming a governed data model that every downstream consumer shares, so "revenue" means the same thing in every dashboard. Caching is two-level: an in-memory cache absorbs bursts of identical queries, and declared pre-aggregations - rollup tables built in the warehouse or in Cube Store, Cube's distributed columnar engine, and refreshed in the background - deliver sub-second latency while cutting warehouse compute costs. The query planner routes each request to cache, rollup, or source automatically. Consumers connect through a Postgres-compatible SQL API (any tool that speaks Postgres works), plus REST, GraphQL, and a Meta API for model introspection. Row-level security and multi-tenancy are enforced in the layer itself, upstream of every client. Sources include Snowflake, BigQuery, Databricks, Postgres, MySQL, Presto, and Athena. Headless by design - bring your own UI.
Redash
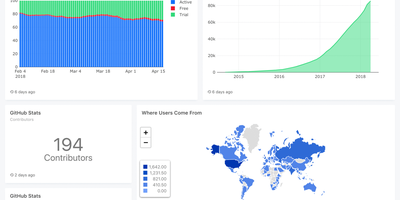
Used by millions of users at thousands of organizations worldwide and holding 29,000+ GitHub stars, Redash is the most established open-source SQL-first business intelligence tool — enabling anyone from analysts to executives to query databases, visualize results, and share dashboards without writing a single line of application code. The browser-based query editor supports SQL and NoSQL with schema browsing, auto-complete, query snippets, and parameterized queries that turn static reports into interactive data applications. Native connectors span 35+ data sources including PostgreSQL, MySQL, Amazon Redshift, Google BigQuery, Snowflake, ClickHouse, MongoDB, Elasticsearch, Databricks, Apache Presto, Microsoft SQL Server, and REST APIs — with an extensible data source API for custom integrations. Visualization types cover line, bar, area, pie, scatter, box plot, funnel, cohort, sankey, sunburst, choropleth map, and pivot tables, all draggable onto shared dashboards with cross-filtering parameters. Scheduled refreshes automatically update query results at configurable intervals, while threshold-based alerts notify teams via email, Slack, or webhook when metrics cross defined boundaries. SAML and Google OAuth SSO integration, role-based access control, API key management, and query-level permissions ensure enterprise-grade security for sensitive datasets. The self-hosted stack deploys via Docker Compose with PostgreSQL for metadata storage, Redis for job queuing, and Celery workers for background task execution. Running on a dedicated VPS on RepoCloud with guaranteed CPU, RAM, and SSD, full root SSH access, and a browser serial console. BSD 2-Clause licensed.
TencentDB Agent Memory
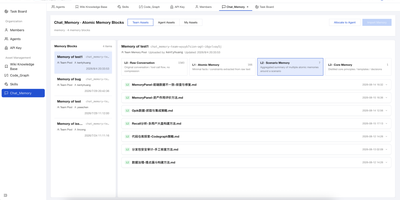
TencentDB Agent Memory provides a team-level memory hub that transforms AI agent conversations, documents, and codebases into four governed, shareable memory assets: Chat Memory for conversation history, Skills extracted from completed tasks, LLM-Wiki built from document ingestion, and Code-Graph generated from codebase analysis. The four-tier semantic pyramid structures long-term memory from L0 raw conversation capture through L1 episodic extraction and L2 scenario aggregation to L3 persona synthesis, enabling hierarchical drill-down via node and result references instead of flat vector recall. The Node.js Gateway sidecar handles capture, extraction, storage, recall, and pipeline scheduling through RESTful HTTP v2 endpoints on port 8420, while the Memory Proxy intercepts Anthropic-format API calls to inject team memory context into Claude Code, CodeBuddy, and other coding agents transparently. Local SQLite with the sqlite-vec extension provides the default storage backend with hybrid BM25 keyword plus vector embedding plus reciprocal rank fusion retrieval requiring zero external API dependencies. Teams manage ownership, versions, status, visibility, usage counts, and agent bindings through the Memory Hub dashboard with role-based access control separating System Admin and team-level Admin and Member permissions. Official TypeScript and Python SDKs provide programmatic access for custom framework integration beyond the built-in OpenClaw plugin and Hermes Agent adapter. Running on a dedicated VPS on RepoCloud with guaranteed CPU, RAM, and SSD, full root SSH access, and a browser serial console. MIT licensed.
Agent Zero
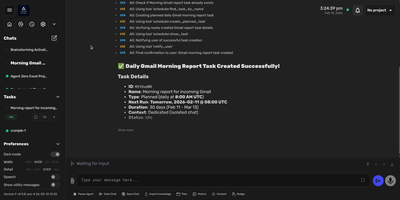
Agent Zero equips large language models with a persistent virtual Linux desktop, letting autonomous AI agents write code, research the web, and execute multistep tasks without supervision. Operating within an isolated container, the system opens an interactive XFCE graphical desktop in your browser canvas where the agent interacts with GUI applications like Blender and terminal sessions directly. Its embedded browser features interactive annotation tools, letting you click web elements to inspect stylesheet hierarchies, extract component markup, or submit automated testing instructions. You can cowork on spreadsheets, presentations, and Markdown specifications in real time alongside the agent, preserving document revisions through snapshot time travel. A multi-tier memory architecture backed by FAISS vector indexing and SearXNG web discovery retains problem-solving context across projects, while hierarchical delegation spins up specialized subordinate agents to parallelize complex engineering audits. The platform connects seamlessly to commercial LLMs via OpenAI, Anthropic, or OpenRouter, runs private local models through Ollama, and integrates custom toolkits via the Model Context Protocol and community Plugin Hub. Running on a dedicated VPS on RepoCloud with guaranteed CPU, RAM, and SSD, full root SSH access, and a browser serial console. MIT licensed.
GitNexus
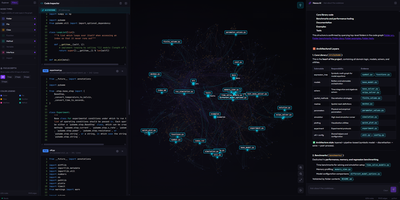
GitNexus turns any codebase into an interactive knowledge graph that maps every dependency, call chain, functional cluster, and execution flow, giving AI coding assistants the deep structural awareness they need to stop breaking things. Drop a repository URL or ZIP file into the browser-based explorer and watch Tree-sitter parsers decompose your code into a navigable property graph you can zoom, click, and query. The MCP server integrates directly with Cursor, Claude Code, Codex, Antigravity, and other editors through 16 specialized tools covering architectural queries, impact analysis, safe multi-file renames, change detection, and cross-repo contract matching. Need to know the blast radius before touching a shared utility? The impact analyzer traces every caller, implementer, and downstream consumer in milliseconds. Teams reviewing pull requests get automated blast-radius annotations powered by the same graph. The registry architecture lets a single MCP server manage multiple indexed repositories simultaneously, so switching between projects requires zero re-indexing. For visual exploration, the web interface renders interactive community-clustered graphs where you can trace execution paths, browse file trees, and chat with an AI agent grounded in the graph's structural data rather than raw file snippets. Everything runs locally; your source code never leaves the machine. Running on a dedicated VPS on RepoCloud with guaranteed CPU, RAM, and SSD, full root SSH access, and a browser serial console. PolyForm Noncommercial 1.0.0 licensed.
Doccano
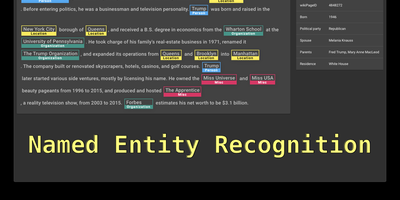
Doccano is a text annotation platforms for building machine learning training datasets. The web-based interface supports text classification for sentiment analysis and document categorization, sequence labeling for named entity recognition with overlapping entity support and relation extraction between labeled spans, and sequence-to-sequence annotation for text summarization and machine translation pairs. Collaborative annotation enables multiple annotators to work on the same project simultaneously with per-user progress tracking, annotation guidelines, example assignment to specific members, and filtering by assignee. Auto-labeling integrates with external machine learning model APIs through configurable request and response mapping templates, allowing pre-annotation that annotators can review and correct. Data import accepts plain text, JSONL, CoNLL, and Excel formats, while export produces JSONL and CoNLL datasets compatible with spaCy, Hugging Face Transformers, PaddleNLP, and other training frameworks through the doccano-transformer library. The Django backend with Django REST Framework exposes a complete RESTful API for programmatic project creation, dataset management, and annotation retrieval via the official doccano-client Python library. Celery handles background tasks including dataset import and export processing with Flower providing task monitoring. One-click deployment supports AWS CloudFormation and Heroku alongside Docker Compose for self-hosted environments. Running on a dedicated VPS on RepoCloud with guaranteed CPU, RAM, and SSD, full root SSH access, and a browser serial console. MIT licensed.
big-AGI
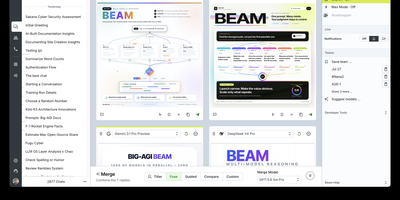
big-AGI is an open-source generative AI workspace that provides a unified, local-first interface for orchestrating multi-model reasoning, automated code execution, and custom persona workflows across private infrastructure. Users query multiple large language models simultaneously through the Beam scatter-gather engine, which prompts independent AI systems in parallel, compares candidate completions side by side, and merges optimal passages into a single refined response. Knowledge workers assemble tailored AI personas equipped with specialized system instructions, custom temperature settings, and predefined document context to handle domain-specific tasks ranging from architectural design reviews to legal contract analysis. The application renders rich multimedia outputs including interactive Mermaid sequence diagrams, LaTeX mathematical formulas, syntax-highlighted code blocks with live execution previews, and AI-generated image generation canvases. Teams integrate local inference servers like Ollama and LocalAI alongside commercial API endpoints to route confidential datasets strictly through internal networks while monitoring per-prompt token usage and operational latency. Users attach complex PDF documents, spreadsheets, and source code repositories for automatic parsing and semantic retrieval, while local-first storage engines ensure private chat transcripts and custom presets remain encrypted on host drives. Running on a dedicated VPS on RepoCloud with guaranteed CPU, RAM, and SSD, full root SSH access, and a browser serial console. MIT licensed.
DAC
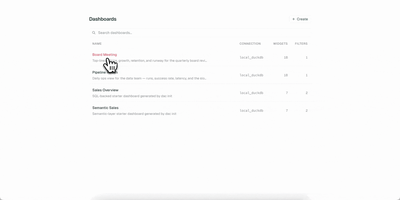
Your dashboards deserve version control, code review, and reproducible builds, just like the rest of your stack. DAC lets you define interactive data dashboards in YAML or TSX, validate them in CI, and serve them from a single Go binary that embeds a full React frontend. Choose from 21 chart types including line, bar, area, pie, scatter, bubble, funnel, sankey, heatmap, calendar, sparkline, waterfall, gauge, treemap, radar, and candlestick, plus metric cards, data tables, text blocks, and image widgets. The built-in semantic layer lets you define metrics and dimensions once in reusable model files, then reference them from any widget while DAC generates the SQL automatically. Connect to Postgres, MySQL, Snowflake, BigQuery, Redshift, Databricks, and DuckDB through standard Bruin connection configs. Interactive filters with date pickers, dropdowns, multiselects, and search inputs inject values via Jinja templating and re-execute only affected widgets. Live reload via Server-Sent Events refreshes connected browsers instantly when you save a file. Export dashboards as self-contained static HTML with baked-in query results for S3, GitHub Pages, or offline sharing, and render slide decks via the Google Slides export command. On RepoCloud, deploy DAC on a dedicated VPS with root SSH access and persistent storage for your dashboard definitions and database connections under the AGPL-3.0 license.