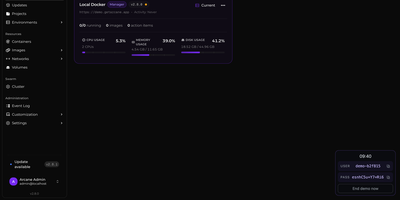
Arcane
Arcane gives you a single polished dashboard to manage Docker containers, images, volumes, networks, and Compose projects across unlimited remote hosts. The SvelteKit frontend paired with a Go backend delivers real-time resource monitoring with historical graphs, container lifecycle controls including shell exec and live log streaming, and one-click Docker Compose deployment with Git repository synchronization for version-controlled stack definitions. The manager-agent architecture connects remote environments via Direct TCP on port 3553 or Edge mode where agents initiate outbound gRPC/WebSocket connections through NAT and firewalls without requiring inbound ports, all secured with mTLS certificates. Vulnerability scanning identifies security issues in running container images directly from the interface. The backup system enables scheduled container snapshots with configurable retention for disaster recovery. Network and volume administration includes visual relationship mapping between services, and the responsive interface supports dark/light themes with full mobile optimization and community-driven internationalization via Crowdin. 6,500+ stars and 89 releases since April 2025 reflect a rapid development cadence. Running on a dedicated VPS on RepoCloud with guaranteed CPU, RAM, and SSD, full root SSH access, and a browser serial console. BSD-3-Clause licensed.
DragonflyDB
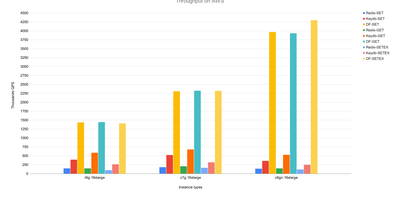
With over 30,000 GitHub stars and benchmarks showing 25x the throughput of single-threaded Redis, DragonflyDB is a modern in-memory data store that eliminates the need for complex Redis Cluster deployments by fully utilizing every CPU core on a single machine. Its shared-nothing, thread-per-core architecture written in C++ supports over 200 Redis commands and 13 Memcached commands, making it a true drop-in replacement that requires zero application code changes. A single DragonflyDB instance scales vertically from 8GB to 768GB of RAM across up to 64 cores, replacing entire Redis Cluster topologies with one process while maintaining full compatibility with Strings, Hashes, Lists, Sets, Sorted Sets, Streams, JSON, and Bloom Filters. The novel dashtable data structure and cache eviction algorithm achieve higher hit rates than LRU and LFU with zero memory overhead per entry. Forkless point-in-time snapshotting eliminates the memory spikes associated with Redis BGSAVE, while automatic backup scheduling via cron syntax supports both local disk and AWS S3 cloud storage. Primary-replica replication follows the Redis replication protocol up to version 6.2, and Prometheus-compatible metrics at the default port enable Grafana monitoring dashboards out of the box. DragonflyDB also exposes an HTTP admin interface on its main TCP port for operational monitoring. Running on a dedicated VPS on RepoCloud with guaranteed CPU, RAM, and SSD, full root SSH access, and a browser serial console. BSL 1.1 licensed.
portracker
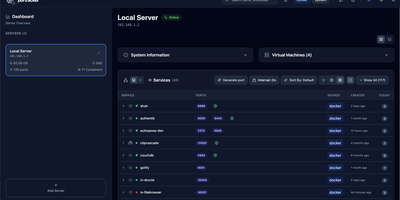
No spreadsheet has to track which service owns which port, because portracker discovers every service and port on your servers and keeps the list current from a self-hosted dashboard. Begin with a single port, shown with its owning service, its source (Docker or the host system), and its address, with internal container ports told apart from ports published to the host. Step back and ports gather into services: expandable cards carrying an icon, a health dot, and a port count, in list, grid, or table layouts, where a Why this status popover names the failing component and the rule that fired. Step back again and each server gets its own panel with hostname, OS, CPU, memory, and uptime, plus TrueNAS apps, VMs, and LXC containers once an API key is added. Step back once more and the whole fleet appears, because other portracker instances can be linked as peers, a VM's instance can be nested under its host, and every server can be searched at once. Along the way, rename services, hide the noisy ones, attach notes, act on a selection in bulk, or press Generate port for an unused number before deploying something new. Optional sign-in with a first-run setup wizard, an autoxpose link that shows public URLs and SSL status, light and dark themes, and keyboard shortcuts finish the picture. Running on a dedicated VPS on RepoCloud with guaranteed CPU, RAM, and SSD, full root SSH access, and a browser serial console. MIT licensed.
Rackpad
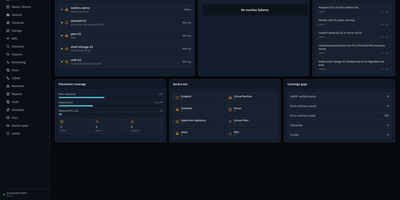
Every cable, switch port, VLAN, and rack unit in a homelab or small server room gets a documented place in Rackpad, a self-hosted inventory and operations workspace. Rack elevations show mounted gear, including paired half-width appliances. Switch-panel port maps and aggregate ports show what is patched where. Cables carry type, length, and color, editable in bulk. VLANs, subnets, DHCP scopes, reservations, and zones sit in one Networks workspace, with gateway and DNS protection and a mismatch review for IP assignments. Storage topology follows drives, bays, and pools that span several devices. Wi-Fi controllers, access points, hypervisor hosts, and virtual machines have pages of their own, and Proxmox and Hyper-V hosts can be imported after review. Discovery scans a subnet or any CIDR and stages every finding in an inbox. Per-device checks over ICMP, TCP, HTTP, HTTPS, and SNMP raise alerts by email, Discord, or Telegram. Everything feeds a movable topology map. Markdown runbooks attach to devices, and an audit log records every change. Admin, editor, and viewer roles control access, and OpenID Connect login is optional. Running on a dedicated VPS on RepoCloud with guaranteed CPU, RAM, and SSD, full root SSH access, and a browser serial console. MIT licensed.
NotifKit
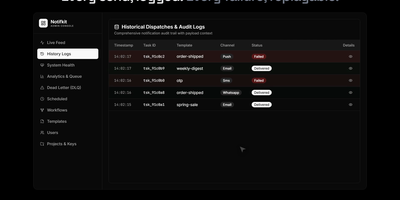
One notify() call is all your product needs to reach users on push, email, SMS, chat, and webhooks, with NotifKit deciding how and when each message travels. List the channels in the order you prefer and NotifKit tries each in turn, so a failed push quietly becomes an SMS or an email instead of a lost message. Per-user preferences, consent, and quiet hours in each user's own timezone hold non-urgent sends until morning, while critical messages such as one-time passwords travel their own lane immediately. Templates, multi-step workflows that wait days or block on events, scheduling, throttling, and deduplication all run behind that single call, defined in TypeScript and kept in your repository. Delivery logs record every attempt, and the admin dashboard shows a live activity feed, queue depth per priority lane, workflow runs step by step, and a replayable dead-letter queue. Several products can share one deployment as separate projects with their own API keys, rate limits, and data, and any service can call the REST API without the TypeScript SDK. Ask an AI assistant why a password reset never arrived by connecting the built-in MCP server to Claude Code, Cursor, or another MCP client. Running on a dedicated VPS on RepoCloud with guaranteed CPU, RAM, and SSD, full root SSH access, and a browser serial console. MIT licensed.
Zoomies
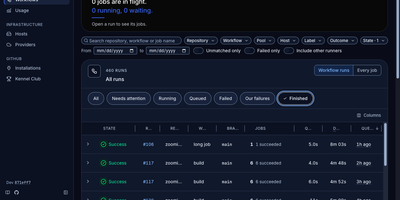
Zoomies converts servers you already own into an ephemeral GitHub Actions runner fleet, creating a clean runner for every queued job and destroying it the moment that job ends. Why rent CI minutes by the second while those machines sit idle? Point it at a GitHub organisation or a repository on a personal account and it watches for queued work through workflow_job webhooks, with polling as a fallback, then provisions capacity only on hosts matching the labels your workflow requested. One controller drives any number of agents across Ubuntu, Debian, Fedora, and Rocky Linux on amd64 and arm64, and agents connect outbound only, so a host behind NAT needs no inbound firewall rule. Registration needs no pasted tokens: Zoomies signs in as a GitHub App and mints single-use just-in-time runner registrations itself. Busy runners can borrow idle CPU and memory from quieter neighbours under rules you set. The live web UI shows pools, jobs, queue waits, and streaming logs in place, with a command palette for jumping anywhere and an audit row recorded for every change. Nightly backups seal themselves with your passphrase and ship to S3-compatible storage, restores are staged from the same tab, and you can ask the built-in assistant about your builds or connect your own tools through MCP. Running on a dedicated VPS on RepoCloud with guaranteed CPU, RAM, and SSD, full root SSH access, and a browser serial console. AGPL-3.0 licensed.
Ory Hydra
Ory Hydra is an OpenID Certified OAuth 2.0 and OpenID Connect provider that plugs into any existing user database or authentication system through a headless consent and login bridge, letting you own your authorization infrastructure without rebuilding identity management from scratch. The Go binary ships at under 15MB with zero system dependencies and exposes two distinct API surfaces: a public endpoint on port 4444 handling authorization code flows, token exchanges, PKCE challenges, device authorization grants per RFC 8628, and OpenID Connect discovery, plus an admin endpoint on port 4445 managing client registration, token introspection, consent session lifecycle, and JWKS rotation. Access tokens can be issued as opaque reference tokens or signed JWTs for stateless validation at resource servers, while refresh token rotation, token revocation per RFC 7009, and pairwise subject identifiers provide granular security controls. Persistent storage spans PostgreSQL, MySQL, and CockroachDB with automatic schema migrations, and the architecture supports horizontal scaling behind load balancers with shared database state. Dynamic client registration per RFC 7591 enables automated provisioning, and the OAuth 2.0 Threat Model security considerations are implemented as default behaviors rather than optional add-ons. Trusted by OpenAI and other internet-scale platforms. Helm charts and Docker Compose quickstarts provide production-ready deployment paths alongside the broader Ory ecosystem including Kratos for identity management, Oathkeeper for zero-trust API proxying, and Keto for fine-grained permissions. Running on a dedicated VPS on RepoCloud with guaranteed CPU, RAM, and SSD, full root SSH access, and a browser serial console. Apache 2.0 licensed.
Uncloud
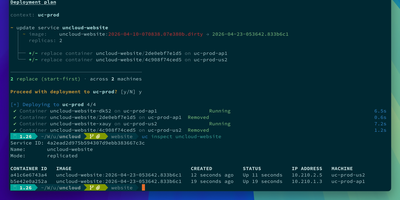
Scatter a few cheap VPS boxes, a home server, and one bare metal machine across three different providers, and Uncloud still treats them as a single place to run your applications. You describe services in ordinary Docker Compose files, deploy them with the uc command line tool, and publish any container port as a public HTTPS endpoint in a single command. Every machine joins an encrypted WireGuard mesh with its own container IP addresses, so services on different continents reach each other directly without VPN configuration or exposed ports. A built-in DNS server resolves service names to container IPs, and the integrated Caddy reverse proxy provisions and renews Let's Encrypt certificates automatically, sharing them across the cluster. Rolling updates replace containers with zero downtime, persistent Docker volumes keep stateful services safe, and the Unregistry integration pushes image layers straight to your machines when no registry is available. There is no control plane to babysit: each machine keeps a synchronised copy of the cluster state, and SSH access to any single node is enough to manage the whole fleet. Running on a dedicated VPS on RepoCloud with guaranteed CPU, RAM, and SSD, full root SSH access, and a browser serial console. Apache-2.0 licensed.

DashBeam
DashBeam sends files and folders of any size straight from one device to another, end to end encrypted, with no cloud account, no size limits, and nothing parked on a third party server in between. Drop in a file and share it through a short code, a link, or a QR scan; whoever receives it needs no account and can collect it in a plain browser tab with nothing installed. On the same network, nearby machines appear on their own, so pairing two devices and sending between them takes a couple of clicks instead of a cable or a memory stick. Pair a device once and it stays reachable by its identity, so your machines can exchange files from anywhere without swapping fresh tickets every time. Interrupted transfers resume where they stopped, and hopping from Wi-Fi to cellular mid-send does not drop the connection. One share can fan out to several receivers at once, and devices you mark as trusted can accept files automatically, which suits pushing builds, media libraries, or backups around a small fleet. You can preview what is arriving before downloading it, and a local history records every completed transfer. The repository also ships Docker Compose stacks for your own relay and discovery server, so even the encrypted fallback path can run entirely on machines you own. Running on a dedicated VPS on RepoCloud with guaranteed CPU, RAM, and SSD, full root SSH access, and a browser serial console. AGPL-3.0 licensed.
Zabbix
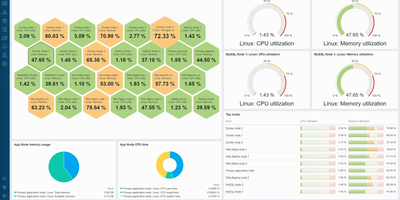
Monitoring everything from network switches to Kubernetes clusters since 2001 with over 6,200 GitHub stars and deployments exceeding 100,000 devices per installation, Zabbix has established itself as one of the most mature and feature-rich open-source monitoring platforms available, trusted by organizations including Dell, Salesforce, ICANN, and T-Mobile. The platform collects metrics from virtually any source using Zabbix Agent written in C, Zabbix Agent 2 written in Go with native plugin support, SNMP v1/v2c/v3 polling and trapping, IPMI for hardware health, JMX for Java applications, SSH and Telnet checks, HTTP/HTTPS polling, and ODBC database queries. Version 7.0 LTS introduced synthetic browser monitoring that executes user-defined JavaScript via WebDriver to simulate multi-step user interactions on websites, proxy load balancing with automatic host redistribution across proxy groups for high availability, in-memory proxy data buffering delivering up to 100x performance improvement, native multi-factor authentication with TOTP and Duo support, and just-in-time user provisioning from SAML and LDAP. Low-level discovery automatically detects file systems, network interfaces, SNMP OIDs, VMware resources, and Kubernetes pods, creating monitoring items and triggers dynamically. The alerting engine correlates events with configurable escalation chains, sending notifications through Slack, Microsoft Teams, PagerDuty, Jira, email, and SMS with customizable message templates. Over 1,000 official templates provide instant monitoring for Linux, Windows, VMware, AWS, Azure, Docker, PostgreSQL, MySQL, Apache, Nginx, and hundreds more. Running on a dedicated VPS on RepoCloud with guaranteed CPU, RAM, and SSD, full root SSH access, and a browser serial console. AGPL-3.0 licensed.
Vigil
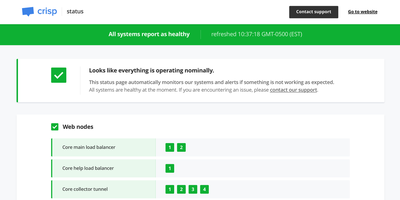
Vigil monitors your entire distributed infrastructure and generates a public status page from a single Rust binary small enough to run on a Raspberry Pi, consuming minimal CPU and memory while providing crash-free reliability. Four distinct monitoring modes cover every topology: poll probes check HTTP, TCP, SSH, and ICMP endpoints for reachability with configurable intervals and thresholds; push probes receive health reports from Vigil Reporter libraries embedded in your application code across Node.js, Python, Golang, Rust, TypeScript, Dart, and C#; local probes delegate monitoring to Vigil Local slave daemons running behind firewalls on separate LANs; and script probes execute custom shell commands for specialized health checks. Each monitored service transitions through healthy, sick, and dead states based on consecutive probe failures, with configurable thresholds controlling state transition sensitivity. When services change state, Vigil dispatches notifications through twelve alert channels including Slack, Email, Twilio SMS, Telegram, Pushover, Gotify, XMPP, Matrix, Zulip, Cisco Webex, and generic webhooks. The generated status page displays service groups organized by category with real-time replica status, system load metrics from reporter probes, and a maintenance announcement system for communicating planned downtime through the Manager HTTP API. Configuration uses a single TOML file defining all probes, services, and notification channels with no database dependency. Docker deployment pulls the official image with volume-mounted configuration. Running on a dedicated VPS on RepoCloud with guaranteed CPU, RAM, and SSD, full root SSH access, and a browser serial console. MPL-2.0 licensed.
xyOps
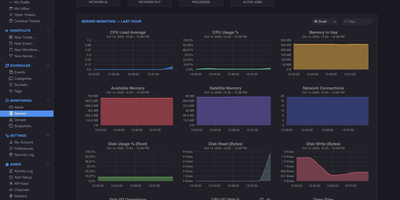
With 4,500+ GitHub stars and version 1.0.92 released August 2026, xyOps delivers a complete operations platform that unifies workflow automation, job scheduling, server monitoring, alerting, and incident response in one self-hosted system. The platform uses a distributed architecture where a central conductor coordinates lightweight xySat satellite agents running on Linux, macOS, or Windows worker nodes via persistent WebSocket connections. The visual workflow builder lets you chain events, triggers, actions, and monitors into multi-step pipelines with conditional logic, fan-out/fan-in parallelism, multiplex controllers for fleet-wide execution, and configurable resource limits. QuickMon provides per-second CPU, memory, disk, and network visibility streamed live to the web UI, while user-defined monitor plugins sample metrics every minute with time-series storage at hourly, daily, monthly, and yearly resolutions. Alert triggers evaluate expressions against live data and fire notifications via email, webhook, or custom actions, with full server snapshots attached showing every running process, network connection, and resource utilization at the moment of detection. Failed jobs and alerts automatically create tickets with linked logs, metrics history, and context for end-to-end incident tracking. The plugin marketplace supports extensions written in any language, and the Docker plugin enables container-based job execution. Deploy via Docker with persistent volumes on port 5522 for the web UI and 5523 for API access, running on a dedicated VPS on RepoCloud with guaranteed CPU, RAM, and SSD, full root SSH access, and a browser serial console. BSD-3-Clause licensed.
Nexterm
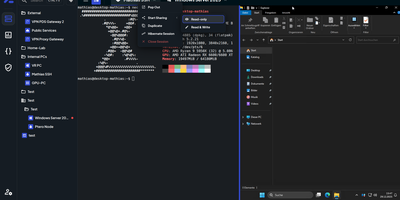
Terminals, remote desktops, and file browsers for every server you run: Nexterm opens them over SSH, VNC, RDP, Telnet, or SFTP from a self-hosted web page. Servers live in folders with tags and custom icons. Connections open as tabs or split views, keep running across browsers and devices, and can hibernate and resume later. The file manager handles SFTP and FTP: drag files in, upload whole folders, search, and edit in place with syntax highlighting. Live metrics track CPU, memory, disk, network, and processes for each host. Snippets store the commands you retype most. Scripts run whole maintenance jobs. Git repositories added as sources bring ready-made ones filtered by operating system. Organizations share servers through role-based permissions, and every action is logged. Record full terminal sessions for audits and training, or send a shared-session link so a colleague can join, read-only or writable. Authentication covers local accounts with TOTP and passkeys, OIDC providers such as Keycloak, Authentik, and Microsoft Entra ID, and LDAP or Active Directory. Saved passwords, SSH keys, and passphrases stay encrypted at rest. A Proxmox integration lists LXC containers and QEMU virtual machines and can start or stop them. An opt-in AI assistant drafts shell commands from plain-language requests. Running on a dedicated VPS on RepoCloud with guaranteed CPU, RAM, and SSD, full root SSH access, and a browser serial console. MIT licensed.
Sencho
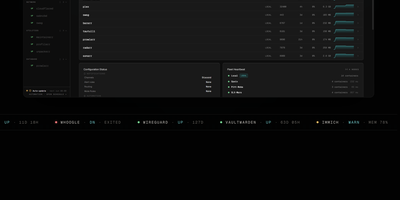
With over 430 GitHub stars and designed for DevOps engineers, platform teams, and homelab operators, Sencho is the self-hosted Docker Compose control plane that gives you a real operational cockpit without abandoning file-on-disk compose workflows. The web dashboard provides live CPU, memory, and disk sparklines per container, one-click start/stop/restart controls, and a Monaco-powered YAML editor with syntax highlighting, inline diff, and one-click rollback. Compose files remain the source of truth on the host filesystem. Multi-node management connects remote Sencho instances via authenticated HTTP and WebSocket proxy using long-lived API tokens, with no SSH access or exposed Docker sockets required. The Pilot Agent establishes an outbound-only WebSocket tunnel for nodes behind NAT, CGNAT, or strict firewalls. Blueprints define compose intent once and deploy it across label-targeted nodes, with drift detection keeping the fleet aligned. Fleet Federation provides cordon and pin controls for maintenance windows, while Fleet Actions execute bulk deploy, stop, and restart operations by stack label across the entire infrastructure. The security suite includes Trivy vulnerability scanning, deploy enforcement policies, SARIF and SBOM export, and Fleet Sync to replicate scan policies across replicas. Additional capabilities include 199+ one-click app templates, Git source integration, atomic deploys with auto-rollback, auto-heal, scheduled operations, webhooks, and custom S3 off-site backups to MinIO, R2, B2, or AWS. Running on a dedicated VPS on RepoCloud with guaranteed CPU, RAM, and SSD, full root SSH access, and a browser serial console. AGPL-3.0 licensed.
Arkeep
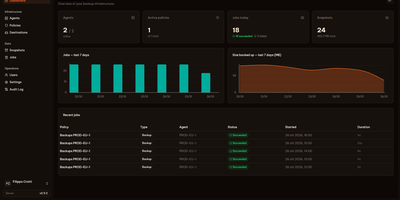
Five servers, five cron jobs, five restic scripts nobody quite remembers writing: Arkeep replaces that archaeology with one dashboard where every backup in your infrastructure reports for duty. A small agent on each machine dials out to the central server and waits for work, so nothing listens on an agent port and machines behind NAT or a home firewall enroll just as easily as cloud VPSes. From the web interface you define destinations, which can be local disk, any S3-compatible storage, SFTP, a restic REST server, or more than forty Rclone backends, then build policies that send one backup job to several destinations at once for a genuine 3-2-1 layout. Docker volumes are discovered automatically, and databases stream straight into the backup with pg_dump and mysqldump instead of fragile file copies. Retention and repository integrity checks run per destination on their own schedules. When recovery day comes, you open any snapshot in the browser, browse its files, and restore a single folder in place or somewhere new. Failures announce themselves by email, Slack, Discord, or webhook, or stay silent in Healthchecks.io. Sign-in is yours to choose: local accounts with TOTP two-factor, or single sign-on through any OIDC provider. Running on a dedicated VPS on RepoCloud with guaranteed CPU, RAM, and SSD, full root SSH access, and a browser serial console. Apache-2.0 licensed.
ManageIQ
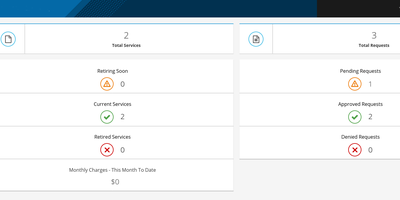
ManageIQ gives operators one console for every cloud and hypervisor the organization runs, connecting to VMware, OpenStack, AWS, Azure, Google Cloud, Kubernetes, OpenShift, and Nutanix to continuously discover inventory, map relationships, and listen for changes without installing agents. Discovered estates become manageable: operators publish bundles of resources into a self-service catalog that end users order like apps, then govern the full life cycle through policy, compliance, delegated operations, and retirement. SmartState analysis scans the contents of VMs, hosts, and containers agentlessly, even foreign or uncooperative ones, feeding security and compliance policies that flag drift automatically. Utilization metrics reveal idle systems and right-sizing opportunities, with capacity planning and what-if scenarios before hardware purchases. Chargeback and showback assign rates to tenants, group VMs by tag or container images by label, and generate reports in multiple currencies. Embedded Ansible automation executes playbooks for provisioning and remediation, and the Spassky release adds Nutanix and Terraform Enterprise providers on a Rails 7.2 core. Running on a dedicated VPS on RepoCloud with guaranteed CPU, RAM, and SSD, full root SSH access, and a browser serial console. Apache-2.0 licensed.
UWAS
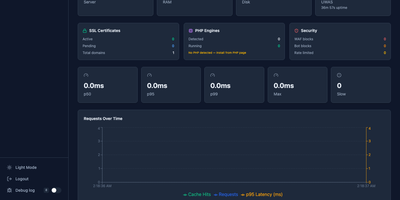
One 18 MB Go binary does the job of Apache, Nginx, Varnish, Caddy, and cPanel combined. Point UWAS at your /var/www directory and it auto-detects sites, provisions Let's Encrypt certificates, enables HTTP/3 via QUIC, and activates a two-tier caching engine with L1 memory shards and L2 disk storage, all before you write a single line of configuration. The React 19 admin dashboard provides 42 management pages for domains, PHP versions, databases, cron jobs, DNS records, file management, backup and restore, SFTP users, and uptime monitoring with real-time SSE updates. PHP sites run through FastCGI with connection pooling and full .htaccess compatibility, so WordPress, Laravel, and legacy applications work without migration effort. The built-in WAF catches SQL injection, XSS, path traversal, and shell exploits, while per-domain rate limiting and bandwidth caps protect against abuse. Reverse proxy mode supports five load balancing algorithms, circuit breakers, canary deployments, and mirroring for blue-green rollouts. Git deploy clones your repository, runs the build, checks health, and restarts the service with rollback on failure. An MCP server lets AI agents manage domains, cache, and deployments through natural language. The Nginx and Apache migration CLI converts existing configurations to UWAS format automatically. Deploy on a dedicated VPS on RepoCloud with guaranteed CPU, RAM, and SSD, full root SSH access, and a browser serial console. AGPL-3.0 licensed.
Hasura
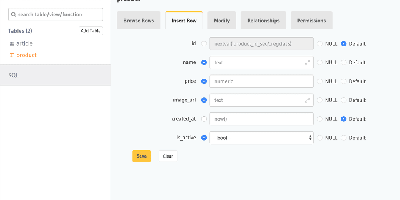
A PostgreSQL database becomes a production-grade GraphQL API the moment Hasura GraphQL Engine points at it: track tables and relationships - existing schemas included - and full query, mutation, and subscription types appear with where, order_by, limit, offset, and on_conflict arguments, no resolvers or boilerplate written. Its Haskell core compiles GraphQL to efficient SQL, and any query becomes a real-time live query with a single keyword, powering dashboards and collaborative UIs over standard GraphQL subscriptions. Authorization is where Hasura earns its enterprise reputation: role-based access control with row- and column-level permission policies driven by session variables from JWTs, auth webhooks, or headers - each role effectively sees its own GraphQL schema containing only what it may touch, integrating cleanly with Auth0, Firebase, or homegrown auth. Event triggers fire webhooks on inserts, updates, and deletes for asynchronous business logic; Actions extend the schema with custom REST handlers; remote schema stitching merges external GraphQL services into one endpoint; and auto-generated REST endpoints serve clients that skip GraphQL. A browser console handles data modeling and API exploration, the CLI manages migrations and metadata as code, and deployment is a single stateless Docker container beside Postgres.