
Grafana
The de facto dashboard of observability: Grafana is the open-source frontend that turns the data stores you already run into interactive graphs. It does not store metrics itself; it connects to the data stores you already run and turns their contents into interactive dashboards. Supported sources number over 150 via plugins: Prometheus, Loki, Tempo, InfluxDB, Elasticsearch, MySQL, PostgreSQL, Microsoft SQL Server, AWS CloudWatch, Azure Monitor, Google Cloud Monitoring, and many more. Dashboards are built from a large library of panel types (time series, heatmaps, tables, gauges, logs) with template variables for reusable, parameterized views. Unified alerting evaluates rules against any connected data source, not just Prometheus, and routes notifications to Slack, PagerDuty, email, and other channels with grouping and silencing - unlike Prometheus Alertmanager, a single rule can combine a Loki log pattern, a PostgreSQL query result, and a CloudWatch metric. Dashboards serialize to JSON and data sources configure via provisioning files, so the entire observability setup can live in Git and deploy repeatably across environments. Explore mode adds ad-hoc querying outside dashboards, with split view for correlating a metric spike against the matching log lines, and access control spans organizations, teams, folder permissions, and OAuth, LDAP, and SAML integration. Written in Go and TypeScript, AGPL-licensed. Self-hosting gives you unlimited users, dashboards, and queries at flat hosting cost, without Grafana Cloud's usage-based pricing.
Briefer
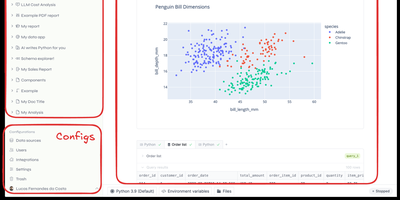
Backed by Y Combinator with 4,300 GitHub stars and growing rapidly since its September 2024 launch, Briefer delivers the first truly unified notebook-and-dashboard platform that eliminates the fragmented workflow of juggling Jupyter for analysis, Tableau for visualization, and Notion for documentation — combining all three in a single Notion-like workspace where SQL query results automatically become Python DataFrames accessible in subsequent code blocks. The built-in AI analyst understands your database schema and notebook context to generate SQL queries, write Python transformations, create visualizations, and fix errors on demand using configurable OpenAI or private LLM backends. Connect directly to PostgreSQL, MySQL, BigQuery, Redshift, Snowflake, and Amazon Athena as data sources, or upload CSV files for immediate analysis. Native point-and-click visualizations produce charts, tables, and dashboards without writing code, while interactive data apps use inputs, dropdowns, and date pickers to create parameterized reports for non-technical stakeholders. Scheduled execution runs notebooks and dashboards periodically with results delivered via Slack integration or public shareable links. Write-back queries modify production data directly from notebooks for ad-hoc pipeline testing. The architecture runs as three Docker containers — web frontend, API server, and optional AI service — backed by PostgreSQL and a Jupyter server for Python execution, deployable via single Docker command, Docker Compose, or Helm charts for Kubernetes. Running on a dedicated VPS on RepoCloud with guaranteed CPU, RAM, and SSD, full root SSH access, and a browser serial console. AGPLv3 licensed.