Lab Dash
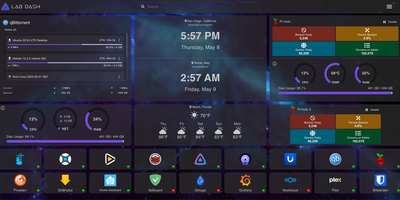
Every homelab deserves a control center that looks as good as the services it manages. Lab Dash gives you a customizable, drag-and-drop dashboard where every tile earns its spot. Add shortcut widgets linking to your Plex, Grafana, Nextcloud, or any service with automatic health check indicators showing green or red status at a glance. The system monitoring widget displays real-time CPU usage, memory consumption, network throughput, disk utilization, and temperature readings by mounting the host /sys directory as a read-only volume. Integrate Pi-hole stats, qBittorrent download progress, and media server widgets for Jellyfin, Plex, or Emby directly on your grid. Multiple pages let you organize services by category, and the search bar finds any tile instantly. Customize the background image from a local upload or URL, set a custom title and tab name, and choose your preferred search provider including self-hosted options like SearXNG. All sensitive configuration data is encrypted locally with AES-256-CBC, and only administrator accounts can modify the layout. Install Lab Dash as a Progressive Web App on desktop, phone, or tablet for a native app experience with offline capability. Configurations export as backup files for easy migration between instances. On RepoCloud, deploy Lab Dash on a dedicated VPS with root SSH access and Docker socket connectivity under the GPL-3.0 license.
Jump
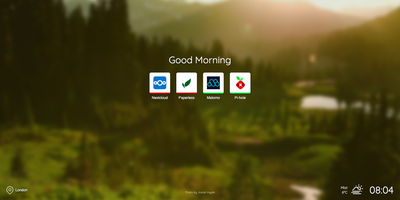
Open a new tab and the whole homelab should answer two questions instantly: where is everything, and is it still alive? Sites appear as large tappable icons with custom artwork, or Jump fetches each service's original favicon on its own. Green means up, red means down: real-time status monitoring paints every entry, so a failed service announces itself before anyone files a complaint. Tags spread links across multiple pages, and the tag panel jumps between home, media, admin, or any grouping you invent. A keyboard shortcut opens search, matching names, tags, and URLs as you type, and the same box can hand a query to your chosen search engines for everything beyond the lab. Weather and local time sit in the corner through OpenWeatherMap, backed by your own background photos or a fresh Unsplash image each visit. Greeting, clock format, and site name are all switchable, and the layout adapts to a phone screen held in one hand. Configuration lives in plain mapped folders for backgrounds, favicons, search engines, and sites, so a backup is just a copy. It serves on port 8080 in Docker, installs on Kubernetes with a community Helm chart, or runs directly under PHP on a web server. Running on a dedicated VPS on RepoCloud with guaranteed CPU, RAM, and SSD, full root SSH access, and a browser serial console. MIT licensed.
Labby
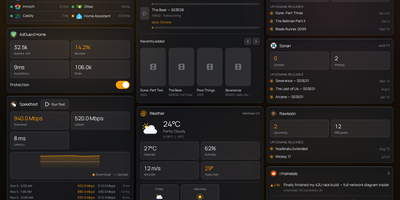
Labby gathers a whole homelab onto one live dashboard you host yourself, covering services, containers, downloads, and media servers. Widgets watch your service monitor, Docker containers, qBittorrent or Transmission queues, SABnzbd, AdGuard Home, Jellyfin, Emby, Plex, Beszel, Radarr, Sonarr, plus weather, calendar, speedtest, bookmarks, Reddit, and Hacker News, and the server pushes every change to your browser over server-sent events so nothing waits on a refresh timer. The dashboard is not a read-only poster: start and stop containers, pause and resume torrents, and toggle AdGuard protection straight from its widgets. Everything configures from the in-app Manage Services page, where service URLs, API keys, poll intervals, and multiple instances of the same integration (two Radarr servers, say) live in a small SQLite database instead of scattered environment files. Named color schemes restyle the board and save with the config, and icon sources span dashboard-icons, selfh.st, Lucide, or your own URLs. Login is off by default for trusted home networks, with a clear warning to keep it behind a LAN, VPN, or forward-auth proxy, and optional OIDC sign-in through Authentik, Authelia, Keycloak, or Pocket ID when you want a real front door. One container, one volume, and your lab finally explains itself at a glance. Running on a dedicated VPS on RepoCloud with guaranteed CPU, RAM, and SSD, full root SSH access, and a browser serial console. MIT licensed.
Immich Insights
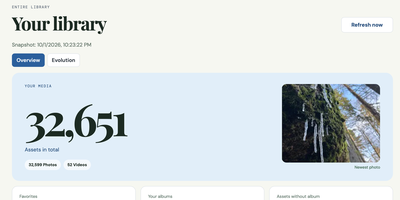
Immich Insights turns the photo library you already keep in Immich into a year-in-review style dashboard of how you actually shoot. Connect it with your own Immich API key and it reads your asset metadata into a local snapshot, without copying your original photos, then builds the overview Immich itself never shows: total photos and videos, storage used, favorites, albums, and your newest additions. Pick any year or a custom date range and see that period's shooting volume, favorites, albums, and devices. Camera statistics break your library down by device and manufacturer, with leaderboards you can correct when the same camera appears under different names. Exposure analysis shows your ISO, focal length, and shutter speed distributions, the focal lengths you reach for most, and how your settings shift by hour of day. Rhythm charts map your shooting by month, weekday, and hour, with a calendar heatmap of your most active days. A zoomable timeline marks the moments that matter: first photo, a new device joining the library, your longest gap, your busiest day ever. People and location views count faces and mapped places by country and continent, and a photography profile scores your habits. Clicking any chart value opens the matching photo thumbnails, and reports export as PDF, CSV, or JPG. Running on a dedicated VPS on RepoCloud with guaranteed CPU, RAM, and SSD, full root SSH access, and a browser serial console. MIT licensed.
Nerve
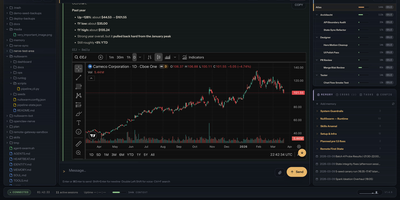
Nerve is the web cockpit for OpenClaw, giving you one real-time screen to run an entire fleet of AI agents instead of chasing them through chat threads. Every agent keeps its own workspace, memory, identity, and skills, and you can switch between agents, browse their files, and edit memory or configuration in a tabbed editor during a live conversation. Work moves onto a kanban board where subagents pick up delegated tasks, and returned work waits in a proposal inbox for your review before it is accepted. Cron jobs run as their own sessions in a navigable session tree, so scheduled automation has logs and output you can actually inspect. Voice is a first-class input: push to talk or use a wake word, watch live transcription, and hear replies spoken back in your chosen language. Ask for a chart and the answer arrives as a real rendered chart, with diffs, file previews, and highlighted code inline in the stream. Token usage, running costs, and context pressure stay visible on every session, so long tasks never quietly drain your budget. Run it privately on localhost, reach it over your LAN behind password authentication and signed-cookie sessions, or keep access inside a Tailscale tailnet. Running on a dedicated VPS on RepoCloud with guaranteed CPU, RAM, and SSD, full root SSH access, and a browser serial console. MIT licensed.

LobsterBoard
LobsterBoard lets you assemble custom monitoring dashboards from 50 pre-built widgets using a visual drag-and-drop editor, covering everything from CPU and memory gauges to AI subscription trackers, stock tickers, and camera feeds on your own server with zero cloud dependencies. The snap-grid editor handles layout composition with resize handles and a property panel, so you drag widgets onto a canvas, configure their data sources, and the dashboard is live. Real-time system statistics flow through Server-Sent Events, updating CPU load, memory pressure, disk usage, network throughput, and Docker container status without page refreshes. Five built-in themes range from a dark default to a retro CRT terminal aesthetic, a warm sepia paper look, and pastel options for different display environments. The template gallery lets you export complete dashboard layouts with auto-captured screenshot previews, share them with other users, and import configurations as a full replacement or selective merge. Custom pages extend beyond dashboards into notes, kanban boards, or any free-form layout you need. Built-in widgets connect to iCal feeds for calendar events, RSS sources for news aggregation, weather APIs for local conditions, and financial data providers for cryptocurrency and stock prices. The whole system runs from a single server.cjs file with zero cloud dependencies or external frameworks. Running on a dedicated VPS on RepoCloud with guaranteed CPU, RAM, and SSD, full root SSH access, and a browser serial console. BSL-1.1 licensed (free for non-commercial use; converts to MIT in 2030).
Fail2Ban Report
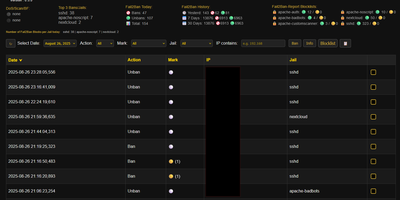
Fail2Ban quietly bans thousands of bots on a typical VPS and just as quietly keeps the whole story buried in a log file nobody reads, and Fail2Ban Report digs that story out into a dashboard you will actually open. Shell scripts convert each day of fail2ban.log into JSON, and the web interface lays every ban and unban on a searchable, filterable timeline you can slice by jail, server, or time window. Aggregated statistics for today, yesterday, seven days, and thirty days show which jails absorb the most attacks, while markers flag repeat offenders and escalating ban counts so persistent scanners stand out from one-time noise. Blocklists live per jail and per server as plain JSON, and ban or unban actions execute through UFW, giving you permanent bans that survive independently of jail restarts. Bulk actions handle whole ranges at once, with a pending state until the next sync applies them. Multiple servers feed one console through a pull-based HTTPS endpoint, so a fleet of small machines reports to a single pane without exposing SSH. Optional AbuseIPDB and IP-Info lookups add reputation and region context to any address. Running on a dedicated VPS on RepoCloud with guaranteed CPU, RAM, and SSD, full root SSH access, and a browser serial console. GPL-3.0 licensed.
Resolvr DNS Dashboard
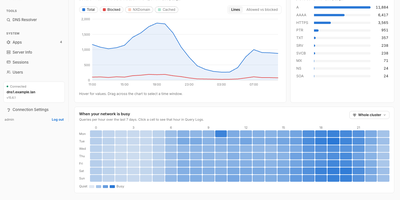
Resolvr gives your Technitium DNS server the clean, readable dashboard it deserves, turning raw query traffic into an overview you can understand at a glance. Four tabs divide the picture: Traffic charts queries over time with allowed and blocked stacked together and a seven-day heatmap of when your network is busy; Resolution shows where answers come from, cache, upstream, blocked, or authoritative, with response times and a flow diagram of each lookup; Top lists rank your chattiest clients and most-requested domains; and Infrastructure tracks DHCP scope usage, zones, and cache growth. Every chart is a doorway: click one and you land in Query Logs already filtered to what you clicked. Pick any device on the Clients page to see its queries, block rate, DHCP lease, and favourite domains. Query Logs themselves filter by client, name, protocol, response code, and time window, export to CSV, and can live-tail as new lookups arrive. Blocked Zones manages your feeds, your own blocked domains, and a checker that tells you whether a name is blocked and which feed caught it. Run a Technitium cluster and each panel gains a scope chip, comparing nodes side by side or merging their logs into one timeline. Running on a dedicated VPS on RepoCloud with guaranteed CPU, RAM, and SSD, full root SSH access, and a browser serial console. MIT licensed.

PH Intercept
A blocklist working silently in the background is hard to appreciate, so PH Intercept turns your DNS traffic into a live arcade battle: every allowed query flies by as a friendly ship, and every blocked query spawns as an invader your interceptor shoots down. It streams query events live from the API of your existing Pi-hole v6, AdGuard Home, or Technitium server, so the battle on screen is your network's real traffic the moment it happens. Repeat domains level up on screen: friendly shuttles grow into heavy transports and gold capital ships, while blocked domains mutate from crab invaders into orange drones and purple bosses. The interceptor hunts by itself, launching a support drone at five on-screen threats and a second at ten, and it swaps among seven selectable ships, from the Falcon and the Enterprise to the Normandy. The bottom HUD doubles as a control panel: pause blocking for ten seconds, thirty seconds, or five minutes with a synced countdown, watch totals climb, and trigger a gravity list update in place. Client and domain labels can ride beneath each entity, noisy domains disappear through regex ignore patterns, a second DNS server can join in split-screen two-player mode, and viewer settings persist per browser. The backdrop ranges from a starfield plotted from about 12,200 real stars to nebula, synthwave, and custom image modes. Running on a dedicated VPS on RepoCloud with guaranteed CPU, RAM, and SSD, full root SSH access, and a browser serial console. MIT licensed.
dinkydash
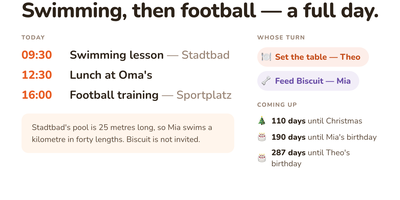
The family calendar nobody opens helps nobody, so DinkyDash puts it on a screen the household walks past. Paste in iCal links from Google, iCloud and Outlook calendars and the board merges them into one agenda in time order, big enough to read from across the kitchen, with tomorrow tucked underneath when the day leaves room. A personal calendar can share only the events marked for a partner and keep work and private appointments to itself. Chores answer the daily argument on their own: whose turn it is moves on with the date, so nobody ticks anything off. Birthdays, holidays and special dates count down in the corner, and once a day the board gets a fresh headline written about your actual day, with a useful note parked under the agenda. Light and dark themes come from the settings page, and that same settings page on your phone edits the configuration file directly, comments preserved. A preview page shows the board at Pi, TV and tablet sizes side by side before you mount anything. There is deliberately no login: it assumes your home network, rewards you with a board you never sign into, and asks to stay behind a VPN or an authenticated proxy if you view it away from home. Running on a dedicated VPS on RepoCloud with guaranteed CPU, RAM, and SSD, full root SSH access, and a browser serial console. MIT licensed.
Headroom
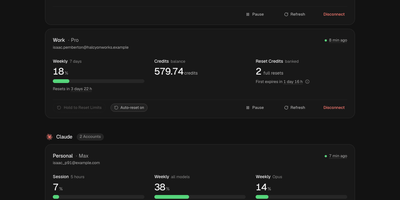
Headroom answers the question every multi-plan AI subscriber asks mid-task: which of my accounts still has room to work? It puts the live limits, reset times, credits, and spend of Claude, Codex, Cursor, Copilot, Grok, Antigravity, and Vercel AI Gateway accounts on one self-hosted dashboard instead of seven provider pages. Connect each account once, through its official CLI sign-in or a credential import, and a background scheduler refreshes every figure on schedule, renews tokens before they expire, and keeps 90 days of readings. Five-hour sessions, weekly pools, per-model limits, credit balances, banked resets, and on-demand spend sit side by side, and unreported figures show as unknown rather than a fake zero. Compare ranks same-provider accounts by the room they have left and names the one to use next, while Timeline lays every reset window on a two-week calendar. Analytics charts when you work, when you run dry, and whether each plan fits, and Wallet totals subscriptions, usage spend, and top-ups in one currency with renewals and budget alerts. In-app notices, Telegram messages, and signed webhooks warn about low limits, expiring resets, and broken sign-ins, and optional automations can spend a banked Codex reset or log a credit top-up the moment it lands. Personal, work, and side-project accounts stay separate under one owner login with passkeys and a Privacy Mode that blurs emails on screen. Running on a dedicated VPS on RepoCloud with guaranteed CPU, RAM, and SSD, full root SSH access, and a browser serial console. MIT licensed.
DailyHub
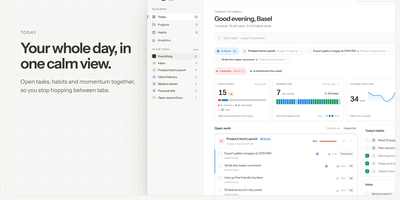
DailyHub is one calm page for a single person's whole day: today's open work grouped by project, the habits due this morning, and an inbox that catches everything that does not belong anywhere yet. The Today view greets you with a quick-add box, nudges about what is slipping, and a progress bar that fills as the day gets done. Focus mode pins the projects or tasks that matter and hides the rest until a date you pick or until you clear it, so the full list stops shouting. Projects carry status, due dates, and milestones, wear logos with accent colours derived from them automatically, and raise a banner when work stalls. Habits run on weekday schedules and report back with a 14-day consistency strip and a completion rate, so a streak is something you can see rather than guess. Analytics chart completions over time, break them down per project, and surface the weekday patterns that show when you actually get things done. A command palette jumps to any project, task, habit, or milestone from the keyboard, and light and dark themes keep long planning sessions easy on the eyes. An AI assistant can join through the built-in MCP endpoint: ask what is still open in the inbox, add a task to the website project for Friday, or mark today's workout done. Running on a dedicated VPS on RepoCloud with guaranteed CPU, RAM, and SSD, full root SSH access, and a browser serial console. MIT licensed.
Briefer
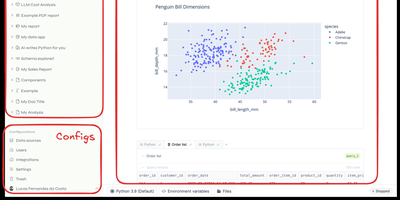
Backed by Y Combinator with 4,300 GitHub stars and growing rapidly since its September 2024 launch, Briefer delivers the first truly unified notebook-and-dashboard platform that eliminates the fragmented workflow of juggling Jupyter for analysis, Tableau for visualization, and Notion for documentation — combining all three in a single Notion-like workspace where SQL query results automatically become Python DataFrames accessible in subsequent code blocks. The built-in AI analyst understands your database schema and notebook context to generate SQL queries, write Python transformations, create visualizations, and fix errors on demand using configurable OpenAI or private LLM backends. Connect directly to PostgreSQL, MySQL, BigQuery, Redshift, Snowflake, and Amazon Athena as data sources, or upload CSV files for immediate analysis. Native point-and-click visualizations produce charts, tables, and dashboards without writing code, while interactive data apps use inputs, dropdowns, and date pickers to create parameterized reports for non-technical stakeholders. Scheduled execution runs notebooks and dashboards periodically with results delivered via Slack integration or public shareable links. Write-back queries modify production data directly from notebooks for ad-hoc pipeline testing. The architecture runs as three Docker containers — web frontend, API server, and optional AI service — backed by PostgreSQL and a Jupyter server for Python execution, deployable via single Docker command, Docker Compose, or Helm charts for Kubernetes. Running on a dedicated VPS on RepoCloud with guaranteed CPU, RAM, and SSD, full root SSH access, and a browser serial console. AGPLv3 licensed.
ProxMate
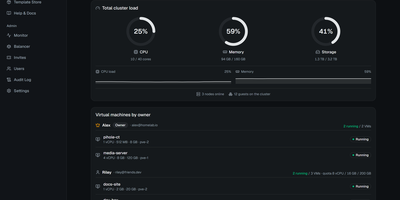
You have a Proxmox cluster with spare capacity and people who keep asking you for a VM: ProxMate turns that cluster into an invite-only cloud where those people help themselves, inside limits you set. Invite links carry CPU, memory, and disk quotas, and tenants spin up VMs or LXC containers from an ISO, the Template Store, or twenty curated cloud images, pasting an SSH key to get a ready-to-SSH box in about a minute. Automatic placement picks the node with the image and the most free capacity, so nobody needs to learn your topology. Projects group machines with per-project usage totals and whole-project start and stop, and any VM can be shared with another tenant as viewer, operator, or manager, never with delete rights. Both a graphical noVNC console and a text console with copy and paste run in the browser, so access never needs open ports, and an optional per-VM browser IDE puts VS Code inside the guest. Backups run on schedules with rolling retention and one-click restore, snapshots are instant, power schedules stop dev boxes overnight, and time-boxed invites suspend access without deleting anything. Admins watch live per-VM sparklines, audit every action, and balance memory across nodes with live migration. Running on a dedicated VPS on RepoCloud with guaranteed CPU, RAM, and SSD, full root SSH access, and a browser serial console. AGPL-3.0 licensed.
Nimbus
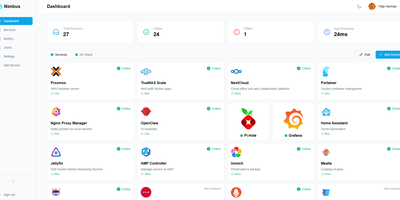
Nimbus is a self-hosted homelab dashboard that turns your scattered pile of services into a polished, organized command center with real-time health monitoring for every endpoint you care about. The dashboard displays live status cards for each registered service, tracking response times down to the millisecond and graphing uptime history so you can spot degradation before it becomes an outage. Health checks run on configurable intervals with smart self-signed certificate handling, meaning your internal services with self-issued TLS do not trigger false alarms. Multi-user support comes standard: local accounts authenticate via JWT, while OAuth2 integration with Google, GitHub, and Discord lets team members sign in with existing credentials. Role-based access control and a built-in admin panel give you granular authority over who sees what. Each user personalizes their view with custom backgrounds, light or dark mode, accent color themes, and drag-and-drop service tile arrangement. Services group into named categories and cards resize to fit your preferred layout, with both grid and list view modes available. Prometheus metrics export feeds your existing Grafana stack, and webhook notifications alert you instantly when a service goes offline. Custom service icons upload directly or auto-fetch from the Dashboard Icons collection. Zero-config Docker deployment gets you running in under 30 seconds with a single docker-compose command. Running on a dedicated VPS on RepoCloud with guaranteed CPU, RAM, and SSD, full root SSH access, and a browser serial console. AGPL-3.0 licensed.
DAC
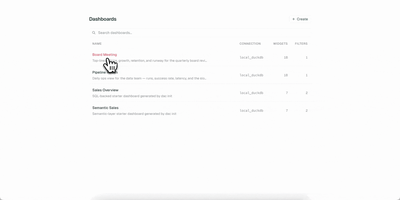
Your dashboards deserve version control, code review, and reproducible builds, just like the rest of your stack. DAC lets you define interactive data dashboards in YAML or TSX, validate them in CI, and serve them from a single Go binary that embeds a full React frontend. Choose from 21 chart types including line, bar, area, pie, scatter, bubble, funnel, sankey, heatmap, calendar, sparkline, waterfall, gauge, treemap, radar, and candlestick, plus metric cards, data tables, text blocks, and image widgets. The built-in semantic layer lets you define metrics and dimensions once in reusable model files, then reference them from any widget while DAC generates the SQL automatically. Connect to Postgres, MySQL, Snowflake, BigQuery, Redshift, Databricks, and DuckDB through standard Bruin connection configs. Interactive filters with date pickers, dropdowns, multiselects, and search inputs inject values via Jinja templating and re-execute only affected widgets. Live reload via Server-Sent Events refreshes connected browsers instantly when you save a file. Export dashboards as self-contained static HTML with baked-in query results for S3, GitHub Pages, or offline sharing, and render slide decks via the Google Slides export command. On RepoCloud, deploy DAC on a dedicated VPS with root SSH access and persistent storage for your dashboard definitions and database connections under the AGPL-3.0 license.
KoShelf
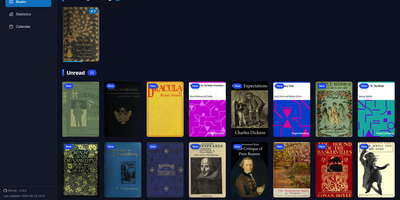
Your e-reader already knows everything about your reading life, and KoShelf turns that KOReader metadata into a beautiful dashboard you can browse from any browser. The library overview gathers currently reading, completed, and unread books and comics, while each item's page collects your highlights, annotations, ratings, and review notes in one place. Reading statistics chart your time and pages with customizable activity heatmaps and weekly breakdowns, and per-item statistics reveal session counts, average session length, and reading speed for every book. A monthly calendar shows what you read on each day, and the yearly recap celebrates completions with monthly summaries of finished items and hours read. Supported books open right inside KoShelf's own reader, with keyboard navigation, a progress scrubber, and inline highlight notes. Metadata entries survive even when the original document disappears, because library archives preserve covers and reading data until the source returns. With writeback enabled in server mode, you can edit annotations, ratings, status, and covers from the browser, protected by revision checks and recoverable backups so external changes are never overwritten blindly. Search by title, author, or series, filter by reading status, and download original files whenever you need them. Running on a dedicated VPS on RepoCloud with guaranteed CPU, RAM, and SSD, full root SSH access, and a browser serial console. EUPL-1.2 licensed.
bullstudio
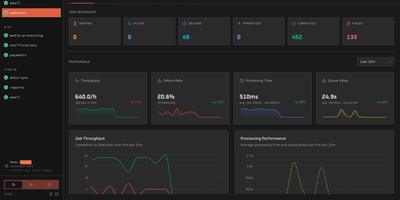
bullstudio turns a pile of opaque Redis keys into a live control panel for your BullMQ and Bull queues, so you can see what is stuck, failing, or delayed without opening a Redis CLI. Point it at a Redis URL and it discovers every queue and prefix on its own, including Redis Cluster setups. The overview page tracks waiting, active, delayed, prioritized, completed, and failed counts next to throughput, failure rate, processing time, and queue delay charts. Open any job to read its input data, logs, return value, and stack trace, then retry, promote, or remove it in one click. Flow view draws parent and child jobs as a color-coded dependency graph, which makes it easy to spot the step where a multi-stage job stalled. Separate screens list connected workers with their concurrency and heartbeat, and show repeatable and cron schedules with their next run time. Pause, resume, drain, or clean a queue directly from the header. Basic authentication, a read-only mode, and a base path for reverse proxies keep access under control. Running on a dedicated VPS on RepoCloud with guaranteed CPU, RAM, and SSD, full root SSH access, and a browser serial console. MIT licensed.