Apache StreamPipes
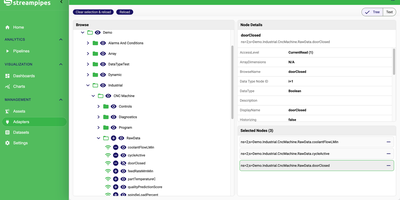
On the factory floor, the data already exists; it is just locked inside machines, PLCs, and protocols nobody on the analytics team speaks. StreamPipes unlocks it with guided adapters for OPC UA (including a web-based node browser), MQTT, Kafka, Pulsar, REST services, and industrial controllers, turning each source into a live stream in minutes. Domain experts then drag those streams into the pipeline editor, chain processors and sinks on a canvas, and watch connection validation check schema compatibility as they build, with live preview showing real values before anything is saved. Pipelines filter, enrich, aggregate, and route machine data, raise alerts, and write results to the built-in time-series data lake, where the data explorer charts history and spots trends. Finished pipelines run under an overview that starts, stops, and bulk-manages them, while detail views expose logs, metrics, status, and the pipeline as code. Live dashboards carry the same data to shop-floor screens and operations centers, organized around assets so a line, a cell, or a single machine becomes the navigation unit. Developers extend everything with custom adapters, processors, and sinks built on the Java SDK and deployed as microservices, or drive the platform from Python, Go, and Java clients. Running on a dedicated VPS on RepoCloud with guaranteed CPU, RAM, and SSD, full root SSH access, and a browser serial console. Apache-2.0 licensed.
HomeHub
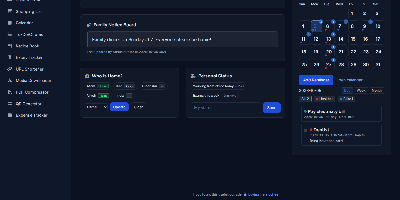
HomeHub gives a household one private page for the everyday coordination that usually scatters across chat threads, fridge notes, and five separate apps. Pin shared notes where everyone sees them, drop files into the shared cloud for the house, and keep one shopping list the whole family edits, with suggestions drawn from what you bought before. Chores become a shared checklist, the calendar holds the dates that matter, and a who's-home view answers the question every family group chat asks in the evening. The expense tracker follows family spending and handles recurring bills like the milk, the newspaper, and subscriptions, while the recipe book and expiry tracker keep the kitchen honest. Small utilities round it out: download media straight to the server, shorten URLs, compress PDFs, generate QR codes, and check the weather without leaving the hub. Every feature toggles on or off in one config file, themes recolor the interface, and there is no account system at all, because the hub trusts your home network instead of a password database. It runs happily on a Raspberry Pi, installs as a PWA on phones, and keeps uploads, media, and data in mounted folders you can back up with any file tool. Running on a dedicated VPS on RepoCloud with guaranteed CPU, RAM, and SSD, full root SSH access, and a browser serial console. MIT licensed.
Resolvr DNS Dashboard
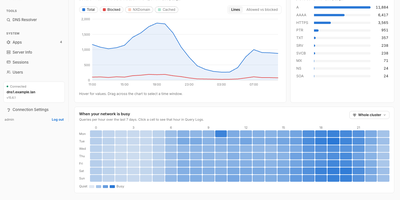
Resolvr gives your Technitium DNS server the clean, readable dashboard it deserves, turning raw query traffic into an overview you can understand at a glance. Four tabs divide the picture: Traffic charts queries over time with allowed and blocked stacked together and a seven-day heatmap of when your network is busy; Resolution shows where answers come from, cache, upstream, blocked, or authoritative, with response times and a flow diagram of each lookup; Top lists rank your chattiest clients and most-requested domains; and Infrastructure tracks DHCP scope usage, zones, and cache growth. Every chart is a doorway: click one and you land in Query Logs already filtered to what you clicked. Pick any device on the Clients page to see its queries, block rate, DHCP lease, and favourite domains. Query Logs themselves filter by client, name, protocol, response code, and time window, export to CSV, and can live-tail as new lookups arrive. Blocked Zones manages your feeds, your own blocked domains, and a checker that tells you whether a name is blocked and which feed caught it. Run a Technitium cluster and each panel gains a scope chip, comparing nodes side by side or merging their logs into one timeline. Running on a dedicated VPS on RepoCloud with guaranteed CPU, RAM, and SSD, full root SSH access, and a browser serial console. MIT licensed.
DailyHub
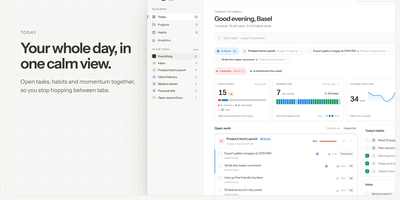
DailyHub is one calm page for a single person's whole day: today's open work grouped by project, the habits due this morning, and an inbox that catches everything that does not belong anywhere yet. The Today view greets you with a quick-add box, nudges about what is slipping, and a progress bar that fills as the day gets done. Focus mode pins the projects or tasks that matter and hides the rest until a date you pick or until you clear it, so the full list stops shouting. Projects carry status, due dates, and milestones, wear logos with accent colours derived from them automatically, and raise a banner when work stalls. Habits run on weekday schedules and report back with a 14-day consistency strip and a completion rate, so a streak is something you can see rather than guess. Analytics chart completions over time, break them down per project, and surface the weekday patterns that show when you actually get things done. A command palette jumps to any project, task, habit, or milestone from the keyboard, and light and dark themes keep long planning sessions easy on the eyes. An AI assistant can join through the built-in MCP endpoint: ask what is still open in the inbox, add a task to the website project for Friday, or mark today's workout done. Running on a dedicated VPS on RepoCloud with guaranteed CPU, RAM, and SSD, full root SSH access, and a browser serial console. MIT licensed.
Malloy Publisher
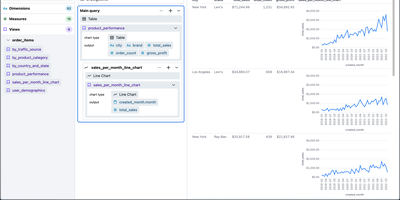
Analytics teams, and increasingly the AI agents working beside them, get one shared definition of the business from Malloy Publisher instead of a pile of SQL queries that each compute revenue slightly differently. You model what your data means once: the sources, the joins, the measures, and who may see what. Agents then compose queries against that model over MCP, so there is no wrong join, no invented column, and no fan-out that double-counts while looking plausible, and the same question returns the same numbers tomorrow. Applications and BI tools reach the same model over REST, and unattended agents use the same governed path instead of scraping raw tables. Reports declared in Malloy read top to bottom or lay out as tile grids you can build by dragging, no-build HTML data apps ship inside the package, and the built-in Console lets anyone browse environments, packages, models, and results without writing code. Access rules decide who may query and which rows they see, discovery curation decides what is even visible, and a single annotation materializes an expensive source or pre-aggregates it on a schedule. Local files work through built-in DuckDB, while BigQuery, Snowflake, Postgres, Databricks, and others connect when the data already lives there. Running on a dedicated VPS on RepoCloud with guaranteed CPU, RAM, and SSD, full root SSH access, and a browser serial console. MIT licensed.
Statainer
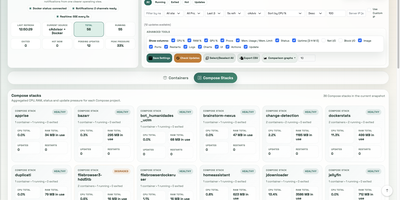
Monitoring and safeguarding Docker infrastructure without heavy enterprise software overhead is the primary mission of Statainer, an open-source management control center for container hosts. System operators inspect live CPU loads, memory consumption, network throughput, and disk I/O metrics across individual containers or comparative top-ranking charts. The interface groups containers by Compose projects, enabling administrators to start, stop, or restart entire application stacks and inspect real-time log streams without opening SSH sessions. The built-in Update Manager detects available image tags, executes single-click container updates, and maintains persistent deployment history with automated rollback capabilities for failed recreations. Custom alert configurations trigger instant notifications to Telegram, Discord, Slack, Pushover, or generic webhook endpoints whenever resource thresholds are breached or container health states change. Developers can provision scoped API keys with token authentication to automate container state transitions and export performance telemetry into custom monitoring workflows. Running on a dedicated VPS on RepoCloud with guaranteed CPU, RAM, and SSD, full root SSH access, and a browser serial console. MIT licensed.
DAC
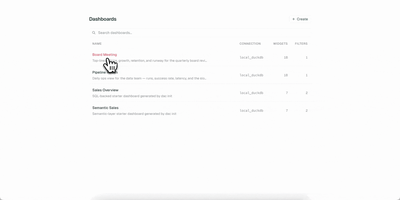
Your dashboards deserve version control, code review, and reproducible builds, just like the rest of your stack. DAC lets you define interactive data dashboards in YAML or TSX, validate them in CI, and serve them from a single Go binary that embeds a full React frontend. Choose from 21 chart types including line, bar, area, pie, scatter, bubble, funnel, sankey, heatmap, calendar, sparkline, waterfall, gauge, treemap, radar, and candlestick, plus metric cards, data tables, text blocks, and image widgets. The built-in semantic layer lets you define metrics and dimensions once in reusable model files, then reference them from any widget while DAC generates the SQL automatically. Connect to Postgres, MySQL, Snowflake, BigQuery, Redshift, Databricks, and DuckDB through standard Bruin connection configs. Interactive filters with date pickers, dropdowns, multiselects, and search inputs inject values via Jinja templating and re-execute only affected widgets. Live reload via Server-Sent Events refreshes connected browsers instantly when you save a file. Export dashboards as self-contained static HTML with baked-in query results for S3, GitHub Pages, or offline sharing, and render slide decks via the Google Slides export command. On RepoCloud, deploy DAC on a dedicated VPS with root SSH access and persistent storage for your dashboard definitions and database connections under the AGPL-3.0 license.
Dashwise
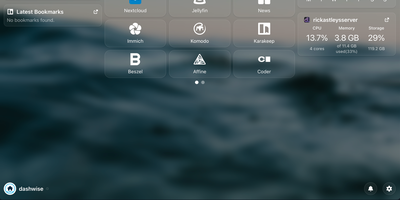
Your homelab grew one service at a time until opening the right one became a memory test, and Dashwise is the dashboard that puts them all in one place. Arrange movable widgets and one-line glanceables around the clock, group links into groups and folders, and build separate pages for the views you actually use. Every piece is configured through the interface itself, so shaping your dashboard never means editing config files by hand. Hit Ctrl+K and the spotlight search jumps you to any link or integration, or fires a search engine bang when the answer lives outside the lab. Subscribe to RSS feeds on the news page to keep up without leaving the dashboard. Other services can push notifications straight into Dashwise, so alerts from your stack land beside the links that fix them. Integrations defined as simple files add widgets, glanceables, and shortcuts for your favorite self-hosted apps, and new ones can be created without touching the core. Accounts are built in, with OIDC single sign-on for households or teams who already run an identity provider. Running on a dedicated VPS on RepoCloud with guaranteed CPU, RAM, and SSD, full root SSH access, and a browser serial console. GPL-3.0 licensed.
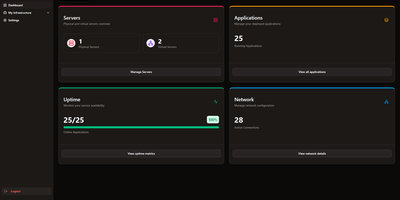
CoreObs
CoreObs delivers a unified self-hosted dashboard that replaces the typical combination of Uptime Kuma, Homer, and separate monitoring tools with a single interface for managing your entire server infrastructure. The Next.js frontend with shadcn components provides a modern dark-themed UI displaying server hardware metrics collected by a lightweight Go agent that leverages Glances for hardware abstraction — streaming real-time per-core CPU load, RAM utilization, NVIDIA GPU statistics, disk usage, system uptime, and load averages via WebSocket connections. The application registry tracks all self-hosted services with configurable uptime monitoring, availability history charts, and instant notifications through Discord, Telegram, Pushover, and email when services go down or recover. Quick-access links provide one-click navigation to each application's management panel directly from the dashboard. The network visualization module built on React Flow enables creating visual topology maps of your infrastructure with drag-and-drop nodes representing servers, switches, and services connected by labeled edges. Server data can be organized with tags, copied between entries, and monitored with configurable pagination and compact view modes. Deploy via Docker Compose with three containers — the Next.js web interface, the Go monitoring agent, and PostgreSQL 17 for persistent storage. Running on a dedicated VPS on RepoCloud with guaranteed CPU, RAM, and SSD, full root SSH access, and a browser serial console. MIT licensed.
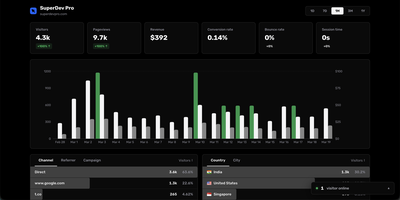
Traffic Source
Traffic Source answers the three questions every site owner actually asks: who showed up, where did they come from, and did they pay. The live dashboard counts visitors in real time alongside pageviews, sessions, bounce rate, and session duration, with no cookie banner required because tracking uses no cookies at all. Referrer and UTM breakdowns show exactly which campaigns, newsletters, and posts earn their traffic, while country and city data arrives through proxy headers. Visitor journeys replay every page a person viewed before converting, so you can see the path from first click to checkout instead of guessing. Connect Stripe once and payments are matched to the sessions that produced them automatically, with no webhook plumbing to maintain. The affiliate system lets you create partners with custom commission rates and shareable referral links, and each affiliate gets a public dashboard showing their own clicks and earnings. Search Console data is pulled into the same screen, where a keyword explorer shows the pages, countries, and devices behind any query. One tiny tracking script covers all your sites, including single-page apps. Running on a dedicated VPS on RepoCloud with guaranteed CPU, RAM, and SSD, full root SSH access, and a browser serial console. MIT licensed.
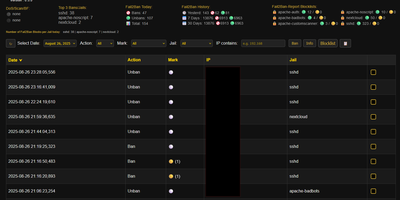
Fail2Ban Report
Fail2Ban quietly bans thousands of bots on a typical VPS and just as quietly keeps the whole story buried in a log file nobody reads, and Fail2Ban Report digs that story out into a dashboard you will actually open. Shell scripts convert each day of fail2ban.log into JSON, and the web interface lays every ban and unban on a searchable, filterable timeline you can slice by jail, server, or time window. Aggregated statistics for today, yesterday, seven days, and thirty days show which jails absorb the most attacks, while markers flag repeat offenders and escalating ban counts so persistent scanners stand out from one-time noise. Blocklists live per jail and per server as plain JSON, and ban or unban actions execute through UFW, giving you permanent bans that survive independently of jail restarts. Bulk actions handle whole ranges at once, with a pending state until the next sync applies them. Multiple servers feed one console through a pull-based HTTPS endpoint, so a fleet of small machines reports to a single pane without exposing SSH. Optional AbuseIPDB and IP-Info lookups add reputation and region context to any address. Running on a dedicated VPS on RepoCloud with guaranteed CPU, RAM, and SSD, full root SSH access, and a browser serial console. GPL-3.0 licensed.
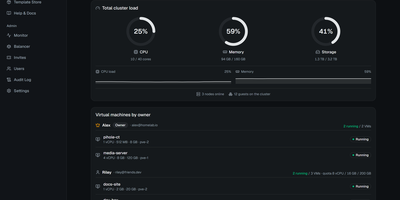
ProxMate
You have a Proxmox cluster with spare capacity and people who keep asking you for a VM: ProxMate turns that cluster into an invite-only cloud where those people help themselves, inside limits you set. Invite links carry CPU, memory, and disk quotas, and tenants spin up VMs or LXC containers from an ISO, the Template Store, or twenty curated cloud images, pasting an SSH key to get a ready-to-SSH box in about a minute. Automatic placement picks the node with the image and the most free capacity, so nobody needs to learn your topology. Projects group machines with per-project usage totals and whole-project start and stop, and any VM can be shared with another tenant as viewer, operator, or manager, never with delete rights. Both a graphical noVNC console and a text console with copy and paste run in the browser, so access never needs open ports, and an optional per-VM browser IDE puts VS Code inside the guest. Backups run on schedules with rolling retention and one-click restore, snapshots are instant, power schedules stop dev boxes overnight, and time-boxed invites suspend access without deleting anything. Admins watch live per-VM sparklines, audit every action, and balance memory across nodes with live migration. Running on a dedicated VPS on RepoCloud with guaranteed CPU, RAM, and SSD, full root SSH access, and a browser serial console. AGPL-3.0 licensed.
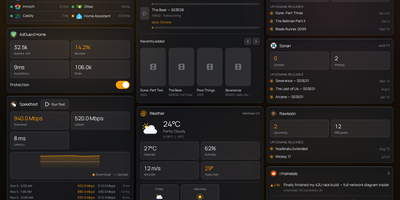
Labby
Labby gathers a whole homelab onto one live dashboard you host yourself, covering services, containers, downloads, and media servers. Widgets watch your service monitor, Docker containers, qBittorrent or Transmission queues, SABnzbd, AdGuard Home, Jellyfin, Emby, Plex, Beszel, Radarr, Sonarr, plus weather, calendar, speedtest, bookmarks, Reddit, and Hacker News, and the server pushes every change to your browser over server-sent events so nothing waits on a refresh timer. The dashboard is not a read-only poster: start and stop containers, pause and resume torrents, and toggle AdGuard protection straight from its widgets. Everything configures from the in-app Manage Services page, where service URLs, API keys, poll intervals, and multiple instances of the same integration (two Radarr servers, say) live in a small SQLite database instead of scattered environment files. Named color schemes restyle the board and save with the config, and icon sources span dashboard-icons, selfh.st, Lucide, or your own URLs. Login is off by default for trusted home networks, with a clear warning to keep it behind a LAN, VPN, or forward-auth proxy, and optional OIDC sign-in through Authentik, Authelia, Keycloak, or Pocket ID when you want a real front door. One container, one volume, and your lab finally explains itself at a glance. Running on a dedicated VPS on RepoCloud with guaranteed CPU, RAM, and SSD, full root SSH access, and a browser serial console. MIT licensed.
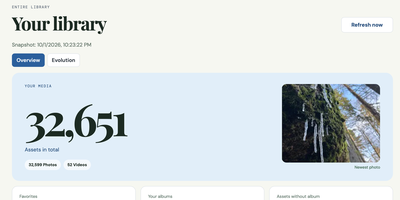
Immich Insights
Immich Insights turns the photo library you already keep in Immich into a year-in-review style dashboard of how you actually shoot. Connect it with your own Immich API key and it reads your asset metadata into a local snapshot, without copying your original photos, then builds the overview Immich itself never shows: total photos and videos, storage used, favorites, albums, and your newest additions. Pick any year or a custom date range and see that period's shooting volume, favorites, albums, and devices. Camera statistics break your library down by device and manufacturer, with leaderboards you can correct when the same camera appears under different names. Exposure analysis shows your ISO, focal length, and shutter speed distributions, the focal lengths you reach for most, and how your settings shift by hour of day. Rhythm charts map your shooting by month, weekday, and hour, with a calendar heatmap of your most active days. A zoomable timeline marks the moments that matter: first photo, a new device joining the library, your longest gap, your busiest day ever. People and location views count faces and mapped places by country and continent, and a photography profile scores your habits. Clicking any chart value opens the matching photo thumbnails, and reports export as PDF, CSV, or JPG. Running on a dedicated VPS on RepoCloud with guaranteed CPU, RAM, and SSD, full root SSH access, and a browser serial console. MIT licensed.
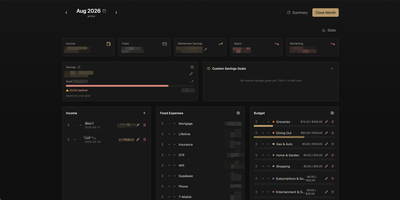
PayMe
PayMe is a privacy-first personal finance dashboard that runs entirely on your own hardware with zero third-party service dependencies. The Rust backend compiled to a single binary serves a React 19 frontend built with Vite, TypeScript, and Tailwind CSS 4, storing all financial data in a local SQLite database that auto-migrates on startup. Monthly dashboards track income entries, fixed expenses like mortgage and utilities, and budget categories with real-time progress bars showing spending against configurable limits. The savings module includes goal tracking with percentage-based progress indicators, custom savings goals for targeted objectives, retirement savings projections with breakdown analysis, and projected savings calculations. Variance analysis compares actual spending against budgets across categories. Drag-and-drop reordering powered by dnd-kit lets you arrange income sources, expenses, and budget items to match your workflow. The interactive charts rendered by Recharts visualize spending trends, income patterns, and savings trajectories. Month-by-month navigation tracks financial history over time, while the Summary and Stats views aggregate data across periods. JWT-based authentication secures access, and the full OpenAPI Swagger documentation at the /swagger-ui endpoint exposes every API route for automation and integration. Docker Compose deployment creates a minimal image with the compiled Rust binary and static frontend assets, running on port 3001 behind nginx, Caddy, or Traefik reverse proxy with HTTPS. On RepoCloud, deploy PayMe on a dedicated VPS with persistent SQLite storage, root SSH access, and complete privacy over your household financial data, all under the MIT license.
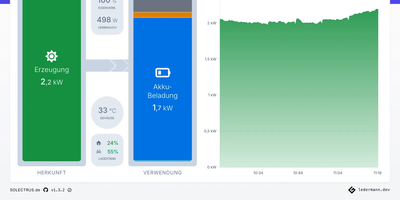
Solectrus
The inverter app tells you the sun shone; SOLECTRUS tells you what that sunshine was worth. It is a dashboard for your whole photovoltaic system that balances every watt: what the panels produced, what the house consumed, what the battery stored, and what crossed the grid meter in either direction, for any period you care to name. Up to five generators, from the main roof array to a balcony power plant, appear individually or summed, and up to twenty custom consumers, wallbox included, get their own accounting. The Power-Splitter shows how much green electricity actually landed in the car, the heat pump, or the washing machine, and what each load truly cost once lost feed-in revenue counts. Enter your electricity prices and feed-in tariff, including their changes over the years, and it computes savings, self-consumption costs, return, and the day the system has paid for itself from measured data rather than the sales brochure. Forecasts from pvnode, Solcast, or Forecast.Solar look up to seven days ahead using your location, orientation, tilt, and peak capacity. Heat pump owners see generated heat and coefficient of performance beside the power draw. Everything lands in InfluxDB and stays there, with daily aggregation keeping multi-year views fast, trends against last month or last year, and a Top-10 of your best and worst days. Running on a dedicated VPS on RepoCloud with guaranteed CPU, RAM, and SSD, full root SSH access, and a browser serial console. AGPL-3.0 licensed.
Edi Life OS
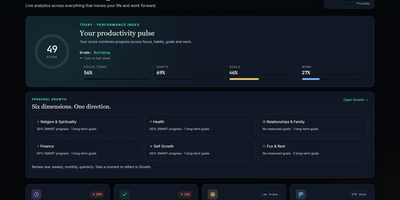
Edi Life OS puts the habits, goals, projects, money, focus sessions, and notes that usually live in five separate apps into one calm dashboard on your own server. Start the day from an Overview that rolls focus, habit trends, goals, finances, and the week ahead into one readable score. Connect long-term goals to six life areas, drive progress from a checklist, a measure, or a habit you actually keep, and use weekly, monthly, or quarterly reviews to choose the next honest step. Log daily habits with streaks and monthly progress, run timed focus sessions with short and long breaks, and keep a history of the deep work you finished. Track expenses, income, budgets, debts, and credits in your chosen currency, including recurring entries that land straight in the ledger. Plan projects on draggable Kanban boards with labels, priorities, due dates, checklists, comments, and attachments, then see card deadlines and money dues together in one calendar. Capture Markdown notes with preview and export, pin sticky notes with colors and connections, and give each account its own private workspace, theme, and currency. Ask an AI assistant through the optional MCP server to read your dashboard, create goals, log habits, or record expenses through a token-protected API that never touches the database directly. Running on a dedicated VPS on RepoCloud with guaranteed CPU, RAM, and SSD, full root SSH access, and a browser serial console. MIT licensed.
AliangBoard
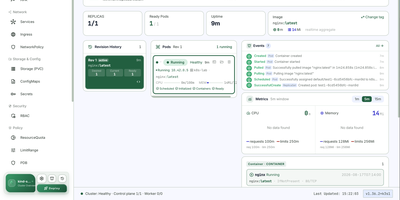
AliangBoard puts every Kubernetes cluster you run behind one web panel, where you manage resources yourself or ask an AI agent to do it with your approval. Connect each cluster with a bearer token or basic auth and the panel persists the connection, so switching clusters, namespaces, and workloads takes one click instead of another kubeconfig. More than thirty resource types stay in sync: create workloads, services, ingress, config, storage, and RBAC through structured forms, edit anything as YAML, apply multi-document manifests at once, and delete optimistically with automatic rollback when the API refuses. Pod work goes deep: a tmux-backed exec terminal survives browser refreshes, port-forwards resolve services to their backend pods, files move up and down with progress, and debug containers inject into running pods without restarting them. Day-two operations are buttons, not flag memorization: scale, rolling restart, rollout undo, manual CronJob triggers, and node cordon or drain. Global search, a layered namespace topology, live event streams, and CPU and memory metrics keep orientation effortless. Then there is the operator: an Agent workbench and MCP server let your LLM read logs, debug containers, and propose changes in natural language, while every write waits for a human click and lands in an audit log that names who did what. Running on a dedicated VPS on RepoCloud with guaranteed CPU, RAM, and SSD, full root SSH access, and a browser serial console. Apache-2.0 licensed.