Lab Dash
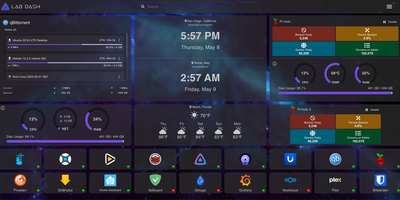
Every homelab deserves a control center that looks as good as the services it manages. Lab Dash gives you a customizable, drag-and-drop dashboard where every tile earns its spot. Add shortcut widgets linking to your Plex, Grafana, Nextcloud, or any service with automatic health check indicators showing green or red status at a glance. The system monitoring widget displays real-time CPU usage, memory consumption, network throughput, disk utilization, and temperature readings by mounting the host /sys directory as a read-only volume. Integrate Pi-hole stats, qBittorrent download progress, and media server widgets for Jellyfin, Plex, or Emby directly on your grid. Multiple pages let you organize services by category, and the search bar finds any tile instantly. Customize the background image from a local upload or URL, set a custom title and tab name, and choose your preferred search provider including self-hosted options like SearXNG. All sensitive configuration data is encrypted locally with AES-256-CBC, and only administrator accounts can modify the layout. Install Lab Dash as a Progressive Web App on desktop, phone, or tablet for a native app experience with offline capability. Configurations export as backup files for easy migration between instances. On RepoCloud, deploy Lab Dash on a dedicated VPS with root SSH access and Docker socket connectivity under the GPL-3.0 license.
Jump
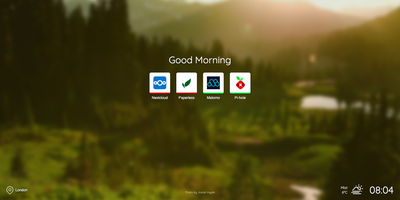
Open a new tab and the whole homelab should answer two questions instantly: where is everything, and is it still alive? Sites appear as large tappable icons with custom artwork, or Jump fetches each service's original favicon on its own. Green means up, red means down: real-time status monitoring paints every entry, so a failed service announces itself before anyone files a complaint. Tags spread links across multiple pages, and the tag panel jumps between home, media, admin, or any grouping you invent. A keyboard shortcut opens search, matching names, tags, and URLs as you type, and the same box can hand a query to your chosen search engines for everything beyond the lab. Weather and local time sit in the corner through OpenWeatherMap, backed by your own background photos or a fresh Unsplash image each visit. Greeting, clock format, and site name are all switchable, and the layout adapts to a phone screen held in one hand. Configuration lives in plain mapped folders for backgrounds, favicons, search engines, and sites, so a backup is just a copy. It serves on port 8080 in Docker, installs on Kubernetes with a community Helm chart, or runs directly under PHP on a web server. Running on a dedicated VPS on RepoCloud with guaranteed CPU, RAM, and SSD, full root SSH access, and a browser serial console. MIT licensed.
ServerBee
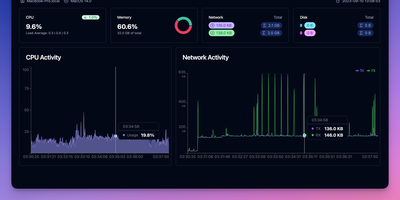
ServerBee delivers complete fleet monitoring from a single Rust binary that embeds both the server and web UI, requiring no external database or heavy runtime. Lightweight agents installed on each node stream CPU, memory, disk, network, load, temperature, GPU, and disk I/O metrics over persistent WebSocket connections to a central server backed by embedded SQLite. The real-time React dashboard presents 17 drag-and-drop widget types across custom layouts, with historical charts spanning one hour to 30 days and monthly traffic statistics with billing-cycle prediction and cost insights including burn rate and per-resource unit cost scoring. Network monitoring covers ICMP, TCP, and HTTP ping probes, service monitors for SSL certificates, DNS records, HTTP keyword matching, TCP ports, and WHOIS expiration, plus network-quality probing across 96 China 3-ISP and international presets with IP-quality and streaming-unlock detection. Remote management features include a web terminal with sandboxed file manager, Docker container stats with logs and events, firewall configuration, and agent auto-update capabilities. Public status pages display 90-day uptime timelines, while alerting supports email and webhook notifications with flexible trigger expressions. A native iOS companion app provides mobile monitoring access. Deploy via Docker or download the single binary for Linux, macOS, or Windows, running on a dedicated VPS on RepoCloud with guaranteed CPU, RAM, and SSD, full root SSH access, and a browser serial console. AGPL-3.0 licensed.
Appsmith
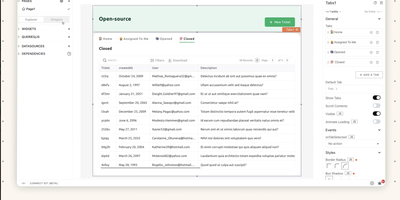
Admin panels, database GUIs, dashboards, approval flows, customer support consoles - Appsmith builds the internal tools your team keeps postponing, on an open-source low-code platform. The UI assembles from 45+ drag-and-drop widgets - tables with server-side pagination and inline editing, charts, forms, lists, buttons - which bind to data through {{ }} JavaScript expressions anywhere in the editor. Datasources cover PostgreSQL, MySQL, MongoDB, MS SQL, Redis, Snowflake, and more, plus any REST or GraphQL API, with SaaS integrations and AI query support for prompt-based steps inside apps. When the widget library falls short, custom widgets are plain JavaScript, HTML, and CSS, and external JS libraries can be imported, which keeps the platform extensible where pure no-code tools hit walls. Git-based version control enables branch-based collaboration, review, and rollback of app definitions. Queries and JS objects hold the business logic layer between datasources and UI. Self-hosted via Docker or Kubernetes, with role-based access control for published apps.
Home Assistant
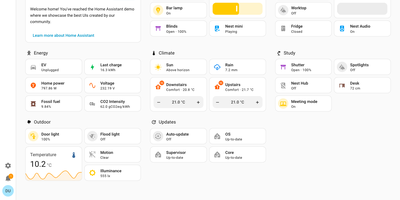
Your house already has lights, locks, sensors, thermostats, and speakers from many brands, and Home Assistant gives them one local control room with no vendor cloud in the loop. To close the shutters when the outdoor temperature holds above 25 °C, or to be alerted when the garage door is left open, build the routine in the visual editor: When, And if, Then do. Scenes, scripts, and blueprints package it for reuse, and run traces show what it did. More than 1,500 integrations cover Zigbee, Z-Wave, Matter, Thread, MQTT, ESPHome, Bluetooth, Hue, and Sonos, and network discovery offers known devices for one-step setup. To see the house at a glance, drag tile, thermostat, gauge, graph, and map cards into a dashboard, then put it on a TV with Home Assistant Cast. The Energy dashboard answers where the power goes, drawing solar, grid, battery, gas, and water as one distribution diagram with cost totals and per-appliance tracking. To talk to the house, use Assist: natural-language commands, wake words, and custom sentences run locally or through Home Assistant Cloud. The map panel shows who is home, plotting people against zones such as Home, Work, and School from the iOS and Android companion apps. Areas and labels keep large setups tidy, and multi-factor authentication guards each account. Running on a dedicated VPS on RepoCloud with guaranteed CPU, RAM, and SSD, full root SSH access, and a browser serial console. Apache-2.0 licensed.
Kubewall
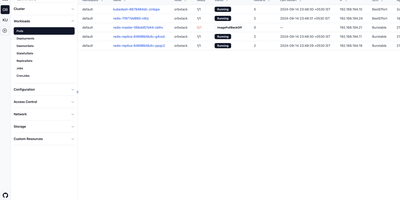
One binary is all that stands between you and every Kubernetes cluster you own: Kubewall opens a realtime web dashboard over all of them, with no agents to install and nothing phoning home. Switch between clusters from the sidebar and browse workloads, networking, storage, configuration, and access control in tables that update live as pods start, fail, and reschedule. Open any resource to inspect its overview, edit its manifest in the built-in YAML editor with validation, watch its events, or stream logs aggregated across pods and containers with search and tail controls. A command palette jumps straight to any resource type, while faceted filters and global search cut through thousands of objects by name, namespace, label, or image. Scale deployments, restart pods, trigger rollout restarts, and apply manifests with a click, or forward a cluster service to your local machine without memorising kubectl incantations. An integrated AI assistant, connected to OpenAI, Claude, Gemini, DeepSeek, OpenRouter, Ollama, or a local model, helps troubleshoot failures and review configurations right beside the resource it concerns. Running on a dedicated VPS on RepoCloud with guaranteed CPU, RAM, and SSD, full root SSH access, and a browser serial console. Apache-2.0 licensed.
nextDash
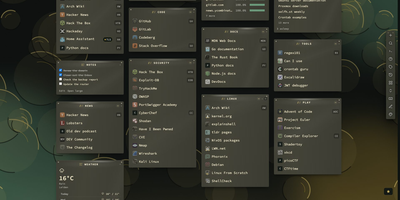
A bookmark bar that also knows if your homelab is on fire is the pitch behind nextDash. Links live on pages and categories with tags, notes, an inbox for unsorted finds, and one search panel for bookmarks, commands, and containers. Mark any link as Monitor and the server checks it every few minutes, keeping 30 days of uptime, certificate and domain expiry dates, and drift warnings, with alerts to ntfy, Slack, Discord, Telegram, Gotify, Apprise, or a phone push. A Containers view lists every Docker container with logs, start, stop, and update with automatic rollback, each matched to its bookmark. Dashboard widgets cover weather, feeds, CPU, memory, disks, Unraid, Jellyfin, Plex, Sonarr, Radarr, qBittorrent, and Home Assistant. A theme studio offers 390 themes and 267 backdrops in six languages, and an optional assistant answers in plain words when you switch it on. Imports arrive from every browser, Pocket, Raindrop, and linkding, and automatic backups with a 30-day trash protect the collection. The weekly digest sums up broken links, expiring certificates, and pending container updates. Running on a dedicated VPS on RepoCloud with guaranteed CPU, RAM, and SSD, full root SSH access, and a browser serial console. MIT licensed.
AIUsage
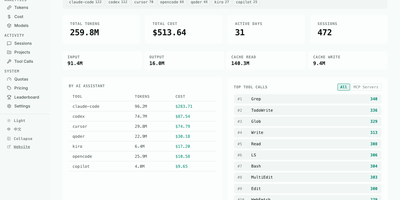
AIUsage shows where your AI coding spend actually went: it reads the session logs that Claude Code, Codex, Cursor, OpenCode, Copilot, Gemini CLI, and many other assistants leave behind, then turns them into one dashboard with tokens, estimated dollars, and activity. The Overview page totals tokens, cost, active days, and sessions for today, this week, this month, or all time, and filters by tool or device. Cost and Tokens pages chart daily spending and input, output, cache, and thinking usage, and Models ranks every model by share. The Sessions table lists duration, tool count, and cost per session, and a detail view walks through each API call and the tools it triggered. Tool Calls shows which built-in, MCP, and skill actions agents use most, Projects ranks directories by spend, and Quotas tracks subscription limits. Optional sync through GitHub, S3, R2, or MinIO merges several machines, and a public leaderboard accepts aggregate totals only. Running on a dedicated VPS on RepoCloud with guaranteed CPU, RAM, and SSD, full root SSH access, and a browser serial console. MIT licensed.
Marketing Dashboard
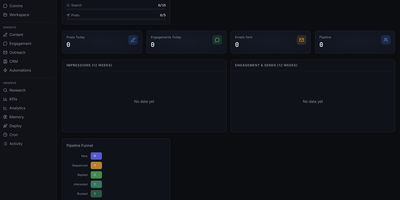
This is a marketing operations control center that replaces fragmented CRM, outreach, content, and analytics tools with a unified self-hosted interface designed for AI agent-assisted go-to-market teams. The CRM module manages leads through a configurable pipeline funnel with stages from New through Sequenced, Replied, Interested, and Booked, tracking source attribution, industry segments, company size, lead quality scores, and LinkedIn URLs per contact. Outreach sequencing supports email campaigns with pause controls, audit endpoints, suppression workflows, and engagement tracking. The content operations surface provides calendar views, content item management, performance metrics, and approval queues for editorial control. Analytics and KPI dashboards show impressions, engagement, and send volumes over configurable time periods, with optional connectors to Plausible, Google Analytics 4, X, and LinkedIn for cross-platform reporting. The OpenClaw-native agent runtime enables dynamic agent and squad discovery, workspace management, session monitoring, and communications surfaces. Automation scheduling uses cron job templates with OpenClaw-compatible schedule variants including cron expressions, every intervals, and at timestamps. The tech stack combines Next.js 16 App Router with React 19, Tailwind CSS 4, Recharts, and Zustand for state management. Authentication supports session cookies, API keys, and optional Google OAuth with role-based access controls. All state persists locally in SQLite via better-sqlite3 with no required external infrastructure. On RepoCloud, deploy Marketing Dashboard on a dedicated VPS with persistent SQLite storage, root SSH access, and complete control over your marketing operations data, all under the MIT license.
ILLA Builder
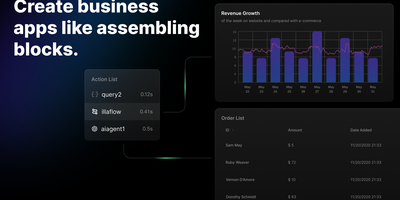
ILLA Builder turns internal tool development from weeks of custom frontend work into hours of drag-and-drop assembly, combining a visual canvas of 60+ UI components with direct connections to over 20 data sources. The TypeScript frontend, powered by ILLA Design, offers data grids backed by MUI X Data Grid Premium, charts, forms, rich-text editors, PDF viewers, QR code scanners, calendar widgets, map embeds, and video players. Each component supports Handlebars-style expression bindings that reference query results, widget state, or global variables, while the reactive execution tree resolves dependencies in topological order and re-evaluates downstream properties whenever upstream values change. Data connectors provide GUI-driven access to PostgreSQL, MySQL, MongoDB, MSSQL, Supabase, Redis, Firebase, CouchDB, Airtable, Google Sheets, Stripe, AWS S3, Hugging Face models, and REST or GraphQL endpoints without writing connector code. Real-time collaboration through WebSocket lets multiple developers edit the same application simultaneously with live cursor tracking and synchronized Redux state. ILLA Flow adds workflow automation triggered by schedules or webhooks, chaining actions across data sources. The Go backend handles application state, resources, and attribute-based access control using PostgreSQL for persistence, Redis for caching, MinIO for file storage, and Envoy for API ingress. Deploys as a single Docker container on port 2022 or scales horizontally on Kubernetes. Running on a dedicated VPS on RepoCloud with guaranteed CPU, RAM, and SSD, full root SSH access, and a browser serial console. Apache 2.0 licensed.
TeslaMate
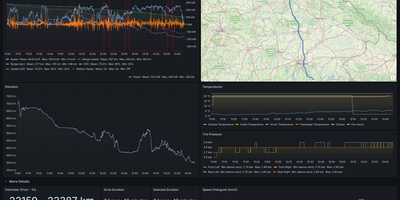
Logging every drive, charge, and idle stretch of a Tesla to a database you own, TeslaMate shows where the battery went, including degradation, vampire drain, and charging cost. Battery health comes first: the dashboard estimates usable capacity, range lost, and degradation against mileage. Idle losses come next, with Vampire Drain listing how much charge disappears during every idle period and a States view recording every online, asleep, and offline stretch. The car is left alone to fall asleep, so logging adds no extra vampire drain. Charging sessions show curves, energy added and used, efficiency, and cost, using per-location prices attached to geo-fences drawn on a map. Each drive records second-by-second speed, power, elevation, and temperature, plotted on a route map beside tire pressure and consumption charts. Trip, Drives, Efficiency, Drive Stats, Mileage, Updates, Statistics, and a lifetime driving map fill in the rest. Live vehicle data goes out over MQTT to Home Assistant, Node-RED, and Telegram, and old history imports from TeslaFi or tesla-apiscraper. Several vehicles on one Tesla account work together, addresses are looked up automatically, and the web interface offers light, dark, or system themes in 19 languages. Sign-in uses Tesla access and refresh tokens that TeslaMate encrypts with a key you set. It works best on an always-on server. Running on a dedicated VPS on RepoCloud with guaranteed CPU, RAM, and SSD, full root SSH access, and a browser serial console. AGPL-3.0 licensed.
Rewindarr
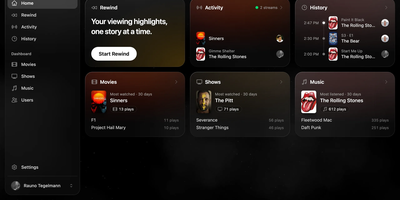
Spotify gets a Wrapped; your media server deserves one too. Rewindarr is an open-source companion for Plex and Jellyfin that turns play history into a story your users step through, card by card: total watch time, how it split across movies, shows, and music, how they rank against the average viewer, and the viewing personality their habits earn them, ending in a summary they can save as an image and share. The same deployment doubles as an everyday dashboard for the whole server, with watch time, requests, library size, and per-library leaderboards for movies, shows, music, and users across a week, a month, a year, or all time. Live activity shows what is streaming right now, and searchable history groups binges together so a weekend disappears into one tidy entry. Ratings from TMDB, IMDb, and Rotten Tomatoes sit beside every title, request buttons reconnect viewers with deleted favourites through Seerr, and anonymisation trims user details when you share the dashboard wider. Statistics flow in from Tautulli or Tracearr for Plex and from Tracearr for Jellyfin, everyone signs in with the Plex or Jellyfin account they already have, and the installable app works on the TV-side phone as happily as on a desktop. Running on a dedicated VPS on RepoCloud with guaranteed CPU, RAM, and SSD, full root SSH access, and a browser serial console. GPL-3.0 licensed.
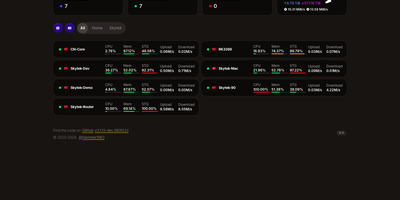
Nezha Monitoring
Keep every VPS, home-lab box, NAS, and router you run on one self-hosted dashboard, with a small agent on each machine reporting whether it is up and how hard it is working. Nezha tracks CPU, memory, swap, disk, load, traffic, process counts, and TCP and UDP connections on Linux, Windows, macOS, OpenWRT, and Synology machines, plus GPU and temperature where supported. Servers sort into groups and appear as cards, a list, or a world map, with live charts and, when the optional time-series database is on, 1, 7, and 30 days of history. HTTP GET, ICMP Ping, and TCPing monitors run from the servers you choose, chart latency and packet loss, and warn about HTTPS certificate changes and upcoming expiry. Alert rules watch offline servers, resource use, bandwidth, and cycle traffic limits, then message Telegram, Slack, Matrix, Feishu, DingTalk, or any webhook. A browser terminal and file manager handle quick fixes, while scheduled or alert-triggered tasks run backups, restarts, and scripts across many servers. DDNS updates Cloudflare, Tencent Cloud, or Hurricane Electric records when an agent's IP changes, and NAT traversal publishes a home router or NAS page on your own domain. Admin and user roles, scoped API tokens, and an optional MCP endpoint let people and AI tools list servers and run commands within their permissions. Running on a dedicated VPS on RepoCloud with guaranteed CPU, RAM, and SSD, full root SSH access, and a browser serial console. Apache-2.0 licensed.
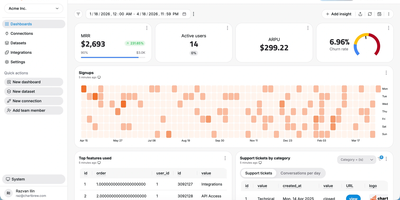
Chartbrew
Chartbrew transforms raw database queries and API responses into polished, shareable dashboards without requiring a data engineering team. Connect to MySQL, PostgreSQL, MongoDB, Firestore, or any REST API, then build datasets using the visual query editor with syntax highlighting and auto-completion. Charts render through Chart.js with line, bar, pie, donut, radar, polar, KPI card, and table visualizations, each customizable with colors, legends, filters, and goal indicators. An AI assistant accelerates dashboard creation by generating queries and suggesting chart configurations from natural language descriptions of the metrics you want to track. Reusable datasets let teams prepare data transformations once and share them across multiple charts, while automatic scheduling through BullMQ and Redis refreshes data at intervals from every 10 minutes to monthly. The embed feature generates standalone chart URLs for insertion into external websites, internal tools, or customer portals, and the Reporting API enables programmatic dashboard management and automated report delivery. Team workspaces with role-based permissions control who can view, edit, or manage data connections. Nearly 4,000 GitHub stars reflect steady community adoption. The platform runs on Node.js with Express and Sequelize ORM, supporting MySQL or PostgreSQL as its application database. Running on a dedicated VPS on RepoCloud with guaranteed CPU, RAM, and SSD, full root SSH access, and a browser serial console. FSL-1.1-MIT licensed (converts to MIT two years after each release).
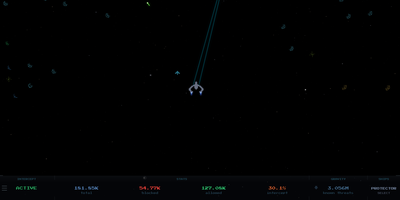
PH Intercept
A blocklist working silently in the background is hard to appreciate, so PH Intercept turns your DNS traffic into a live arcade battle: every allowed query flies by as a friendly ship, and every blocked query spawns as an invader your interceptor shoots down. It streams query events live from the API of your existing Pi-hole v6, AdGuard Home, or Technitium server, so the battle on screen is your network's real traffic the moment it happens. Repeat domains level up on screen: friendly shuttles grow into heavy transports and gold capital ships, while blocked domains mutate from crab invaders into orange drones and purple bosses. The interceptor hunts by itself, launching a support drone at five on-screen threats and a second at ten, and it swaps among seven selectable ships, from the Falcon and the Enterprise to the Normandy. The bottom HUD doubles as a control panel: pause blocking for ten seconds, thirty seconds, or five minutes with a synced countdown, watch totals climb, and trigger a gravity list update in place. Client and domain labels can ride beneath each entity, noisy domains disappear through regex ignore patterns, a second DNS server can join in split-screen two-player mode, and viewer settings persist per browser. The backdrop ranges from a starfield plotted from about 12,200 real stars to nebula, synthwave, and custom image modes. Running on a dedicated VPS on RepoCloud with guaranteed CPU, RAM, and SSD, full root SSH access, and a browser serial console. MIT licensed.
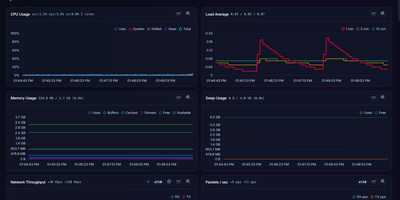
Kula
Kula watches a Linux server every second and turns CPU, memory, disks, network, containers, and applications into a live dashboard you can open before trouble becomes downtime. Follow total and per-core CPU, load averages, memory and swap pressure, disk I/O, filesystem space, temperatures, GPU load, and network throughput as charts update live in the browser. Drag to zoom into history, switch to focus or TV mode for a wall display, and check the System Info page when you need the hardware story behind a spike. Watch Docker, Podman, and cgroup containers beside host metrics, then add PostgreSQL, MySQL or MariaDB, nginx, and Apache monitoring or define custom metrics for the odd service only your team understands. Scrape the Prometheus endpoint into an existing observability stack, open the terminal UI over SSH for a quick live read, or ask the optional local Ollama assistant to discuss charts without sending data to a cloud service. Protect the dashboard with optional Argon2id logins and multiple users, schedule storage snapshots, and keep the whole tool working on closed networks with no external calls. Running on a dedicated VPS on RepoCloud with guaranteed CPU, RAM, and SSD, full root SSH access, and a browser serial console. AGPL-3.0 licensed.
Bloomberg Terminal
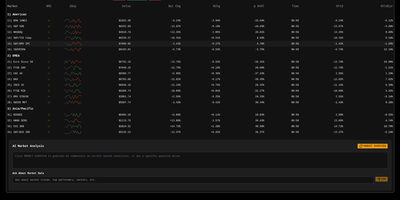
With 1,450+ GitHub stars and a live demo on Vercel, this Bloomberg Terminal clone delivers a professional-grade financial dashboard without the $24,000 annual seat license. The Next.js 15 App Router with React 19 and TypeScript serves a single-page terminal interface optimized for constantly mutating financial data, with partial pre-rendering enabling sub-500ms initial loads even on data-heavy views. Upstash Redis caches AlphaVantage market data to minimize API calls while maintaining sub-second update latency through React Query polling with configurable refresh rates. OpenAI integration provides AI-powered market insights, sentiment analysis, and trend interpretation directly within the terminal interface. Multiple specialized views cover market data tables with bid/ask spreads, financial news aggregation with category filtering, market movers highlighting top gainers and losers, and volatility analysis with historical comparison charts. Jotai atoms manage local state for watchlists, layout preferences, and terminal sessions while React Query handles server-state synchronization with aggressive stale-while-revalidate caching. The shadcn/ui component library with Tailwind CSS delivers accessible, keyboard-navigable interface elements styled after Bloomberg's iconic dark terminal aesthetic. Security features include origin restriction, rate limiting via Redis, and Zod-based input validation on all API routes. Motion (formerly Framer Motion) animates transitions between views and data updates without layout shift. Running on a dedicated VPS on RepoCloud with guaranteed CPU, RAM, and SSD, full root SSH access, and a browser serial console. MIT licensed.
World Monitor
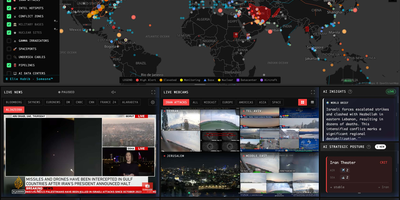
World Monitor replaces twenty or more browser tabs by fusing geopolitical, military, financial, and infrastructure signals onto a single interactive canvas built with TypeScript, Vite, globe.gl with Three.js for the 3D globe, and deck.gl with MapLibre GL for the flat map. World Monitor ingests live data from 530 upstream sources including ACLED and UCDP for conflict events, OpenSky Network for military and civilian aircraft, AISStream for vessel positions, NASA FIRMS for satellite fire detection, USGS for earthquakes, and FRED, IMF, BIS, and Finnhub for macroeconomic and market data. The Country Instability Index v8 computes real-time stress scores across 31 Tier-1 nations, while the finance radar tracks 29 stock exchanges, commodities, and cryptocurrency with a 7-signal market composite. Six specialized dashboard variants — World, Tech, Finance, Commodity, Energy, and Happy — deploy from a single codebase. AI summarization runs locally through Ollama and LM Studio integration or optionally via Groq and OpenRouter cloud providers, with Transformers.js powering browser-side inference. The platform supports 26 languages with native-language feeds and RTL layout, and provides MCP server integration for AI agent connectivity. Running on a dedicated VPS on RepoCloud with guaranteed CPU, RAM, and SSD, full root SSH access, and a browser serial console. AGPL-3.0 licensed.