Homepage
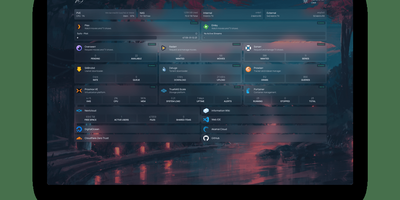
With over 31,000 GitHub stars and 430 contributors, Homepage has become the definitive self-hosted dashboard for homelab enthusiasts and server administrators who want a single, elegant landing page for all their services. The dashboard renders as a fully static site at build time for instant page loads, while a Node.js backend securely proxies all API requests to prevent exposing service credentials to the browser. Docker integration automatically discovers running containers through label-based configuration, populating the dashboard with service status indicators, health checks, and real-time statistics without manual URL entry. Over 100 native service widgets display live data from popular applications including Plex, Jellyfin, Radarr, Sonarr, Home Assistant, Pi-hole, Portainer, Proxmox, Nextcloud, Gitea, and dozens more, each showing relevant metrics like active streams, download queues, or system health directly on the dashboard. Information widgets provide weather forecasts, system resource utilization, search bars, and date/time displays. The layout system supports multiple columns, tabs, and custom CSS for pixel-perfect arrangement of service groups and bookmarks. Built-in authentication options include OIDC integration and password protection. Quick search functionality enables instant access to bookmarks and services with keyboard shortcuts. Internationalization covers 40+ languages with community-maintained translations. Configuration lives entirely in YAML files for version-controlled, reproducible dashboard setups. Deploy on a dedicated VPS on RepoCloud with guaranteed CPU, RAM, and SSD, full root SSH access, and a browser serial console for complete control. GPL-3.0 licensed with an active community and bi-weekly releases.
Larapaper
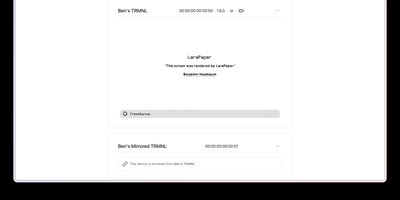
An e-ink frame on your kitchen wall should show your calendar, not beg a cloud subscription for permission; Larapaper is the self-hosted TRMNL server that keeps those screens yours. Devices on your network announce themselves and auto-join, and the admin panel tracks each unit's battery, WiFi strength, firmware, and current screen, from the official TRMNL OG and X to SeeedStudio DIY kits, reTerminal panels, Kindle and Kobo e-readers, and Raspberry Pi displays. Content comes from wherever you like: native plugins and recipe mashups, more than a thousand catalog recipes importable from TRMNL and the community, your own Liquid or Blade markup written in the web editor, or a simple POST to the screen API from any script. Playlists rotate screens on a schedule, so the morning shows trains and weather while the afternoon shows the build board. The render pipeline draws with headless Chrome, converts through ImageMagick to each device's exact palette, and caches results so sleepy e-ink clients wake, fetch, and sleep again in seconds. Run it beside the official cloud as a proxy when you want hybrid coverage, on SQLite for a shelf box or Postgres for a fleet, with dark mode in the admin and Docker Compose for deployment. Running on a dedicated VPS on RepoCloud with guaranteed CPU, RAM, and SSD, full root SSH access, and a browser serial console. MIT licensed.
FounderOS
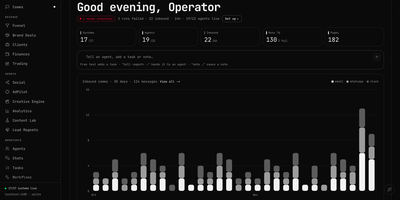
For a solo founder, FounderOS is one live dashboard where AI-assisted departments take care of the busywork of running a company. Home shows system health, agent counts, and inbound message volume, plus a free-text bar that turns a sentence into a task, a note, or an instruction for a named agent. Comms merges email, Slack, WhatsApp, and meeting threads into one inbox with unread counts, needs-reply flags, snooze, mark done, and reply starters that include a drafted answer. Funnel tracks touches, new leads, conversions, and revenue by source, with a pipeline from first touch to converted client. Agents shows a roster of AI seats and a conductor that delegates work, with runs by seat, open task lanes, and the items waiting on you. Tasks adds in-progress, overdue, and runtime stats beside a schedule. The Knowledge Visualizer maps notes, skills, agents, and accounts into a network with matrix, timeline, ranking, and findings views. Clients, Brand Deals, Finances, Social, and Content Lab sit in the same sidebar, and every integration stays optional until you connect it. A bundled demo company makes exploring easy. Creators, small agencies, and one-person businesses get a daily operating view in a single tab. Running on a dedicated VPS on RepoCloud with guaranteed CPU, RAM, and SSD, full root SSH access, and a browser serial console. MIT licensed.
ToolJet
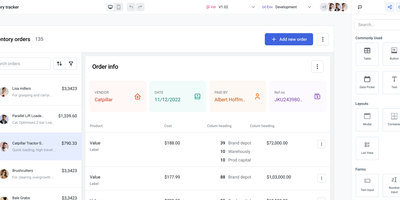
Retool's job, self-hosted: ToolJet is an open-source low-code platform for building internal tools, dashboards, and admin panels. Apps are assembled in a drag-and-drop visual builder with 60+ responsive components, including tables, charts, forms, and lists, and connected to 80+ data sources: PostgreSQL, MySQL, MongoDB, REST and GraphQL APIs, cloud storage, and common SaaS tools. When visual configuration is not enough, you can run JavaScript or Python inline for queries and transformations. A built-in no-code database (ToolJet Database) covers apps that need their own tables without provisioning an external database, Workflows add node-based automation for background jobs with dedicated worker containers and a Redis-backed queue, and multi-page apps with multiplayer editing, inline comments, and mentions support team development. Security is designed for internal data: credentials are AES-256-GCM encrypted, data flows proxy-only through your server so database contents never reach a third-party cloud, and granular per-app access control plus SSO gate each tool. Where Retool-style platforms bill per builder and sometimes per end user, the self-hosted Community Edition serves unlimited builders and users at hosting cost, and full source availability means the platform itself can be forked, audited, and extended. The stack is Node.js and React on PostgreSQL, deployed via Docker.
LangAlpha
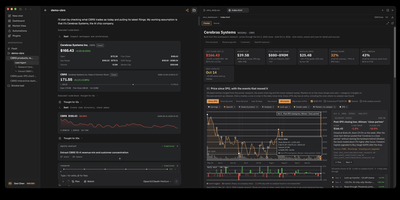
Ask a market question and LangAlpha puts a team of analysts on it: a lead agent splits the work across parallel subagents that read filings, pull prices, and run the numbers in code, then returns a cited answer instead of a guess. Every thesis lives in its own workspace, so files, chats, and the agent's notes are still there tomorrow and each session builds on the last. The deliverables are real ones: Excel models with live formulas, PDF and HTML initiation reports, and interactive dashboards you can click around. Market View draws event badges, support lines, and reference levels straight onto live charts. Automations wake an agent on a weekly schedule or when a stock crosses a price or moves a set percentage, and post results to a feed or a webhook. A Sources panel lists every filing, web page, and data call behind a turn, so you can check the work. Brokerage plugins give each connection read-only, paper, or live permissions, with orders held for your approval. Bring your own model key, a coding plan, or a local model. Running on a dedicated VPS on RepoCloud with guaranteed CPU, RAM, and SSD, full root SSH access, and a browser serial console. Apache-2.0 licensed.
Ziit
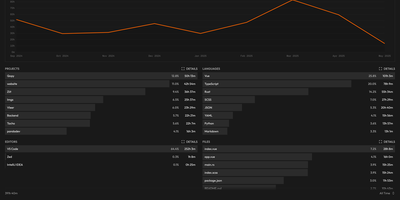
Ziit tracks where your coding hours actually go and shows the answer in a dashboard you host yourself. Install the extension in VS Code, any of its forks, or a JetBrains IDE, and every editing session streams to your instance with its project, language, editor, file, branch, and operating system attached. The dashboard filters by time range and breaks your work down by project and language, so a week of effort becomes a readable chart instead of a vague memory. You sign in with GitHub or email and password, import existing history from WakaTime or a WakAPI instance, and keep building on years of data instead of starting over. README badges embed live coding time for a project into any repository page, turning your profile into a quiet proof of work. A public stats page summarizes the whole instance, and a public leaderboard ranks who logged the most coding hours, which makes self-hosted instances double as community scoreboards. Because the server, the database, and the extensions are all yours, no third-party service sees which files you opened or how long a private project took. Teams can run one instance for everyone and compare effort across projects with the same filters. Running on a dedicated VPS on RepoCloud with guaranteed CPU, RAM, and SSD, full root SSH access, and a browser serial console. AGPL-3.0 licensed.
Nerve
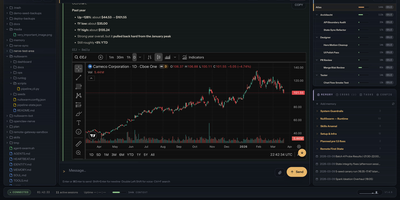
Nerve is the web cockpit for OpenClaw, giving you one real-time screen to run an entire fleet of AI agents instead of chasing them through chat threads. Every agent keeps its own workspace, memory, identity, and skills, and you can switch between agents, browse their files, and edit memory or configuration in a tabbed editor during a live conversation. Work moves onto a kanban board where subagents pick up delegated tasks, and returned work waits in a proposal inbox for your review before it is accepted. Cron jobs run as their own sessions in a navigable session tree, so scheduled automation has logs and output you can actually inspect. Voice is a first-class input: push to talk or use a wake word, watch live transcription, and hear replies spoken back in your chosen language. Ask for a chart and the answer arrives as a real rendered chart, with diffs, file previews, and highlighted code inline in the stream. Token usage, running costs, and context pressure stay visible on every session, so long tasks never quietly drain your budget. Run it privately on localhost, reach it over your LAN behind password authentication and signed-cookie sessions, or keep access inside a Tailscale tailnet. Running on a dedicated VPS on RepoCloud with guaranteed CPU, RAM, and SSD, full root SSH access, and a browser serial console. MIT licensed.
Metabase
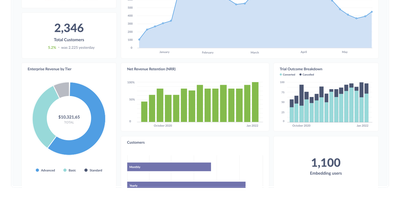
The most widely deployed open-source BI tool, Metabase is a visualization and query layer that sits on top of your existing databases without ingesting or copying data. Non-technical users ask questions through a visual query builder with drill-through menus that answer follow-ups like "broken down by month" without writing a new query, while analysts use the native SQL editor with variables and templates for complex work. Questions assemble into interactive dashboards with filters, auto-refresh, fullscreen mode, and custom click behavior, and dashboard subscriptions email or Slack scheduled reports to stakeholders. It connects to 20+ data sources including PostgreSQL, MySQL, MongoDB, SQL Server, BigQuery, Snowflake, Redshift, and ClickHouse - always querying in place, so there is no second data store to secure, sync, or pay for, and results are always current. Models and metrics let a data team define official, reusable starting points so self-service stays consistent, collections with permissions organize content, and alerts fire when a metric crosses a threshold. The practical effect is cutting the ad-hoc query queue that lands on the data team, since non-technical staff can answer their own questions. Written in Clojure, licensed AGPL, and shipped as a single JAR or Docker image with an embedded application database - a working BI instance runs before most tools finish their installer - the open-source edition has no limits on users, dashboards, or connected databases, where commercial BI platforms price per viewer as well as per creator.
Dekart
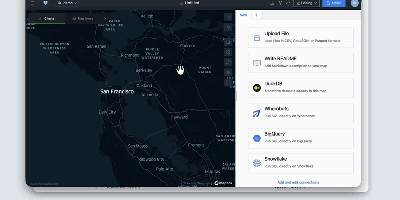
Dekart turns SQL queries against your data warehouse into interactive maps and charts you can share with a link. Connect Postgres, BigQuery, Snowflake, Wherobots, or DuckDB, write a query, and the results render as WebGL map layers that stay responsive even at a million points. Layers stack: put places in one, boundaries in another, add H3 hexagon aggregations where raw points would turn into soup, and tune colors and styles until the pattern you suspected in the table becomes obvious on the map. Interactive charts sit beside the map and move with it, so filtering a distance histogram or a category breakdown updates the geography at the same time. Query parameters let viewers change inputs like radius or date range without touching SQL, which makes one report serve a whole team. Maps share through private links, so a stakeholder opens the live result instead of receiving a stale screenshot in a slide deck. Uploading a CSV, GeoJSON, or Parquet file is enough for a quick one-off, and Markdown reports add explanation next to the data. AI agents can join in through the MCP interface to build and refine maps from natural-language requests. Single sign-on through Google OAuth, Keycloak, Cognito, or IAP keeps access governed, and the whole application runs as one Docker container with built-in storage for zero-configuration starts. Running on a dedicated VPS on RepoCloud with guaranteed CPU, RAM, and SSD, full root SSH access, and a browser serial console. AGPL-3.0 licensed.
ShadowBroker
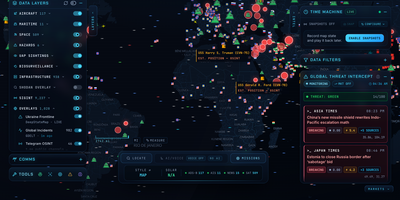
ShadowBroker puts aircraft, ships, satellites, hazards, news, and radio signals from over 60 public feeds on a single dark-themed world map that runs on your own server. More than 40 layers switch on and off independently, with a left sidebar of groups for aircraft, maritime, space, hazards, infrastructure, and overlays, each showing live counts. Click an aircraft to open a detail card with operator, photo, type, and registration, or search a callsign and let the map fly there. A threat panel scores the day from headlines and lists breaking stories with source counts. Flip between dark, satellite, and street map styles, record snapshots with the Time Machine, and drop pins or layers of your own. The AI Intel tool walks you through connecting an agent as a co-analyst: pick a local or remote agent, choose read-only or full access, and copy ready-made environment variables for HMAC signing. Agents can search telemetry and news, run recon lookups, and move the map for you. The first-run briefing also lists free sources that need no keys. Running on a dedicated VPS on RepoCloud with guaranteed CPU, RAM, and SSD, full root SSH access, and a browser serial console. AGPL-3.0 licensed.
Glance
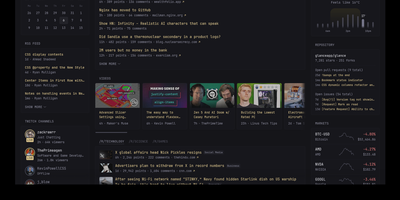
With over 35,000 GitHub stars in just two years, Glance has become the most popular self-hosted dashboard project on GitHub, outpacing established alternatives like Homarr and Homepage. Built as a single Go binary under 20MB with minimal JavaScript and zero external dependencies, Glance delivers a blazing-fast personal information dashboard that consolidates your entire digital morning routine into one beautiful page. Configure everything through clean YAML files that support modular includes and environment variable interpolation, with automatic hot-reload that applies changes without restarting the server. The widget ecosystem covers RSS and Atom feeds, Reddit and Hacker News frontpages, YouTube channel subscriptions, GitHub release timelines, weather forecasts from Open-Meteo, stock market quotes, Docker container status, Twitch live streams, calendar events via iCal, site monitor uptime checks, and custom HTML or iframe embeds. A community widgets repository extends functionality even further with user-contributed integrations. The theming system provides light, dark, and custom color schemes with multiple layout options including slim and wide column configurations. Authentication support added in 2025 secures access with username and password protection. Preconfigured page templates let you get started in seconds with curated layouts for development, homelab monitoring, news reading, and entertainment tracking. Deploy via Docker Compose or as a standalone binary on Linux, macOS, or Windows across AMD64 and ARM64 architectures. Running on a dedicated VPS on RepoCloud with guaranteed CPU, RAM, and SSD, full root SSH access, and a browser serial console. AGPL-3.0 licensed.
Nimbus
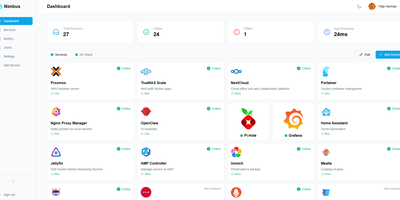
Nimbus is a self-hosted homelab dashboard that turns your scattered pile of services into a polished, organized command center with real-time health monitoring for every endpoint you care about. The dashboard displays live status cards for each registered service, tracking response times down to the millisecond and graphing uptime history so you can spot degradation before it becomes an outage. Health checks run on configurable intervals with smart self-signed certificate handling, meaning your internal services with self-issued TLS do not trigger false alarms. Multi-user support comes standard: local accounts authenticate via JWT, while OAuth2 integration with Google, GitHub, and Discord lets team members sign in with existing credentials. Role-based access control and a built-in admin panel give you granular authority over who sees what. Each user personalizes their view with custom backgrounds, light or dark mode, accent color themes, and drag-and-drop service tile arrangement. Services group into named categories and cards resize to fit your preferred layout, with both grid and list view modes available. Prometheus metrics export feeds your existing Grafana stack, and webhook notifications alert you instantly when a service goes offline. Custom service icons upload directly or auto-fetch from the Dashboard Icons collection. Zero-config Docker deployment gets you running in under 30 seconds with a single docker-compose command. Running on a dedicated VPS on RepoCloud with guaranteed CPU, RAM, and SSD, full root SSH access, and a browser serial console. AGPL-3.0 licensed.
Jellydash
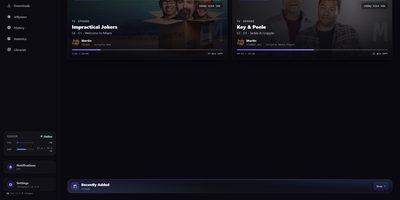
Jellydash answers the questions every Jellyfin admin asks, starting with who is watching right now and whether that stream is transcoding. Live cards show each session's artwork, user, quality, progress, and playback method, including the reason a transcode was needed, and live TV channels appear with real program progress. Behind the scenes, a background poller records every play even when nobody has the dashboard open, building a history you can search, filter by user or library, and export to CSV with poster art intact. Older Jellyfin or Emby Playback Reporting backups import in seconds, so years of viewing are not lost when you switch. Statistics turn that history into watch-time trends, top users, device and client activity, codec breakdowns, and transcode reasons, and clicking a chart opens the exact plays behind it. A monthly recap looks back at a finished month with rankings and daily activity, while trending and all-time most-watched strips show what your household actually loves. Optional pages follow Jellyseerr requests as they arrive and read the status of SABnzbd, qBittorrent, Transmission, Deluge, and NZBGet clients without ever touching their queues. Server activity, maintenance tasks, and system status stay one click away, and selected users can be excluded from monitoring entirely. When someone presses play, a notification can reach your phone through Telegram, Pushover, Discord, ntfy, Gotify, or Web Push. Running on a dedicated VPS on RepoCloud with guaranteed CPU, RAM, and SSD, full root SSH access, and a browser serial console. MIT licensed.
Headlamp
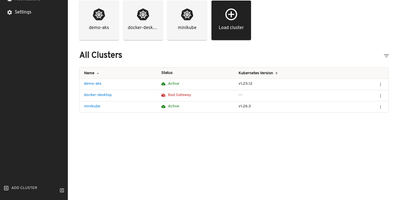
The Kubernetes project's own answer to cluster management UIs: maintained under SIG UI governance, Headlamp's roadmap tracks Kubernetes releases and its design philosophy reflects community needs rather than a vendor's product strategy. The React interface provides full read-write capabilities adapted to each user's RBAC permissions — delete, scale, edit, and restart buttons appear only when the authenticated user holds the corresponding cluster role, preventing accidental unauthorized actions. Multi-cluster support surfaces workloads across development, staging, and production from a single view without context switching. The plugin architecture drives extensibility through a curated catalog: an AI Assistant plugin answers natural-language cluster queries and performs operations via configurable LLM keys, Flux handles GitOps, Karpenter manages nodes. Integrated terminals provide browser-based exec access to running pods, live log streaming follows container output with filtering, and the YAML editor displays inline Kubernetes API documentation alongside resource definitions. Deployment creation forms let you configure containers, environment variables, volumes, and replicas without writing manifests. Side-by-side cluster comparison views surface differences in workload distribution. Works with any distribution: EKS, GKE, AKS, Minikube, Docker Desktop. Helm chart installation via the Headlamp repository with images on GitHub Container Registry. Running on a dedicated VPS on RepoCloud with guaranteed CPU, RAM, and SSD, full root SSH access, and a browser serial console. Apache-2.0 licensed.
ghstats
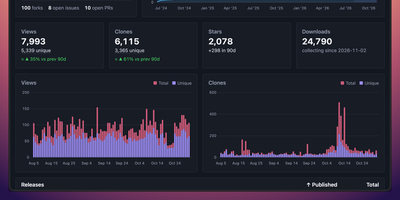
GitHub forgets your traffic after fourteen days; ghstats remembers it for years. This self-hosted dashboard polls the GitHub API every hour and keeps views, clones, stars, forks, issues, and pull requests for every repository in its own database, long after the built-in traffic tab has rolled over. Open a repository to see its charts for stars, clones, and views next to top referrers and popular paths, filter the list by owner, name, forks, or archived status, and include private repositories when your token allows it. Public stats pages and portfolios reuse the same numbers through a JSON API, embeddable SVG badges for views, clones, and star velocity, and cards ranking your top repositories or showing star history across projects. Release download counts accumulate as daily snapshots too, so a launch spike stays visible months later. The whole service is one small Docker image on port 8080 with a single file for storage, easy to back up and easy to move. Running on a dedicated VPS on RepoCloud with guaranteed CPU, RAM, and SSD, full root SSH access, and a browser serial console. MIT licensed.
ADHDev
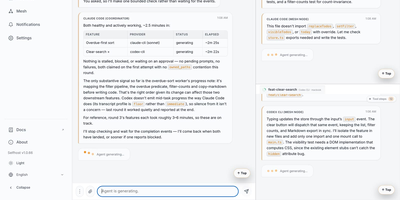
Your laptop, a desktop, and a build box each have a coding agent installed, and until now nothing has coordinated them. ADHDev is a self-hosted control plane that puts Claude Code, Codex, Kimi, Cursor CLI, Antigravity CLI, Grok CLI, and OpenCode behind one shared task queue and one web and mobile dashboard. Machines pair directly with an address and a one-time code on your own network, and a mesh binds to a single repository. Idle nodes claim tasks themselves. Dependencies order the queue, retries absorb failures, and missions group the work that belongs together. Every task gets an isolated git worktree the moment it starts. Agents build in parallel without touching each other's files, and the coordinator's prompt is rendered from live mesh state at launch, with events pushed in as they happen. Difficulty tags route easy work to cheap models and hard work to strong ones. The dashboard also reads how much of each subscription window remains, skips plans that are nearly empty, and shows the routing forecast before anything runs. Finished work enters the Refinery. Your repository's gates decide, the branch is rebased onto main, and the merge happens only when main has not moved, followed by automatic worktree cleanup. Running on a dedicated VPS on RepoCloud with guaranteed CPU, RAM, and SSD, full root SSH access, and a browser serial console. AGPL-3.0 licensed.
Garage UI
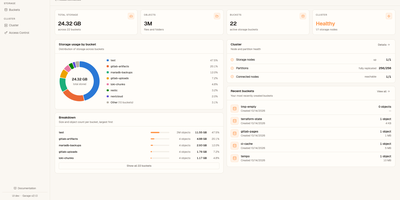
Garage UI is the web dashboard that Garage object storage never shipped, turning an admin API that speaks JSON over HTTP into screens your whole team can use. Create and configure buckets, browse objects with drag-and-drop uploads, and preview images, video, PDFs, and text inline instead of downloading files just to check what they are. A recursive search finds objects across a whole bucket, and bucket settings carry size and object-count quotas so one tenant cannot quietly eat the cluster. Access keys are created in the UI and assigned per-bucket permissions, replacing error-prone command-line key surgery. The cluster overview watches node status, layout configuration, and storage usage, so a degrading node shows up in the dashboard before it shows up as an outage. Sign-in flexes to your setup: no auth on a trusted network, basic admin credentials, the Garage admin token, or OIDC single sign-on through providers like Keycloak and Authentik. With OIDC teams enabled, access control maps token claims to bucket prefixes with named permission presets, and unmatched users are denied by default rather than promoted. Zero-config startup reads your existing garage.toml, so the first login takes minutes. Running on a dedicated VPS on RepoCloud with guaranteed CPU, RAM, and SSD, full root SSH access, and a browser serial console. MIT licensed.
SITREP
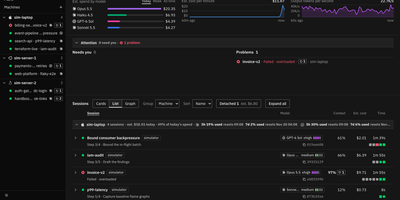
Watch every coding agent you run, on every machine, from one live browser dashboard. Sessions appear as cards, a sortable list, or a graph, grouped by machine or project, each showing its plan and current step, subagents, model and effort, context fill, git branch, and cost. Anything waiting on you, like a permission, a question, or a plan to approve, rises to a Needs you panel with the longest wait first, and you can answer it from the page or in the terminal. A Problems panel flags sessions that are stuck, failed, or colliding on the same file. The Plans board sorts every plan step into pending, in progress, review, blocked, and done. A session page adds a timeline of loops and subagents, changed files, and token and context charts. Spend is broken down by model and machine, and plan windows show how close each provider is to its limit. History keeps ended sessions by day, a wall view suits a spare screen, and browser alerts fire when a session needs you. Running on a dedicated VPS on RepoCloud with guaranteed CPU, RAM, and SSD, full root SSH access, and a browser serial console. MIT licensed.