Metabase
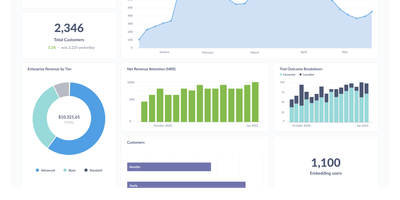
The most widely deployed open-source BI tool, Metabase is a visualization and query layer that sits on top of your existing databases without ingesting or copying data. Non-technical users ask questions through a visual query builder with drill-through menus that answer follow-ups like "broken down by month" without writing a new query, while analysts use the native SQL editor with variables and templates for complex work. Questions assemble into interactive dashboards with filters, auto-refresh, fullscreen mode, and custom click behavior, and dashboard subscriptions email or Slack scheduled reports to stakeholders. It connects to 20+ data sources including PostgreSQL, MySQL, MongoDB, SQL Server, BigQuery, Snowflake, Redshift, and ClickHouse - always querying in place, so there is no second data store to secure, sync, or pay for, and results are always current. Models and metrics let a data team define official, reusable starting points so self-service stays consistent, collections with permissions organize content, and alerts fire when a metric crosses a threshold. The practical effect is cutting the ad-hoc query queue that lands on the data team, since non-technical staff can answer their own questions. Written in Clojure, licensed AGPL, and shipped as a single JAR or Docker image with an embedded application database - a working BI instance runs before most tools finish their installer - the open-source edition has no limits on users, dashboards, or connected databases, where commercial BI platforms price per viewer as well as per creator.
DataHub
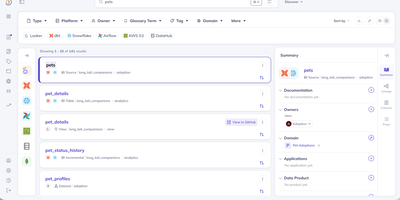
DataHub maps your entire data ecosystem into a searchable, governed catalog where every table, pipeline, dashboard, and metric is discoverable and traceable from source to consumer. Originally built at LinkedIn to manage metadata at hyperscale and proven to handle 10 million+ assets and billions of relationships in production, the platform is now trusted by 3,000+ organizations including Netflix, Visa, Slack, and Pinterest. The Spring Java backend (GMS) exposes both GraphQL and OpenAPI REST endpoints, while the React frontend delivers an intuitive interface for searching, browsing, and governing data assets. The Python-based ingestion framework provides 80+ production-grade connectors extracting deep metadata from Snowflake, BigQuery, Redshift, Databricks, dbt, Airflow, Spark, Kafka, Looker, Tableau, Power BI, Superset, PostgreSQL, MySQL, Hive, Glue, S3, Iceberg, and Unity Catalog through pull-based scheduled crawls and push-based emission via Python and Java SDKs. Automatic table-level and column-level lineage detection uses SQL parsing with 97-99% accuracy, tracing data flows from ingestion pipelines through warehouses to BI dashboards. Real-time metadata streaming via Kafka keeps the catalog continuously synchronized as schemas evolve and pipelines execute. The governance layer provides business glossary management, tag propagation along lineage graphs, domain-based organization, and fine-grained access control policies. DataHub Actions triggers automated responses to metadata changes, enabling notifications, quality checks, and downstream workflows. Elasticsearch powers full-text search with faceted filtering across entities. Running on a dedicated VPS on RepoCloud with guaranteed CPU, RAM, and SSD, full root SSH access, and a browser serial console. Apache 2.0 licensed.

Chatwoot
Unleash the power of Chatwoot, the open-source superhero in the world of customer experience! This platform is perfect for businesses craving to connect with their customers across a multitude of channels without breaking the bank. Wave goodbye to the high-and-mighty likes of Intercom, Zendesk, and Salesforce Service Cloud, and say hello to a wallet-friendly powerhouse. Chatwoot turns your agents into customer service ninjas, armed with the latest in workload management, performance tracking reports that refresh themselves (because who has time for that?), and automations that work smarter, not harder. Zap through conversations with lightning-fast responses and manage your social media and email interactions in a single bound. Plus, with Chatwoot, you get to be the Sherlock of customer satisfaction, deducing your CSAT scores on autopilot. All this hosted on RepoCloud, where the cost is as tiny as the effort you'll need to switch over. Get ready to engage, enlighten, and entertain your customers with Chatwoot!
InfluxDB
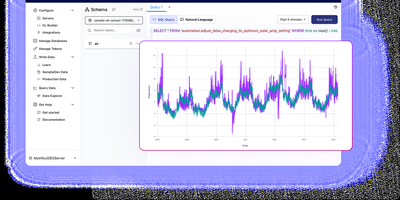
With over 31,600 GitHub stars and thousands of production deployments, InfluxDB 3 Core is the open-source time series database rebuilt in Rust on the FDAP stack — Apache Flight for high-throughput data transfer, DataFusion for vectorized SQL query execution, Arrow for columnar in-memory representation, and Parquet for compressed columnar storage. The engine delivers sub-10ms query response times on recent data and handles millions of writes per second through line protocol ingestion over HTTP, with unlimited tag cardinality eliminating the high-cardinality limitations that plagued earlier InfluxDB versions. The diskless architecture persists data as compressed Parquet files to S3-compatible object storage, Azure Blob, Google Cloud Storage, or local disk with configurable partitioning strategies, while the write-ahead log and in-memory buffer serve real-time queries against recent data before compaction. Native SQL support through DataFusion includes window functions, CTEs, subqueries, and joins, while InfluxQL maintains backward compatibility with existing InfluxDB 1.x and 2.x applications through the same query API. The embedded Python VM enables processing engine plugins and triggers that execute custom logic on write events, perform cross-database queries, and transform data in real time without external tooling. Flight SQL clients provide high-performance query access from Python, Go, Java, and Rust, and the HTTP API supports writes in line protocol format compatible with Telegraf's 300+ input plugins. Running on a dedicated VPS on RepoCloud with guaranteed CPU, RAM, and SSD, full root SSH access, and a browser serial console. MIT/Apache 2.0 dual-licensed.
Tick Stock Panel
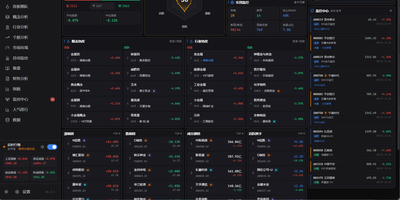
Screen equities against dozens of technical indicators, backtest algorithmic trading strategies, and spot intraday market anomalies using Tick Stock Panel, a self-hosted quantitative analysis workbench. Traders can filter entire exchanges across technical indicators including moving averages, relative strength index, and Bollinger bands with near-instantaneous execution. The platform provides a full backtesting environment where users test customized entry and exit rules, account for simulated slippage and commission fees, and review streamed performance metrics. Dedicated monitoring modules track intraday volume spikes, price breakouts, and multi-day limit streaks with automated alert dispatching to messaging channels and voice announcements. Users can explore individual stock profiles featuring multi-dimensional technical breakdowns, financial balance sheets, and automated event post-mortems generated via integrated language models. Visual factor mining tools allow analysts to discover uncorrelated signals and assemble composite portfolio screens without external database overhead. An interactive dashboard aggregates sector rotations, hot concept heatmaps, and customizable watchlists into modular operational views. Running on a dedicated VPS on RepoCloud with guaranteed CPU, RAM, and SSD, full root SSH access, and a browser serial console. MIT licensed.
Dub
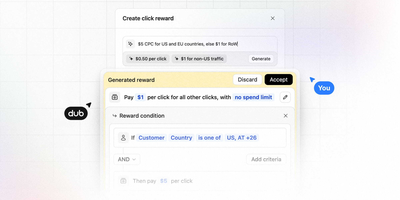
With 24,000 GitHub stars and infrastructure processing over 100 million clicks and 2 million links monthly for marketing teams at Twilio, Buffer, Framer, Perplexity, and Vercel, Dub is the most widely adopted open-source link attribution platform — unifying branded short links, real-time conversion analytics, and affiliate programs in a single self-hostable tool. Create short links on custom domains with built-in QR code generation, device and geographic targeting rules, A/B testing for destination URLs, deferred deep linking for mobile apps, and custom social media preview cards. The attribution engine tracks the complete customer journey from first click through lead capture to final sale, calculating lifetime value, retention rates, and multi-touch attribution across campaigns. Real-time analytics visualize clicks, leads, and revenue with filtering by geography, device, browser, referrer, operating system, and UTM parameters — plus an "Ask AI" feature that generates personalized reports from natural language queries. The partner program module enables embedded referral and affiliate programs with custom reward structures, automated payouts, and partner dashboards for product-led growth. Programmatic link creation via native SDKs for TypeScript, Python, Go, PHP, and Ruby supports enterprise-scale campaigns with real-time webhook notifications on link events. Migration assistants import existing links from Bitly, Rebrandly, and Short.io with redirects preserved. Running on a dedicated VPS on RepoCloud with guaranteed CPU, RAM, and SSD, full root SSH access, and a browser serial console. AGPLv3 licensed.
Meteroid
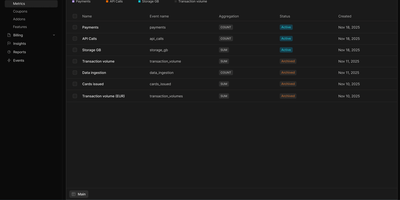
Meteroid delivers the billing infrastructure that SaaS companies need when Stripe Billing gets too rigid and building in-house gets too expensive. The Rust backend ingests usage events via REST API or Kafka with deduplication by event ID and customer ID, storing time-series data in ClickHouse for sub-second aggregation queries across billions of events. Billable metrics transform raw events — API calls, compute time, tokens, storage, transactions — into accurate charges using configurable aggregation functions, dimensions, and filters without pre-aggregation. The plan builder supports any pricing structure: flat rate, per-unit, tiered graduated, tiered volume, package, and hybrid combinations with multiple price components per plan. Versioned plans enable pricing changes without affecting existing subscribers through grandfathering, while experiments let you A/B test pricing with controlled rollouts. Subscription management handles the full lifecycle — creation, upgrades, downgrades, mid-cycle proration, scheduled changes, and cancellation with configurable grace periods. The TypeScript frontend provides a complete web dashboard for managing customers, plans, subscriptions, invoices, and revenue analytics with MRR tracking, churn analysis, and cohort insights. Automated invoice generation handles complex scenarios including usage-based line items, credits, discounts, and tax calculations with PDF rendering. Stripe Connect integration enables payment collection directly through the platform. Running on a dedicated VPS on RepoCloud with guaranteed CPU, RAM, and SSD, full root SSH access, and a browser serial console. AGPL-3.0 licensed.
CPA Manager Plus
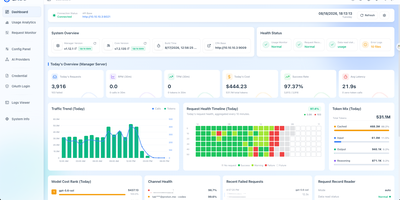
CPA Manager Plus is a self-hosted observability dashboard and management panel that tracks every AI request flowing through your CLI Proxy API gateway, breaking down failures, costs, and account health across providers like OpenAI, Anthropic, xAI, and Codex in one interface. When a request fails, drill into the persistent history to see status codes, affected models, latency, and redacted failure evidence without exposing raw response bodies. The cost analytics engine breaks down token consumption and estimated spend by model, provider, account, API key, project, channel, and time range while tracking input, output, reasoning, cache, and service-tier pricing semantics separately. Model prices sync automatically from models.dev with LiteLLM and OpenRouter fallbacks, and you can add local overrides for aliases or internal models. For teams running Codex or xAI accounts, the health inspector reads quota windows, reset evidence, credential state, and workspace status on a configurable schedule, routing credential failures into an action queue for review rather than letting them silently degrade throughput. Deploy the Lightweight Panel to replace your existing CPA management UI without adding another service, or run Full Mode as a single Docker container that adds the Manager Server with persistent SQLite storage for request history, historical analytics, and automated account inspections. Export or import request history as JSONL for external analysis, and back up the SQLite files alongside your encrypted management keys. Running on a dedicated VPS on RepoCloud with guaranteed CPU, RAM, and SSD, full root SSH access, and a browser serial console. MIT licensed.
HyperDX
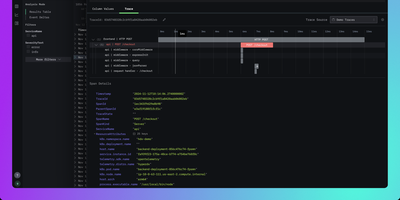
HyperDX correlates logs, metrics, traces, session replays, and errors in a single interface so engineers can resolve production incidents in minutes instead of hours. Nearly 10,000 GitHub stars reflect its role as the integrated UI layer for the ClickStack blueprint endorsed by ClickHouse. The platform connects to any ClickHouse cluster as its storage backend, working with existing table structures without requiring data migration or proprietary ingestion formats. An intuitive Lucene-like search syntax supports full-text queries and property filtering like level:err or service.name:api without needing SQL, while native JSON string querying and event delta analysis surface anomalies in high-cardinality datasets. One-click cross-signal correlation lets you jump from a log line to its distributed trace, from a slow span to associated logs, or from a frontend session replay to the backend errors it triggered. The OpenTelemetry Collector accepts telemetry via OTLP on gRPC port 4317 and HTTP port 4318, supporting automatic instrumentation for Node.js, Python, Java, Go, Ruby, and browser applications. APM tracks HTTP request latency, database query duration, and external service calls with trace waterfall visualizations. Configurable alerts trigger via webhook, Slack, PagerDuty, or email when thresholds are breached. Deploys via Docker Compose with ClickHouse, MongoDB, Redis, and the OpenTelemetry Collector. Running on a dedicated VPS on RepoCloud with guaranteed CPU, RAM, and SSD, full root SSH access, and a browser serial console. MIT licensed.
PostHog
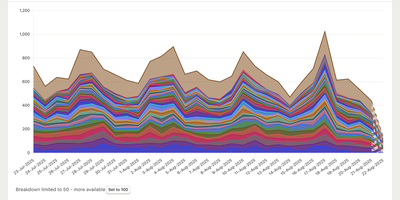
With over 37,000 GitHub stars and used by teams at Y Combinator, Airbus, and Phantom, PostHog replaces an entire stack of paid analytics tools — Mixpanel, Amplitude, Heap, LaunchDarkly, Hotjar, and Google Analytics — with a single open-source platform where every tool shares a common event layer and user context. Product analytics captures events automatically or via manual instrumentation with HogQL (SQL) access for custom queries, while web analytics provides GA-like dashboards for traffic, conversions, and Core Web Vitals. Session replay records user interactions with DOM snapshots and network waterfall analysis, linking directly to errors and feature flag exposures. Feature flags safely roll out changes to specific cohorts with multivariate support and instant rollback, while experiments run A/B tests with automatic Bayesian significance calculations and revenue attribution. Error tracking captures stack traces linked to session replays and user properties for immediate reproduction context. AI observability monitors LLM generations, traces, token usage, latency, and costs across model versions. The managed data warehouse syncs 120+ external sources including Stripe, Postgres, Salesforce, and HubSpot alongside product events, queryable through a unified SQL editor. An MCP server enables AI agents in Cursor, Claude Code, or VS Code to query analytics and execute SQL directly. Running on a dedicated VPS on RepoCloud with guaranteed CPU, RAM, and SSD, full root SSH access, and a browser serial console. MIT licensed.
RisingWave
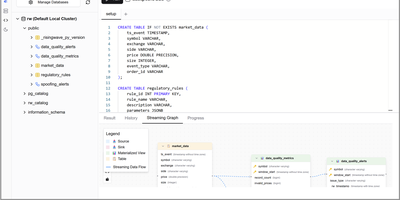
With over 9,100 GitHub stars and production deployments powering real-time analytics at companies like SHOPLINE where it reduced API latency by 76.7%, RisingWave is the PostgreSQL-compatible streaming database that collapses the traditional Debezium-plus-Kafka-plus-Flink-plus-serving-database stack into a single Rust-powered system. The platform continuously ingests data from PostgreSQL and MySQL via native CDC connectors that eliminate Debezium middleware, consumes Kafka, Redpanda, Pulsar, and Kinesis topics, accepts webhook events from SaaS applications, and batch-loads historical data from S3 and data warehouses. Standard SQL defines sources, materialized views, and sinks — no new DSL, no Java, and no custom API — while the PostgreSQL wire protocol means psql, DBeaver, pgAdmin, Grafana, Metabase, Superset, Tableau, and every PostgreSQL client library works without modification. Materialized views are incrementally maintained as events arrive, delivering point lookups in single-digit milliseconds without recomputing aggregates from scratch. For long-term retention, RisingWave writes to Apache Iceberg tables with a hosted REST catalog and automated table maintenance including compaction, small-file optimization, and snapshot cleanup, with data queryable by Spark, Trino, DuckDB, and DataFusion. The disaggregated compute-storage architecture uses S3-based state management for elastic scaling, instant failure recovery measured in seconds rather than the minutes-to-hours typical of RocksDB-based systems, and cost-efficient storage tiering. An MCP server enables AI agents to query and operate RisingWave directly. Running on a dedicated VPS on RepoCloud with guaranteed CPU, RAM, and SSD, full root SSH access, and a browser serial console. Apache 2.0 licensed.
QuestDB
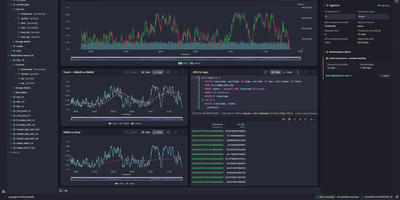
Powering trading floors at firms processing millions of market data events per second and trusted by organizations including Airbus, Yahoo, and Copenhagen Atomics, QuestDB has earned over 17,000 GitHub stars as the time-series database that refuses to make you choose between ingestion speed and query latency. The column-oriented, time-partitioned storage engine processes millions of rows per second on ingest through write-ahead logging with instant durability, while SIMD-accelerated parallel execution returns analytical queries over billions of rows in milliseconds. Time-series SQL extensions add ASOF JOIN for point-in-time lookups across tables with misaligned timestamps, SAMPLE BY for downsampling at arbitrary time intervals, LATEST ON for last-value queries, and WINDOW JOIN for sliding window aggregations — all through standard SQL syntax accessible via the PostgreSQL wire protocol, REST API, or the QuestDB Wire Protocol (QWP) that streams Apache Arrow at 220 million rows per second. Multi-tier storage automatically moves data from the WAL through native columnar format to Parquet files on S3-compatible object storage, keeping hot data fast and cold data portable without manual tiering. The built-in web console provides an interactive SQL editor with syntax highlighting, autocomplete, and charting for quick data exploration. Views, materialized views, and n-dimensional arrays support real-time analytics, while native Parquet export enables direct integration with Python, DuckDB, and AI/ML frameworks. Running on a dedicated VPS on RepoCloud with guaranteed CPU, RAM, and SSD, full root SSH access, and a browser serial console. Apache 2.0 licensed.

Gods Eye View
God's Eye View turns your browser into a real-time spatial intelligence command center, rendering thousands of live aircraft, ships, satellites, earthquakes, traffic flows, and public cameras on a photorealistic 3D Earth powered by CesiumJS and Google Photorealistic 3D Tiles. Click any aircraft to see its transponder telemetry from OpenSky and adsb.lol, including route history, altitude, speed, and callsign; track live vessel positions worldwide through AIS beacon data from AISStream; or follow roughly 840 satellites color-coded by class using orbital elements from CelesTrak. A hands-free voice agent powered by the OpenAI Realtime API lets you ask the planet questions in natural language, and the globe annotates your answer directly in 3D space. Toggle FLIR mode for a thermal camera aesthetic, layer in NASA FIRMS wildfire data, switch between Google 3D, Bing aerial, and OpenStreetMap base layers, or tune into a geolocated world radio dial. Public CCTV cameras are projected into 3D city geometry with viewshed cones and direct-manipulation calibration. The cockpit mode provides a pilot-style briefing surface with mission-specific overlays. Entity inspection panels show detailed metadata for every tracked object, and shareable links let you send any scene configuration to a colleague. Ten of the thirteen live data layers work with zero API keys, while the required Google Maps key offers 1,000 free 3D tile sessions per month. Running on a dedicated VPS on RepoCloud with guaranteed CPU, RAM, and SSD, full root SSH access, and a browser serial console. MIT licensed.

Social Analyzer
Social Analyzer scans over 1,000 social media platforms in parallel to discover and correlate user profiles from a single username query, making it the most comprehensive OSINT reconnaissance tool of its kind. Three detection modes cover different accuracy and speed tradeoffs: fast HTTP library checks for rapid sweeps, Selenium WebDriver validation for JavaScript-heavy sites, and a special mode for stubborn edge cases. String analysis generates username permutations and combinations to catch related accounts with slight naming variations. Three interfaces serve different workflows: a Node.js web application on port 9005 with a browser-based GUI, a CLI for scripted batch operations, and Python plus Node.js APIs for embedding into automated investigation pipelines. The QeeqBox OSINT library extracts profile metadata, screenshots, titles, descriptions, and activity patterns, all visualized through Ixora-based force-directed graphs that map relationships between discovered accounts. Tesseract OCR analyzes profile images for additional detection vectors. Search results narrow by country codes, website categories, Alexa ranking thresholds, and confidence levels. Optional Google API and DuckDuckGo API integration adds search engine correlation alongside direct platform queries. Docker deployment bundles Node.js, Firefox ESR, Tesseract, and all dependencies into one container. Trusted by law enforcement and security researchers for digital forensics and identity verification. 23,000+ GitHub stars. AGPL-3.0 licensed.
SpiderFoot
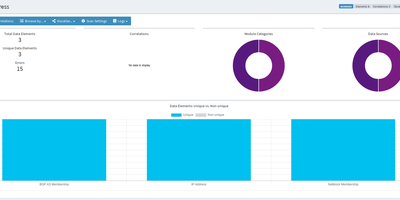
SpiderFoot is an open-source OSINT automation platform, replacing hours of manual reconnaissance with automated intelligence gathering across more than 200 data collection modules. The platform accepts ten distinct target types including IP addresses, domains, hostnames, network subnets, ASNs, email addresses, phone numbers, usernames, person names, and Bitcoin addresses, then feeds them through a publisher-subscriber event bus where each module's findings trigger downstream analysis automatically. SpiderFoot queries Shodan, VirusTotal, HaveIBeenPwned, AlienVault OTX, Censys, crt.sh, WHOIS databases, social media platforms, breach databases, and dozens more sources, with most modules requiring no API keys and many offering free tiers for those that do. The YAML-configurable correlation engine applies 37 pre-defined rules to identify relationships between discovered data points, flagging patterns like shared infrastructure, credential exposure, and domain reputation anomalies. Results export in CSV, JSON, and GEXF graph formats for integration with external analysis tools. TOR integration enables dark web searching, and SpiderFoot can invoke external tools including DNSTwist, Whatweb, Nmap, and CMSeeK for deeper technical assessment. The embedded web server delivers an intuitive dashboard for scan management, data visualization, and result exploration alongside a full command-line interface for scripted automation. Running on a dedicated VPS on RepoCloud with guaranteed CPU, RAM, and SSD, full root SSH access, and a browser serial console. MIT licensed.
OpenBB
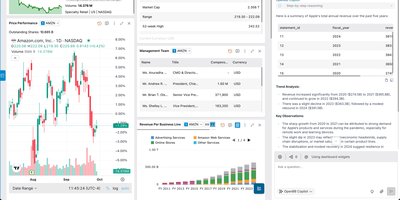
OpenBB stands as the world's most popular open-source finance repository — an Open Data Platform that evolved from a pandemic-era Reddit post into a full-blown infrastructure layer challenging Bloomberg's $25 billion empire. The "connect once, consume everywhere" architecture consolidates proprietary, licensed, and public financial data sources into multiple consumption surfaces simultaneously: Python environments for quants building models, OpenBB Workspace and Excel for analysts creating dashboards, MCP servers for AI agents performing automated research, and REST APIs for custom applications. The modular extension system supports dozens of data providers including Yahoo Finance, Alpha Vantage, FRED, Intrinio, Polygon, and Tradier with standardized schemas that normalize responses across vendors. The CLI offers a terminal-style interactive interface with autocomplete, parameter hints, and chart rendering for rapid data exploration. Provider routing handles authentication, rate limiting, and response normalization transparently so switching between free and premium data sources requires changing a single parameter. The platform covers equities, options, fixed income, crypto, forex, ETFs, mutual funds, economics, technical analysis, quantitative analysis, and alternative data across global markets. AI agent integration exposes every data endpoint as tool-callable functions with schema discovery enabling LLMs to query financial data programmatically. Install via pip with Python 3.9+ and deploy the REST API server for team access. Running on a dedicated VPS on RepoCloud with guaranteed CPU, RAM, and SSD, full root SSH access, and a browser serial console. AGPL-3.0 licensed.
CubeJS
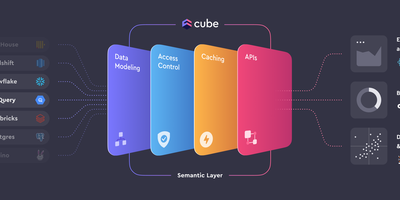
Between your databases and everything that consumes data - BI tools, embedded analytics, AI agents - sits Cube (formerly Cube.js), an open-source semantic layer. Metrics, dimensions, joins, and access rules are defined once as code in YAML, JavaScript, or Python, forming a governed data model that every downstream consumer shares, so "revenue" means the same thing in every dashboard. Caching is two-level: an in-memory cache absorbs bursts of identical queries, and declared pre-aggregations - rollup tables built in the warehouse or in Cube Store, Cube's distributed columnar engine, and refreshed in the background - deliver sub-second latency while cutting warehouse compute costs. The query planner routes each request to cache, rollup, or source automatically. Consumers connect through a Postgres-compatible SQL API (any tool that speaks Postgres works), plus REST, GraphQL, and a Meta API for model introspection. Row-level security and multi-tenancy are enforced in the layer itself, upstream of every client. Sources include Snowflake, BigQuery, Databricks, Postgres, MySQL, Presto, and Athena. Headless by design - bring your own UI.
Umami
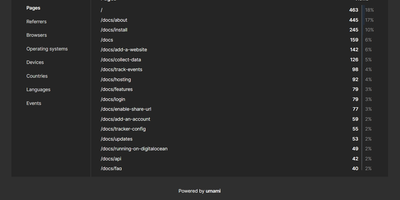
No cookies, no fingerprinting, no cross-site tracking, no personal data collection - Umami's privacy contract is the foundation of the open-source web analytics platform. IP addresses are hashed rather than stored, which makes it GDPR, CCPA, and PECR compliant by default - the consent banner can come off the site entirely. The tracking script is under 2 KB, roughly 20x smaller than Google Analytics, so measurement stops being a page-weight tax. The dashboard covers the core metrics - pageviews, visitors, bounce rate, visit duration, referrers, browsers, devices, and countries - with any date range and filtering by country or device. Beyond pageviews, custom events track clicks, form submissions, and signups via a data attribute or one JavaScript call, and advanced reports add funnels, user journeys, retention and cohort analysis, goals, and automatic UTM campaign tracking. Anonymous session views show individual visitor activity without identifying anyone. Teams share websites with role-based access, one instance manages unlimited sites, and a full REST API exposes every metric programmatically. MIT-licensed and self-hosted on PostgreSQL or MySQL via Docker, your analytics data never leaves your infrastructure.