xyOps
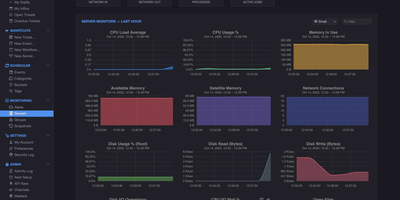
With 4,500+ GitHub stars and version 1.0.92 released August 2026, xyOps delivers a complete operations platform that unifies workflow automation, job scheduling, server monitoring, alerting, and incident response in one self-hosted system. The platform uses a distributed architecture where a central conductor coordinates lightweight xySat satellite agents running on Linux, macOS, or Windows worker nodes via persistent WebSocket connections. The visual workflow builder lets you chain events, triggers, actions, and monitors into multi-step pipelines with conditional logic, fan-out/fan-in parallelism, multiplex controllers for fleet-wide execution, and configurable resource limits. QuickMon provides per-second CPU, memory, disk, and network visibility streamed live to the web UI, while user-defined monitor plugins sample metrics every minute with time-series storage at hourly, daily, monthly, and yearly resolutions. Alert triggers evaluate expressions against live data and fire notifications via email, webhook, or custom actions, with full server snapshots attached showing every running process, network connection, and resource utilization at the moment of detection. Failed jobs and alerts automatically create tickets with linked logs, metrics history, and context for end-to-end incident tracking. The plugin marketplace supports extensions written in any language, and the Docker plugin enables container-based job execution. Deploy via Docker with persistent volumes on port 5522 for the web UI and 5523 for API access, running on a dedicated VPS on RepoCloud with guaranteed CPU, RAM, and SSD, full root SSH access, and a browser serial console. BSD-3-Clause licensed.
UptimeKuma
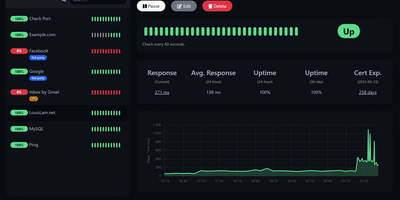
Sixty-thousand-plus GitHub stars make Uptime Kuma the most popular self-hosted monitoring tool - MIT-licensed, Node.js, and the standard replacement for UptimeRobot, Pingdom, and Freshping. It watches a dozen monitor types: HTTP(S) endpoints with keyword and JSON-query content validation, TCP ports, ICMP ping, DNS records, WebSockets, Docker containers via the socket, Steam game servers, MQTT brokers, gRPC services, and push-based heartbeats for cron jobs and internal workers. Checks run at intervals as tight as 20 seconds - versus UptimeRobot's 5-minute free tier - with unlimited monitors and unlimited data retention. When something fails, alerts fan out through 90+ notification channels: Slack, Discord, Telegram, email with LiquidJS templating, PagerDuty, OpsGenie, ntfy, Gotify, Matrix, and dozens more via native providers plus the Apprise library. Unlimited public or password-protected status pages - mappable to specific domains and organized into monitor groups - communicate health to customers, with maintenance windows that suppress alerts during planned work. The reactive dashboard graphs response times, tracks SSL certificate expiry with advance warnings, supports proxies and 2FA, and ships in dozens of languages. One Docker container with a SQLite volume covers an entire infrastructure.
Healthchecks
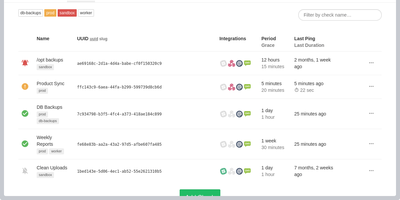
With 10,100+ GitHub stars and 75 releases over a decade of continuous development, Healthchecks is the open-source cron job monitoring service that catches failures your other monitoring tools miss — the jobs that silently stop running, the backups that never completed, the nightly reports that disappeared without error. The dead man's switch architecture requires zero agent installation: your cron jobs, scripts, and services ping a unique URL via HTTP request or email, and Healthchecks alerts you only when a ping does not arrive within the configured Period and Grace Time window. Each check supports cron expression scheduling, optional start, success, and failure signals for measuring execution time, and HTTP body keyword filtering for intelligent alert routing. Twenty-five notification integrations cover every channel teams actually use: Slack, Discord, Microsoft Teams, PagerDuty, Opsgenie, Splunk On-Call, Telegram, Signal, WhatsApp, SMS, email, webhooks, GitHub Issues, Pushover, ntfy, Gotify, Matrix, Mattermost, Zulip, Pushbullet, PagerTree, Spike.sh, and Trello. The web dashboard provides a visual grid showing real-time status with color-coded badges and per-check integration toggles. Monthly, weekly, and daily email reports summarize uptime trends with checks sorted by downtime duration. Team management supports projects with member roles and read-only access. Prometheus metrics expose check health and grace state for Grafana dashboards. WebAuthn and TOTP two-factor authentication secure accounts. Deploy via Docker images available for amd64, arm/v7, and arm64 architectures. Running on a dedicated VPS on RepoCloud with guaranteed CPU, RAM, and SSD, full root SSH access, and a browser serial console. BSD 3-Clause licensed.

Grafana
The de facto dashboard of observability: Grafana is the open-source frontend that turns the data stores you already run into interactive graphs. It does not store metrics itself; it connects to the data stores you already run and turns their contents into interactive dashboards. Supported sources number over 150 via plugins: Prometheus, Loki, Tempo, InfluxDB, Elasticsearch, MySQL, PostgreSQL, Microsoft SQL Server, AWS CloudWatch, Azure Monitor, Google Cloud Monitoring, and many more. Dashboards are built from a large library of panel types (time series, heatmaps, tables, gauges, logs) with template variables for reusable, parameterized views. Unified alerting evaluates rules against any connected data source, not just Prometheus, and routes notifications to Slack, PagerDuty, email, and other channels with grouping and silencing - unlike Prometheus Alertmanager, a single rule can combine a Loki log pattern, a PostgreSQL query result, and a CloudWatch metric. Dashboards serialize to JSON and data sources configure via provisioning files, so the entire observability setup can live in Git and deploy repeatably across environments. Explore mode adds ad-hoc querying outside dashboards, with split view for correlating a metric spike against the matching log lines, and access control spans organizations, teams, folder permissions, and OAuth, LDAP, and SAML integration. Written in Go and TypeScript, AGPL-licensed. Self-hosting gives you unlimited users, dashboards, and queries at flat hosting cost, without Grafana Cloud's usage-based pricing.
Gatus
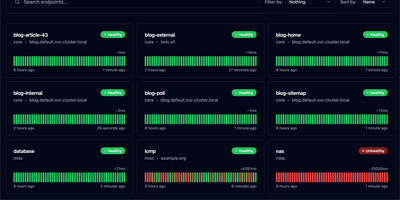
With 11,400+ GitHub stars and active development since 2019, Gatus is the developer-oriented status page and health monitoring tool that ships as a single statically-linked Go binary in a scratch Docker image under 20 MB — deploying in seconds while monitoring your entire infrastructure across 12 protocols from a single YAML configuration file. Define health checks for HTTP, ICMP, TCP, DNS, gRPC, WebSocket, SSH, UDP, SCTP, STARTTLS, and TLS endpoints with conditions that go far beyond simple ping: evaluate response status codes, body content with JSONPath expressions, response time thresholds, certificate expiration days, DNS record values, and IP address ranges. Each endpoint supports independent alerting through Slack, Microsoft Teams, PagerDuty, Discord, Telegram, Twilio, Mattermost, Google Chat, email, Gotify, Pushover, and custom webhook providers with configurable failure thresholds and descriptions. The built-in status page displays uptime badges, response time graphs, and incident timelines with maintenance window support for planned downtime communication. External endpoints accept push-based health reports from services behind firewalls. Prometheus metrics export via the /metrics endpoint enables integration with existing observability stacks. OIDC and Basic Authentication protect the dashboard. PostgreSQL persistence stores historical uptime data. The official Helm chart supports Kubernetes deployment with liveness probes and PVC storage, while a community sidecar auto-generates endpoint configurations from Kubernetes Ingress and HTTPRoute resources. Running on a dedicated VPS on RepoCloud with guaranteed CPU, RAM, and SSD, full root SSH access, and a browser serial console. Apache 2.0 licensed.
Zabbix
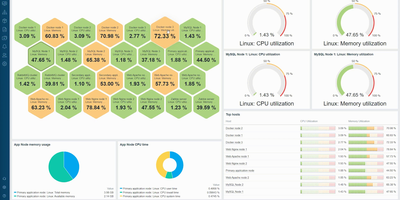
Monitoring everything from network switches to Kubernetes clusters since 2001 with over 6,200 GitHub stars and deployments exceeding 100,000 devices per installation, Zabbix has established itself as one of the most mature and feature-rich open-source monitoring platforms available, trusted by organizations including Dell, Salesforce, ICANN, and T-Mobile. The platform collects metrics from virtually any source using Zabbix Agent written in C, Zabbix Agent 2 written in Go with native plugin support, SNMP v1/v2c/v3 polling and trapping, IPMI for hardware health, JMX for Java applications, SSH and Telnet checks, HTTP/HTTPS polling, and ODBC database queries. Version 7.0 LTS introduced synthetic browser monitoring that executes user-defined JavaScript via WebDriver to simulate multi-step user interactions on websites, proxy load balancing with automatic host redistribution across proxy groups for high availability, in-memory proxy data buffering delivering up to 100x performance improvement, native multi-factor authentication with TOTP and Duo support, and just-in-time user provisioning from SAML and LDAP. Low-level discovery automatically detects file systems, network interfaces, SNMP OIDs, VMware resources, and Kubernetes pods, creating monitoring items and triggers dynamically. The alerting engine correlates events with configurable escalation chains, sending notifications through Slack, Microsoft Teams, PagerDuty, Jira, email, and SMS with customizable message templates. Over 1,000 official templates provide instant monitoring for Linux, Windows, VMware, AWS, Azure, Docker, PostgreSQL, MySQL, Apache, Nginx, and hundreds more. Running on a dedicated VPS on RepoCloud with guaranteed CPU, RAM, and SSD, full root SSH access, and a browser serial console. AGPL-3.0 licensed.
Apprise-API
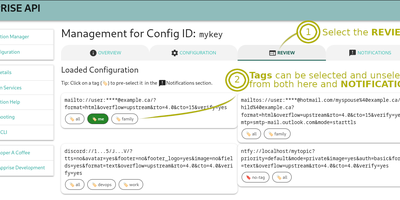
One REST call, 130+ notification services: Apprise API wraps the well-known Apprise library in a lightweight Django/Gunicorn microservice, so "send an alert" works the same whether it goes to Slack, Discord, Telegram, Teams, email, SMS, Pushover, or PagerDuty - each addressed by a simple URL scheme. It solves the credential-sprawl problem cleanly: instead of embedding provider tokens in every app, cron job, and CI pipeline, you centralize them here and everything else just POSTs a body and title. Two modes cover every workflow. Stateless calls to /notify carry target URLs in the payload (or fall back to a default set via APPRISE_STATELESS_URLS); stateful mode stores named configurations server-side under keys, so /notify/{KEY} fans out to everything registered - with tag-based routing (comma for OR, space for AND) selecting which endpoints fire per message. Messages take info, success, warning, or failure types in text, Markdown, or HTML, with attachments up to a configurable size. A built-in web UI manages and tests configurations, APPRISE_CONFIG_LOCK makes the store read-only, service allow/deny lists restrict which schemes work, webhook remapping adapts third-party payloads, and a Prometheus /metrics endpoint watches the gateway itself.
Vigil
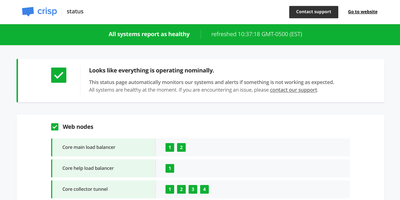
Vigil monitors your entire distributed infrastructure and generates a public status page from a single Rust binary small enough to run on a Raspberry Pi, consuming minimal CPU and memory while providing crash-free reliability. Four distinct monitoring modes cover every topology: poll probes check HTTP, TCP, SSH, and ICMP endpoints for reachability with configurable intervals and thresholds; push probes receive health reports from Vigil Reporter libraries embedded in your application code across Node.js, Python, Golang, Rust, TypeScript, Dart, and C#; local probes delegate monitoring to Vigil Local slave daemons running behind firewalls on separate LANs; and script probes execute custom shell commands for specialized health checks. Each monitored service transitions through healthy, sick, and dead states based on consecutive probe failures, with configurable thresholds controlling state transition sensitivity. When services change state, Vigil dispatches notifications through twelve alert channels including Slack, Email, Twilio SMS, Telegram, Pushover, Gotify, XMPP, Matrix, Zulip, Cisco Webex, and generic webhooks. The generated status page displays service groups organized by category with real-time replica status, system load metrics from reporter probes, and a maintenance announcement system for communicating planned downtime through the Manager HTTP API. Configuration uses a single TOML file defining all probes, services, and notification channels with no database dependency. Docker deployment pulls the official image with volume-mounted configuration. Running on a dedicated VPS on RepoCloud with guaranteed CPU, RAM, and SSD, full root SSH access, and a browser serial console. MPL-2.0 licensed.