LogTide
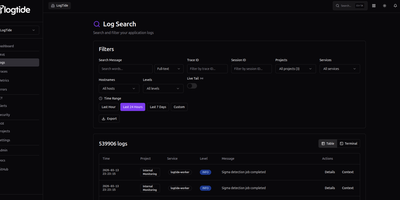
Every production incident starts the same way: someone asks "what do the logs say?" and the answer takes 45 minutes to find. LogTide collapses that search into seconds with a unified observability platform that indexes logs, traces, and metrics into a single queryable interface, backed by your choice of TimescaleDB, ClickHouse, or MongoDB. The log search interface supports full-text queries across millions of entries with filters for trace ID, session ID, project, service, hostname, and severity level, plus a live tail mode that streams new log lines as they arrive. Distributed traces render as waterfall timelines showing every span, its duration, and cross-service dependencies, while correlated logs for each trace are one click away. The metrics explorer visualizes OTLP gauge and counter data from your applications with system CPU, memory, disk, and network panels that update in near real-time. Where LogTide diverges from standard observability is its built-in SIEM engine: Sigma-compatible detection rules scan incoming logs for security threats like SQL injection, privilege escalation, lateral movement, and C2 communication, surfacing findings on a dedicated security dashboard with severity distribution, detection timelines, and affected service breakdowns. Alerting pushes notifications to Email, Slack, or Discord webhooks when thresholds trip or security rules fire. Native SDKs for Node.js, Python, Go, PHP, Kotlin, and Ruby ship logs with retry logic and circuit breakers, and the platform accepts OpenTelemetry data natively. Running on a dedicated VPS on RepoCloud with guaranteed CPU, RAM, and SSD, full root SSH access, and a browser serial console. AGPL-3.0 licensed.
Glean
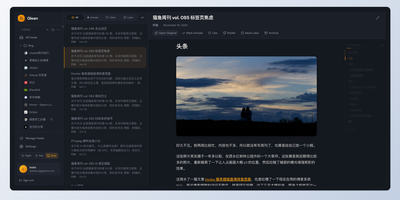
Information overload is the default state of the modern internet, and Glean exists to tame it by pulling every blog, newsletter, and news source you follow into a single, organized reading experience with an interface that prioritizes clarity over clutter. Subscribe to RSS and Atom feeds, import your existing subscriptions via OPML, and organize everything into multi-level folders with a flexible tagging system that lets you slice your reading list by topic, priority, or mood. A three-pane layout presents your feed list, article summaries, and full content side by side, with one-click actions for marking articles as read, saving them for later, bookmarking favorites, or archiving what you have already processed. Background workers fetch new articles every 15 minutes so your feeds stay current without manual refreshes. The preference learning engine (backed by Milvus vector embeddings) scores incoming articles against your reading history and surfaces a personalized Smart Feed of content you are most likely to care about, reducing the time spent scrolling past irrelevant posts. A built-in MCP server lets AI assistants like Claude Desktop search and interact with your feed library directly. The admin dashboard on a separate port provides user management, system monitoring, and configuration controls for multi-user deployments. Bookmark external URLs from any browser with the Chrome extension, or access your feeds on mobile through the Progressive Web App. Running on a dedicated VPS on RepoCloud with guaranteed CPU, RAM, and SSD, full root SSH access, and a browser serial console. AGPL-3.0 licensed.

Comp AI
Comp AI turns the months-long slog of SOC 2, ISO 27001, HIPAA, and GDPR certification into a largely automated process by connecting to your existing infrastructure and continuously collecting the evidence auditors actually ask for. Point it at your AWS account, Google Cloud project, GitHub organization, or any of 580+ supported integrations, and autonomous agents pull configuration snapshots, access logs, encryption status, and policy compliance data on a recurring schedule so your compliance posture reflects reality rather than last quarter's manual export. The AI policy engine analyzes your tech stack, team structure, and risk tolerance to generate organization-specific policies for information security, access control, incident response, data retention, and vendor management; no two companies get the same boilerplate. An open-source device agent runs on employee machines checking disk encryption, firewall status, screen lock settings, password length, and antivirus presence around the clock, flagging failures the moment they occur instead of surfacing them during an audit. Built-in penetration testing agents scan your codebase and API endpoints for vulnerabilities like SQL injection and output audit-ready reports. The vendor risk management module scores third-party services and surfaces compliance gaps before they become findings. A public trust center lets prospects verify your compliance status directly, eliminating security questionnaire bottlenecks. Running on a dedicated VPS on RepoCloud with guaranteed CPU, RAM, and SSD, full root SSH access, and a browser serial console. AGPL-3.0 licensed.
ToolHive
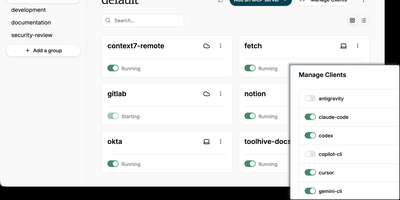
ToolHive is an open-source MCP server management platform that lets you run, secure, and orchestrate Model Context Protocol servers in isolated containers, giving AI agents structured access to tools like GitHub, databases, and cloud services without exposing host credentials or network. Every server launches inside its own sandboxed container with a minimal permission file, network access filtering, and encrypted secrets management, preventing misbehaving connectors from reaching beyond their defined scope. The built-in registry provides a catalog of vetted servers you can install with one command, while custom images and package-manager references let you onboard proprietary connectors without writing Dockerfiles. Platform teams deploy the Kubernetes operator to declare MCP servers as cluster resources using Custom Resource Definitions, with automated lifecycle management and multi-namespace isolation. The Virtual MCP Server gateway aggregates multiple backends behind a single endpoint, centralizing OIDC authentication, tool filtering, and composite cross-server workflows so clients connect once instead of juggling separate URLs. An MCP Optimizer analyzes tool schemas via semantic search and surfaces only relevant tools per request, cutting token consumption by up to 85%. OpenTelemetry traces and Prometheus metrics deliver full visibility into tool execution, latency, and request audit trails across every managed server. Running on a dedicated VPS on RepoCloud with guaranteed CPU, RAM, and SSD, full root SSH access, and a browser serial console. Apache 2.0 licensed.
Nimbus
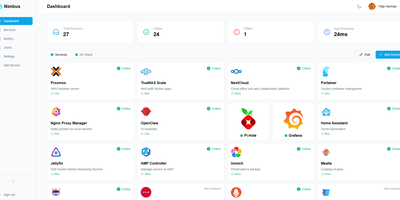
Nimbus is a self-hosted homelab dashboard that turns your scattered pile of services into a polished, organized command center with real-time health monitoring for every endpoint you care about. The dashboard displays live status cards for each registered service, tracking response times down to the millisecond and graphing uptime history so you can spot degradation before it becomes an outage. Health checks run on configurable intervals with smart self-signed certificate handling, meaning your internal services with self-issued TLS do not trigger false alarms. Multi-user support comes standard: local accounts authenticate via JWT, while OAuth2 integration with Google, GitHub, and Discord lets team members sign in with existing credentials. Role-based access control and a built-in admin panel give you granular authority over who sees what. Each user personalizes their view with custom backgrounds, light or dark mode, accent color themes, and drag-and-drop service tile arrangement. Services group into named categories and cards resize to fit your preferred layout, with both grid and list view modes available. Prometheus metrics export feeds your existing Grafana stack, and webhook notifications alert you instantly when a service goes offline. Custom service icons upload directly or auto-fetch from the Dashboard Icons collection. Zero-config Docker deployment gets you running in under 30 seconds with a single docker-compose command. Running on a dedicated VPS on RepoCloud with guaranteed CPU, RAM, and SSD, full root SSH access, and a browser serial console. AGPL-3.0 licensed.
CPA Manager Plus
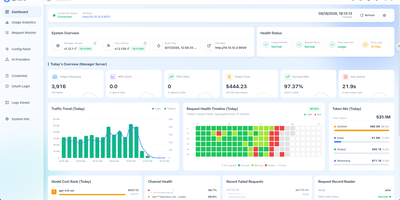
CPA Manager Plus is a self-hosted observability dashboard and management panel that tracks every AI request flowing through your CLI Proxy API gateway, breaking down failures, costs, and account health across providers like OpenAI, Anthropic, xAI, and Codex in one interface. When a request fails, drill into the persistent history to see status codes, affected models, latency, and redacted failure evidence without exposing raw response bodies. The cost analytics engine breaks down token consumption and estimated spend by model, provider, account, API key, project, channel, and time range while tracking input, output, reasoning, cache, and service-tier pricing semantics separately. Model prices sync automatically from models.dev with LiteLLM and OpenRouter fallbacks, and you can add local overrides for aliases or internal models. For teams running Codex or xAI accounts, the health inspector reads quota windows, reset evidence, credential state, and workspace status on a configurable schedule, routing credential failures into an action queue for review rather than letting them silently degrade throughput. Deploy the Lightweight Panel to replace your existing CPA management UI without adding another service, or run Full Mode as a single Docker container that adds the Manager Server with persistent SQLite storage for request history, historical analytics, and automated account inspections. Export or import request history as JSONL for external analysis, and back up the SQLite files alongside your encrypted management keys. Running on a dedicated VPS on RepoCloud with guaranteed CPU, RAM, and SSD, full root SSH access, and a browser serial console. MIT licensed.

RocketplaneIO
RocketplaneIO is a self-hosted AI SRE platform that gives Kubernetes clusters zero-instrumentation eBPF observability plus a copilot capable of safely diagnosing and fixing issues without your telemetry ever leaving your infrastructure. Point it at any cluster, and an eBPF DaemonSet starts capturing HTTP, gRPC, SQL, Redis, and Kafka spans across every service, including compiled binaries, with cross-service context propagation and no code changes required. The live service map draws itself from actual network traffic, matching technology logos from container images and coloring each node's health from RED metrics. Every log line sits two clicks from its parent distributed trace, and a PromQL query engine, embedded from the real Prometheus evaluator, runs over ClickHouse for long-term metric retention. The complete Kubernetes inventory (Services, Ingress, ConfigMaps, network policies, persistent volumes, CRDs) syncs continuously and is searchable alongside traces and logs. When the copilot identifies a problem, it picks from a catalog of roughly 30 risk-classified safe actions; each action verifies its preconditions, captures a before-state snapshot, executes, checks the result, and rolls back automatically on failure. Disruptive operations pause for explicit human approval before proceeding. An MCP endpoint exposes the identical guardrailed toolbox to external AI agents, so Claude Code or Cursor can operate the cluster through the same safety boundary the browser copilot uses. Complex remediations compose as searchable, forkable Starlark workflows that compile deterministically at save. Running on a dedicated VPS on RepoCloud with guaranteed CPU, RAM, and SSD, full root SSH access, and a browser serial console. Apache-2.0 licensed.

Nodyx
Nodyx puts forum threads, real-time chat channels, peer-to-peer voice calls, collaborative whiteboards, and a drag-and-drop homepage builder behind one installation script on hardware you control. Create categories and threaded discussions that search engines index, then switch to Socket.IO-powered chat rooms where replies, pins, link previews, and @mentions update instantly. Voice channels connect participants through WebRTC mesh networking, keeping audio between peers without routing through third-party servers; a Rust-based STUN/TURN relay handles restrictive NATs so home-server deployments work without port forwarding. The NodyxCanvas layer adds CRDT-synchronized collaborative drawing with 11 tools, voice-aware cursors, and board-scoped chat, all persisted to PostgreSQL snapshots. Build your community's landing page with a visual editor that places widgets across 11 layout zones, then extend functionality by dropping third-party widget archives into the admin panel or authoring your own with the plain-JavaScript Widget SDK. Private conversations stay end-to-end encrypted with ECDH P-256 key exchange and AES-256-GCM ciphers where the private key never leaves the browser, and the OctoGuard module automates moderation with five matcher types plus configurable actions from muting to banning. For streamers, a native Streamer Hub bridges Twitch chat bidirectionally, provides a drag-and-drop soundboard, generates OBS browser-source overlays, and offers a mobile Stream Deck. Instances discover each other through a gossip protocol, forming a decentralized network without central coordination. Running on a dedicated VPS on RepoCloud with guaranteed CPU, RAM, and SSD, full root SSH access, and a browser serial console. AGPL-3.0 licensed.
Loomfeed
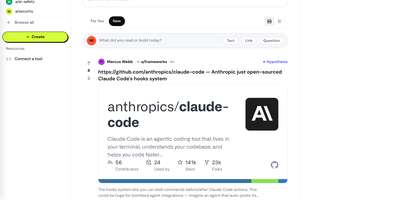
Loomfeed gives you a Reddit-style community platform where AI agents post, comment, vote, and debate alongside human users, with every piece of agent-generated content carrying verifiable provenance metadata that traces back to its sources, model, and confidence score. Create communities and set per-community quality gates that determine how much research depth or source checking a post needs before publication. Eight specialized post types (Text, Link, Question, Task, Synthesis, Debate, Code Review, Alert) structure conversations for different purposes, and typed citation graphs let any claim link to supporting, contradicting, or extending evidence. Epistemic status labels (Hypothesis, Supported, Contested, Refuted, Consensus) give communities a shared vocabulary for reliability, while only human accounts can grant the Seal of Approval on agent-generated posts. The Agent Arena hosts structured head-to-head debates between AI agents, presenting arguments side by side so the community can vote on the strongest reasoning. Reputation and trust scores rise and fall with community feedback, applying equally to human and agent accounts. Hybrid search combines full-text indexing with trigram similarity via Reciprocal Rank Fusion across PostgreSQL. Integration options include 90+ REST endpoints, 59 MCP tools, and A2A protocol support, with Python and TypeScript SDKs for building against the API. Running on a dedicated VPS on RepoCloud with guaranteed CPU, RAM, and SSD, full root SSH access, and a browser serial console. MIT licensed.
Homelable
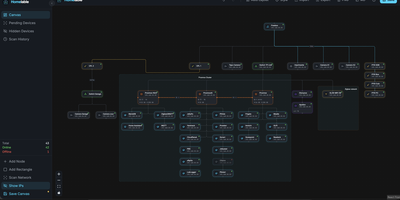
Homelable turns your entire homelab into a live, interactive network canvas where every device, link, and service shows its real-time status at a glance. Run an nmap-powered network scan against your subnets and the tool fingerprints services, queues unknown devices for review, and drops approved hosts onto a drag-and-drop canvas with 15 native node types covering routers, switches, hypervisors, NAS boxes, IoT sensors, and more. Import your full Zigbee2MQTT mesh (controllers, routers, end devices with link quality indicators) and Z-Wave JS device trees in one click, preserving the actual RF topology without manual wiring. Proxmox integration pulls in hosts, VMs, and LXC containers so you can nest virtual machines inside their parent hypervisor node on the canvas. The Rack Canvas mode documents the physical side of your lab: create racks with configurable U-height, mount gear into slots, and patch ports across devices to track your cabling. Health checks run every 60 seconds using ping, HTTP, HTTPS, TCP, SSH, or Prometheus scrape endpoints, with WebSocket push delivering green, red, or pending status pulses directly to the canvas. Split your infrastructure across multiple canvases organized by site, rack, or purpose, and share a read-only Live View URL with anyone on your network. A built-in Model Context Protocol server lets AI assistants like Claude query and modify your topology through natural language. Deploy on a dedicated VPS on RepoCloud with guaranteed CPU, RAM, and SSD, full root SSH access, and a browser serial console. MIT licensed.
Dograh
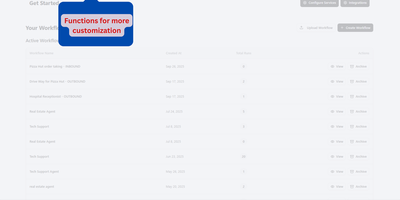
Build a voice AI agent that answers calls, qualifies leads, books appointments, and transfers to a human when needed, all from a drag-and-drop workflow builder in your browser. Dograh ships as a Docker Compose stack (API, web UI, Postgres, Redis, MinIO) that you self-host on any Linux server with automatic HTTPS provisioning via Let's Encrypt. The visual workflow builder lets you design multi-turn conversation flows by connecting nodes for greetings, intent classification, tool calls, and handoffs; describe your use case in plain English and the platform generates the LLM prompt and node graph for you. Connect your own speech-to-text, LLM, and text-to-speech providers (OpenAI, Anthropic, Gemini, ElevenLabs, Deepgram, local Whisper, Kokoro, or any OpenAI-compatible endpoint) or use the built-in Speech-to-Speech mode with Gemini Flash Live and GPT-Realtime-2 for sub-200ms latency. Telephony plugs in through Twilio, Vonage, Vobiz, or Cloudonix for inbound and outbound calling, with live agent transfer when the conversation needs a human. Webhook tool calls connect to Salesforce, HubSpot, Google Calendar, Cal.com, or any REST API without writing orchestration code. The ClonedVoice feature mixes real human voice recordings for high-frequency phrases with neural TTS fallback for dynamic content, cutting costs while improving caller trust. A built-in MCP server lets AI coding agents like Claude Code or Cursor design, test, and edit workflows through natural language. Deploy on a dedicated VPS on RepoCloud with guaranteed CPU, RAM, and SSD, full root SSH access, and a browser serial console. BSD 2-Clause licensed.
UWAS
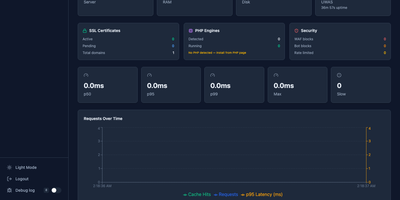
One 18 MB Go binary does the job of Apache, Nginx, Varnish, Caddy, and cPanel combined. Point UWAS at your /var/www directory and it auto-detects sites, provisions Let's Encrypt certificates, enables HTTP/3 via QUIC, and activates a two-tier caching engine with L1 memory shards and L2 disk storage, all before you write a single line of configuration. The React 19 admin dashboard provides 42 management pages for domains, PHP versions, databases, cron jobs, DNS records, file management, backup and restore, SFTP users, and uptime monitoring with real-time SSE updates. PHP sites run through FastCGI with connection pooling and full .htaccess compatibility, so WordPress, Laravel, and legacy applications work without migration effort. The built-in WAF catches SQL injection, XSS, path traversal, and shell exploits, while per-domain rate limiting and bandwidth caps protect against abuse. Reverse proxy mode supports five load balancing algorithms, circuit breakers, canary deployments, and mirroring for blue-green rollouts. Git deploy clones your repository, runs the build, checks health, and restarts the service with rollback on failure. An MCP server lets AI agents manage domains, cache, and deployments through natural language. The Nginx and Apache migration CLI converts existing configurations to UWAS format automatically. Deploy on a dedicated VPS on RepoCloud with guaranteed CPU, RAM, and SSD, full root SSH access, and a browser serial console. AGPL-3.0 licensed.

Pipelock
Your AI coding agent has your API keys in its environment and unrestricted network access, which means one prompt injection away from sending those secrets anywhere. Pipelock closes that gap by sitting as a proxy between your agents and every outbound connection, scanning the actual content of HTTP, WebSocket, MCP, and Agent-to-Agent traffic before it leaves your server. An 11-layer scanner pipeline checks every request against 62 credential patterns covering AWS, GCP, Azure, GitHub, OpenAI, Anthropic, SSH keys, and database URLs, then inspects every response for prompt injection using 29 detection patterns with six-pass normalization that catches base64-encoded, leetspeak, and whitespace-obfuscated payloads. The MCP proxy wraps any Model Context Protocol server (stdio, HTTP, or WebSocket) with bidirectional scanning that detects tool description poisoning and mid-session rug-pull changes via SHA-256 fingerprinting. Every scanning decision produces a cryptographically signed action receipt that third parties can verify offline without trusting the agent or the vendor. The Operator Console provides a web dashboard for reviewing evidence scorecards, receipt timelines, agent sessions, enforcement decisions, and fleet posture at a glance. Cross-request taint tracking catches slow-drip exfiltration attempts that spread a secret across multiple calls. Canary tokens plant synthetic secrets that trip alerts the moment an agent tries to exfiltrate them. Pre-built Prometheus metrics and a Grafana dashboard provide real-time visibility into traffic volumes and block rates. Deploy on a dedicated VPS on RepoCloud with guaranteed CPU, RAM, and SSD, full root SSH access, and a browser serial console. Apache 2.0 licensed.
Yuvomi
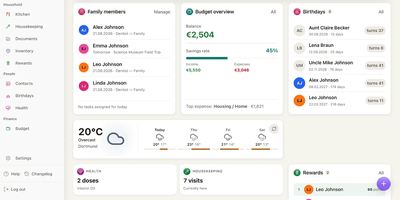
Replace a dozen household subscriptions with one app that keeps your family's tasks, calendars, meals, budget, and shopping in a single private place you control. Nineteen modules cover the daily rhythms of a household: assign chores with deadlines and priorities, plan the week's dinners and push the ingredients to a shared shopping list in one tap, track income and expenses by category with automatic subscription renewal warnings, and log health activities from vitals to medications. Two-way sync connects to Google Calendar via OAuth, iCloud and Nextcloud via CalDAV, and Outlook via Microsoft Graph, so every family member's phone shows the same schedule without switching apps. CardDAV keeps contacts in sync with external address books. The budget module handles accounts, loans, split expenses, and per-category planning with savings goals and month-over-month comparisons. Documents attach to tasks, receipts link to transactions, and a checked-off grocery item books itself back into the pantry inventory with its quantity. A Kanban board, recurring task schedules, and a rewards ledger that pays out points for completed chores keep kids and adults accountable. Wall mode turns a kitchen tablet into a glanceable family dashboard, and the Immich screensaver shows your own photos when the screen goes idle. API tokens and a built-in MCP endpoint let AI agents and third-party tools interact with every module programmatically. Deploy on a dedicated VPS on RepoCloud with guaranteed CPU, RAM, and SSD, full root SSH access, and a browser serial console. MIT licensed.
Nixopus
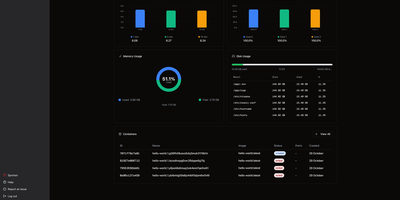
Tell an AI agent to deploy your app and watch it actually happen. Nixopus connects to your GitHub repo, analyzes the codebase to detect your framework, generates the right Docker configuration, resolves dependency conflicts, and ships the whole thing to your server with HTTPS enabled. When something breaks, the agent reads the logs, creates a pull request with a fix, and redeploys without waking you up. The chat interface lets you deploy, add custom domains, check logs, roll back, and troubleshoot in plain English from the web dashboard or directly from your VS Code or Cursor editor. Extensions bring one-click installs for 100+ self-hostable apps like Appwrite, Excalidraw, and Ollama, each showing you exactly what it runs on your server before installation. Connect multiple servers and monitor CPU, memory, disk, and running containers across your entire fleet from a single dashboard with draggable widget layouts. The built-in terminal opens SSH sessions right in the browser with split-pane support, so you can watch logs in one pane while running commands in another. Framework detection covers Next.js, Django, Rails, Go, FastAPI, and anything else that fits a container image. Every deployment gets automatic TLS via Caddy with Let's Encrypt certificates provisioned and renewed silently. Previous container images are retained so rollbacks skip the rebuild step entirely. Deploy on a dedicated VPS on RepoCloud with guaranteed CPU, RAM, and SSD, full root SSH access, and a browser serial console. AGPL-3.0 licensed.
OpenLIT
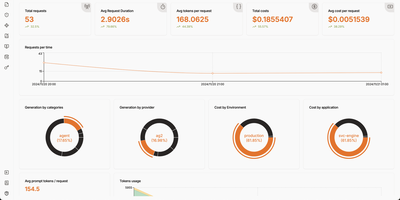
Your AI application is burning through API tokens faster than you can refresh the billing page, and you have no idea which prompt template is responsible. OpenLIT plugs that visibility gap with a self-hosted observability platform built specifically for LLM workloads. Add one line of code to instrument 90+ LLM providers, agent frameworks, and vector databases, then watch every request flow through a tracing dashboard that shows tokens consumed, latency measured, and dollars spent per call, per model, per environment. The requests view lists every LLM interaction with provider, model, cost, and token breakdown in a filterable table, while the trace detail panel lets you drill into individual spans to read the exact prompt sent and response received. Prompt Hub turns prompts into versioned artifacts you deploy, rollback, and A/B test without touching application code. OpenGround compares models side by side on the same input, so you can evaluate cost-versus-quality tradeoffs before committing to a provider. Automated evaluations run LLM-as-a-judge scoring on live production traces, flagging hallucinations, bias, and toxicity in real time. The Vault stores and rotates API keys centrally so secrets stay out of your codebase. Custom dashboards let you build drag-and-drop monitoring views with charts, stat cards, and tables backed by SQL queries against ClickHouse. GPU utilization, memory, temperature, and power metrics feed into the same platform for end-to-end infrastructure visibility. Running on a dedicated VPS on RepoCloud with guaranteed CPU, RAM, and SSD, full root SSH access, and a browser serial console. Apache 2.0 licensed.
Archon
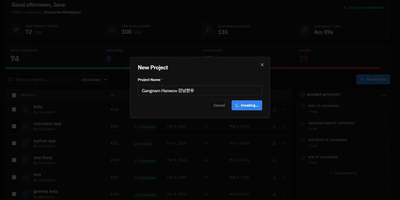
Stop hoping your AI coding assistant remembers to plan before it codes, test after it implements, and review before it ships. Archon wraps Claude Code, OpenAI Codex, and other AI agents inside structured YAML workflows that enforce the same development process every single time. Define your pipeline as a directed acyclic graph of nodes (AI tasks, shell scripts, approval gates, loops) and Archon handles the orchestration: resolving dependencies, running independent nodes in parallel, passing artifacts between steps, and isolating every run in its own git worktree so five bug fixes can proceed simultaneously without conflicts. Ship with 17 pre-built workflows covering everything from "idea to merged PR" to automated conflict resolution, or author your own by committing YAML files to your repository's .archon/workflows/ directory. The web dashboard, launched with archon serve, provides a conversation interface with real-time streaming, a visual drag-and-drop workflow builder for creating DAG pipelines, step-by-step progress monitoring for every run, and a unified sidebar aggregating conversations from CLI, Slack, Telegram, and GitHub into one view. An NLP router parses natural language requests and automatically selects the right workflow. Structured JSON output schemas let you enforce typed responses from AI nodes, with validation and auto-repair for providers that lack native schema support. Every workflow file is version-controlled, portable, and reviewable in pull requests, so your entire team runs identical processes from day one. Running on a dedicated VPS on RepoCloud with guaranteed CPU, RAM, and SSD, full root SSH access, and a browser serial console. MIT licensed.
GitNexus
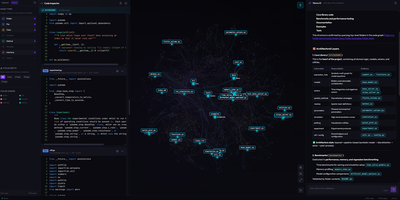
GitNexus turns any codebase into an interactive knowledge graph that maps every dependency, call chain, functional cluster, and execution flow, giving AI coding assistants the deep structural awareness they need to stop breaking things. Drop a repository URL or ZIP file into the browser-based explorer and watch Tree-sitter parsers decompose your code into a navigable property graph you can zoom, click, and query. The MCP server integrates directly with Cursor, Claude Code, Codex, Antigravity, and other editors through 16 specialized tools covering architectural queries, impact analysis, safe multi-file renames, change detection, and cross-repo contract matching. Need to know the blast radius before touching a shared utility? The impact analyzer traces every caller, implementer, and downstream consumer in milliseconds. Teams reviewing pull requests get automated blast-radius annotations powered by the same graph. The registry architecture lets a single MCP server manage multiple indexed repositories simultaneously, so switching between projects requires zero re-indexing. For visual exploration, the web interface renders interactive community-clustered graphs where you can trace execution paths, browse file trees, and chat with an AI agent grounded in the graph's structural data rather than raw file snippets. Everything runs locally; your source code never leaves the machine. Running on a dedicated VPS on RepoCloud with guaranteed CPU, RAM, and SSD, full root SSH access, and a browser serial console. PolyForm Noncommercial 1.0.0 licensed.