Stars
Forks
Watchers
Developer links
Homelable
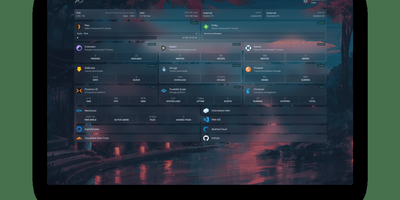
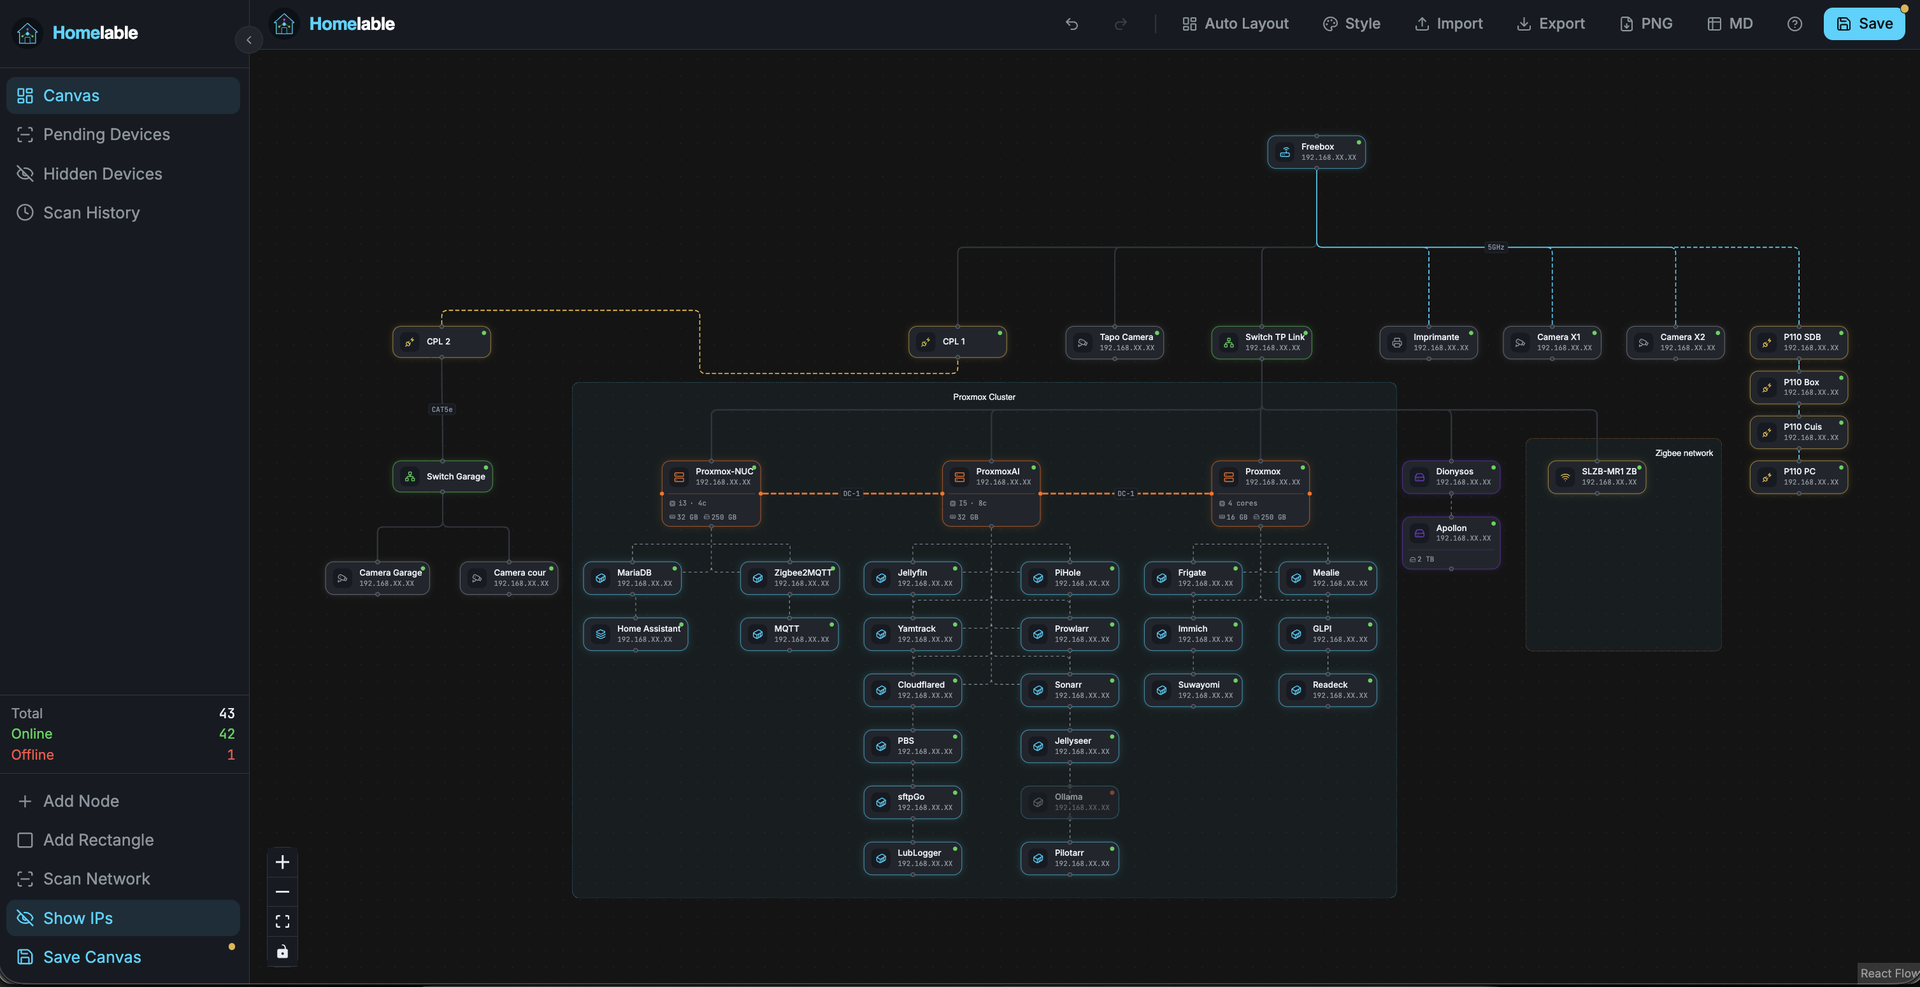
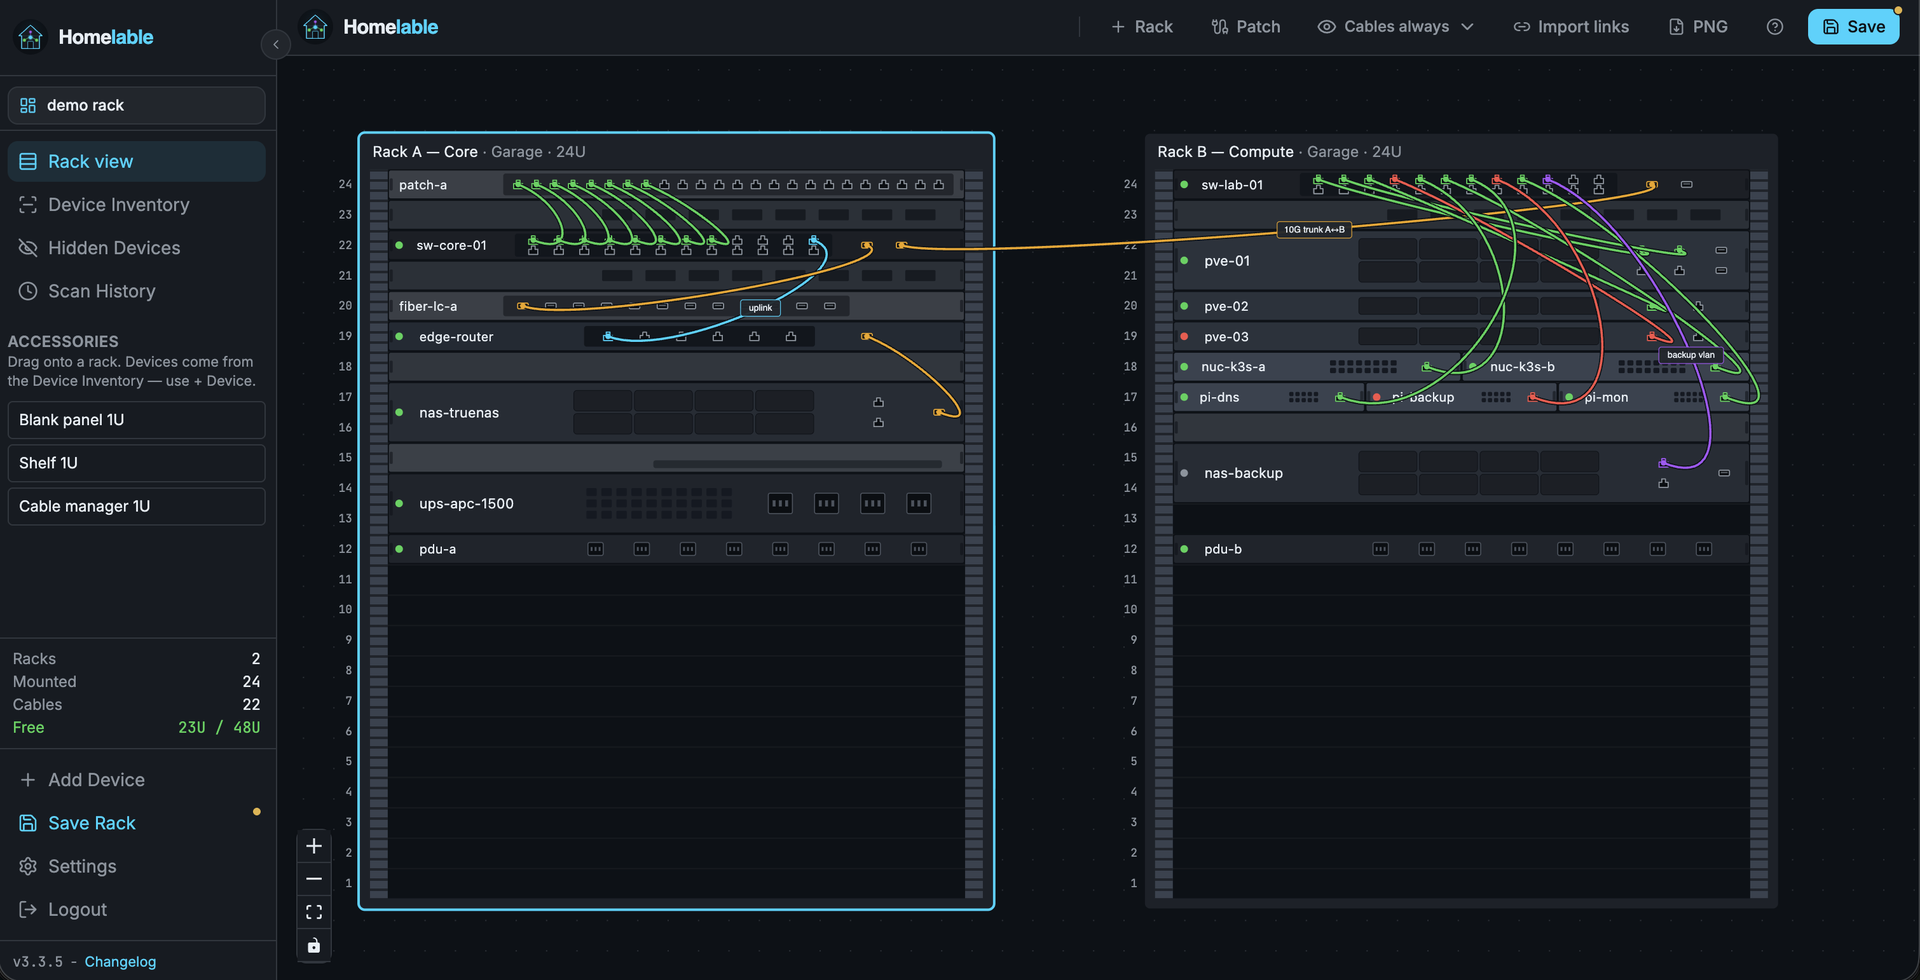
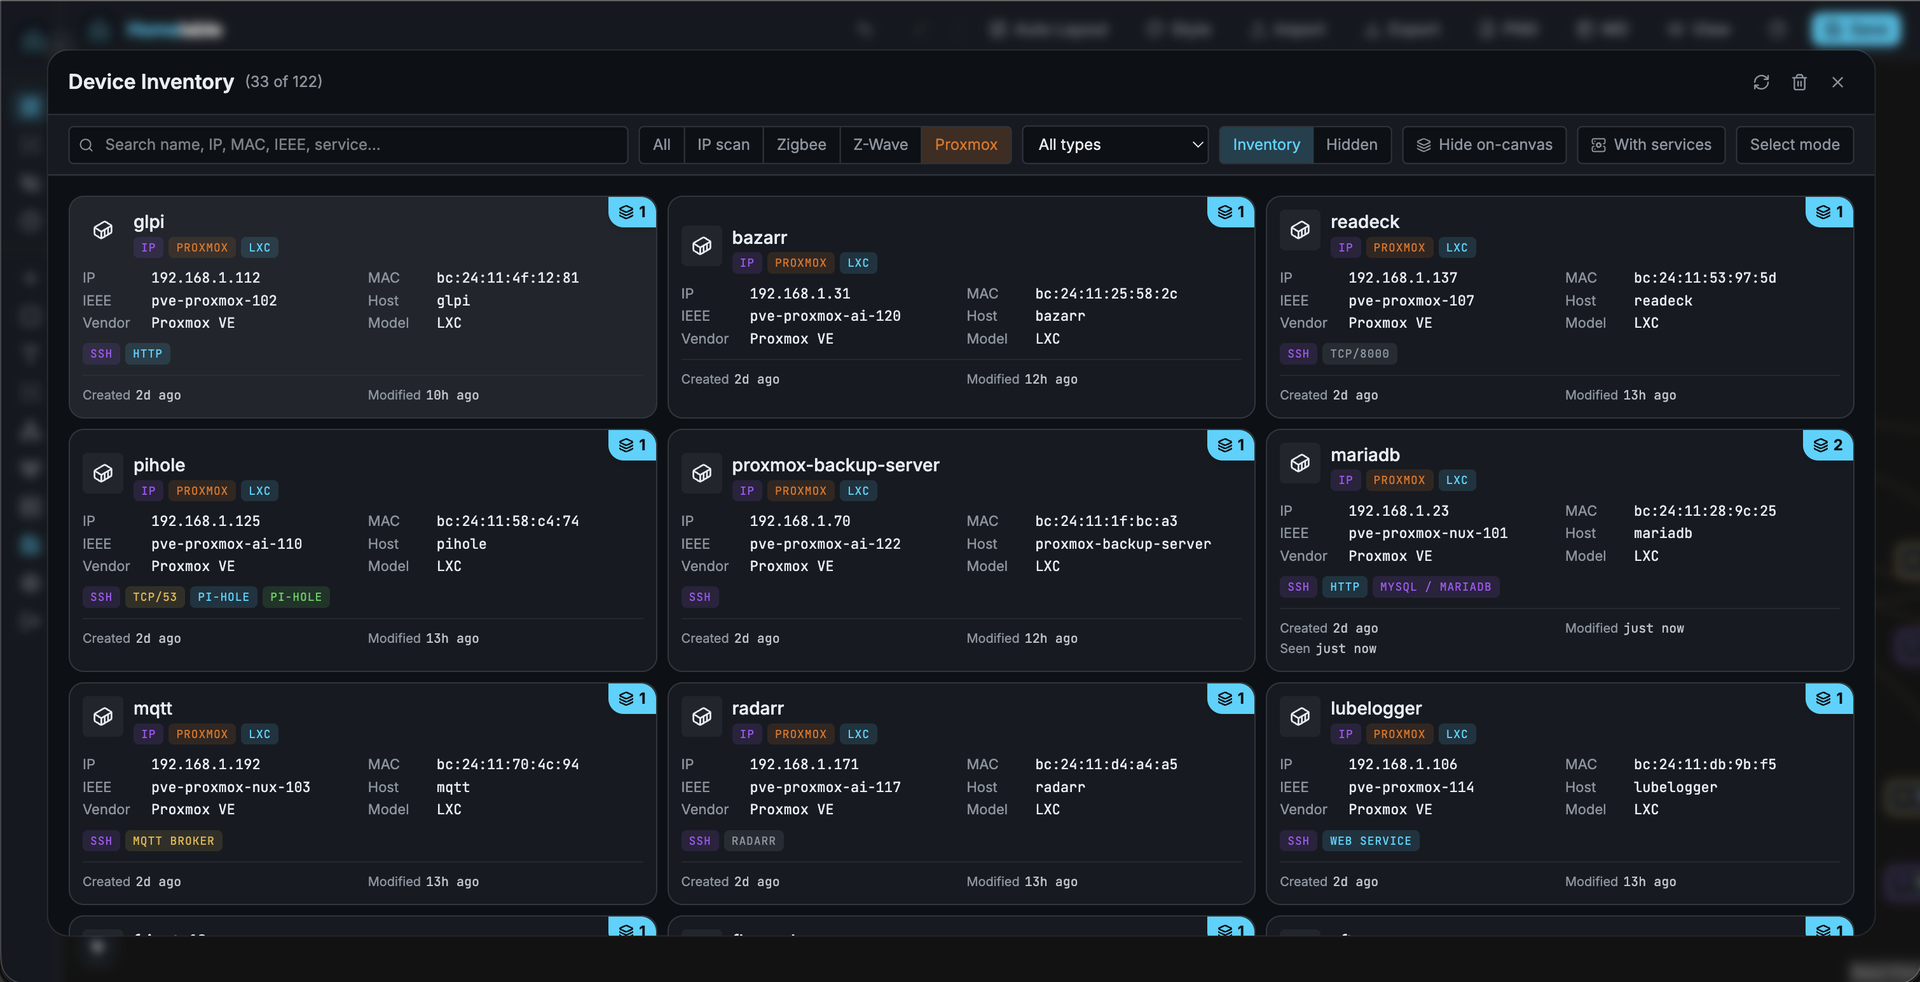
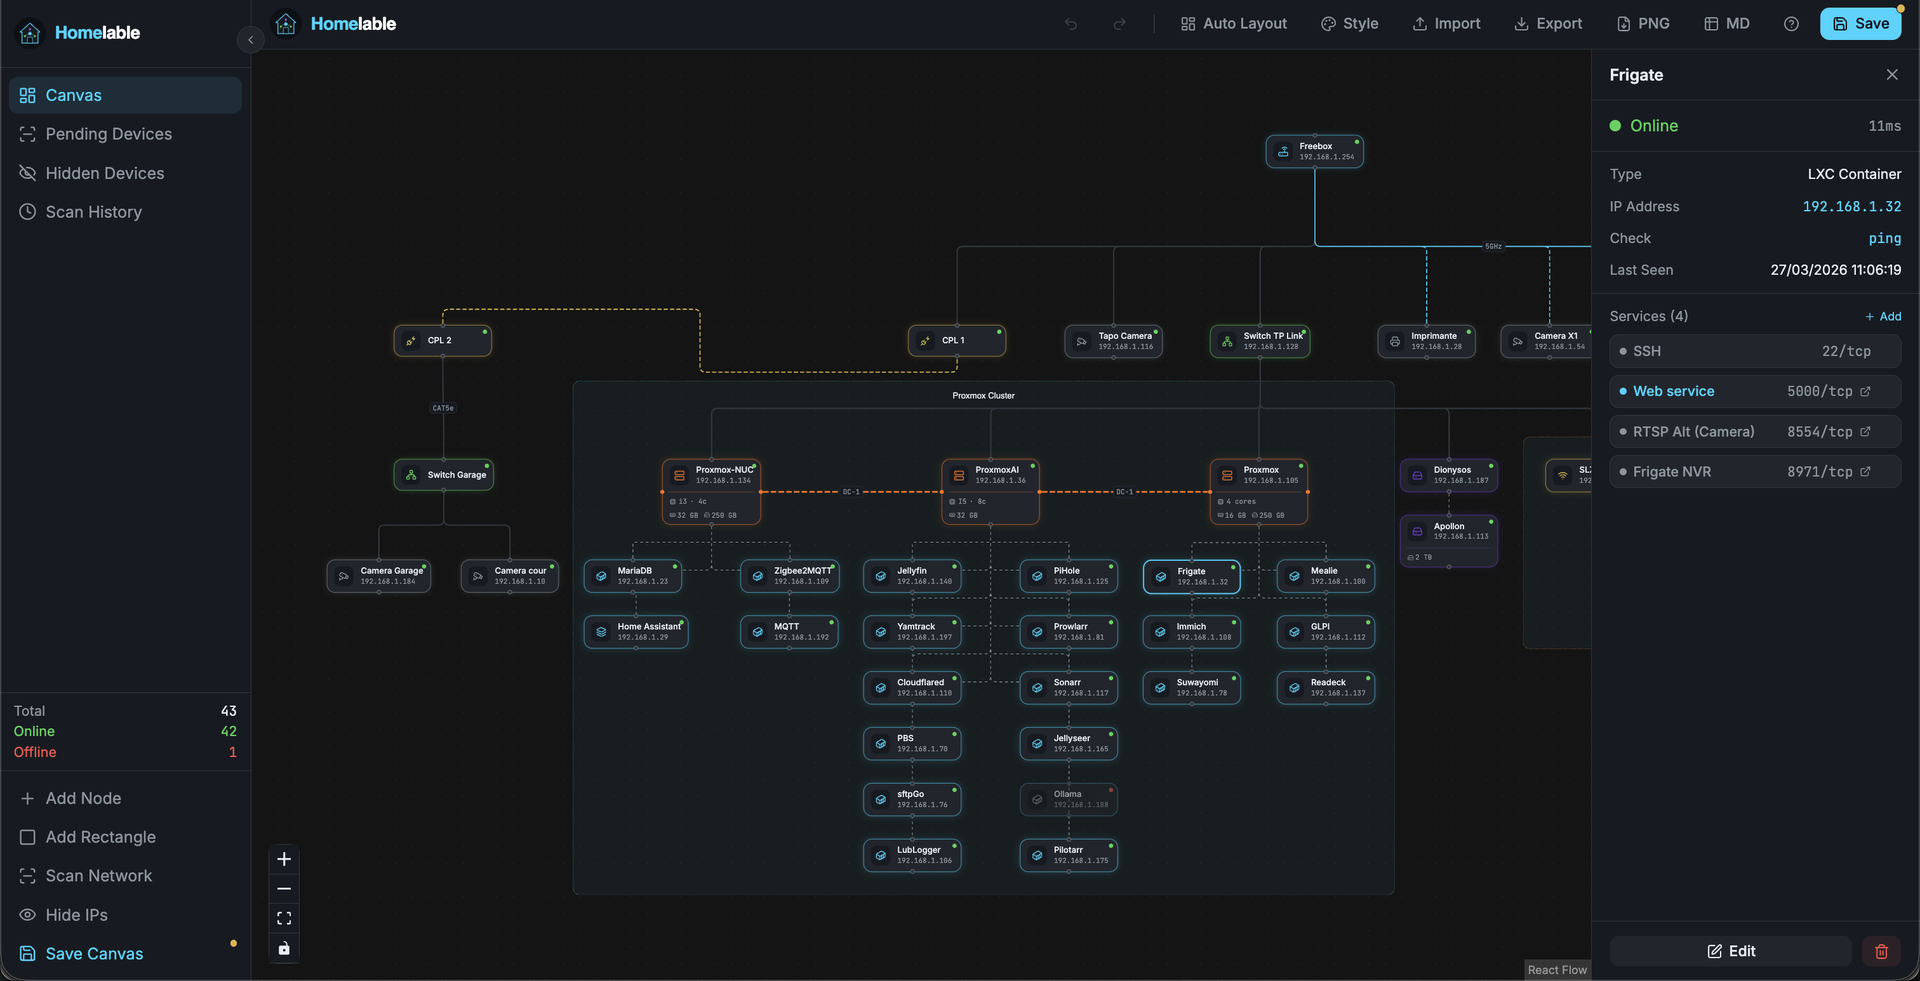
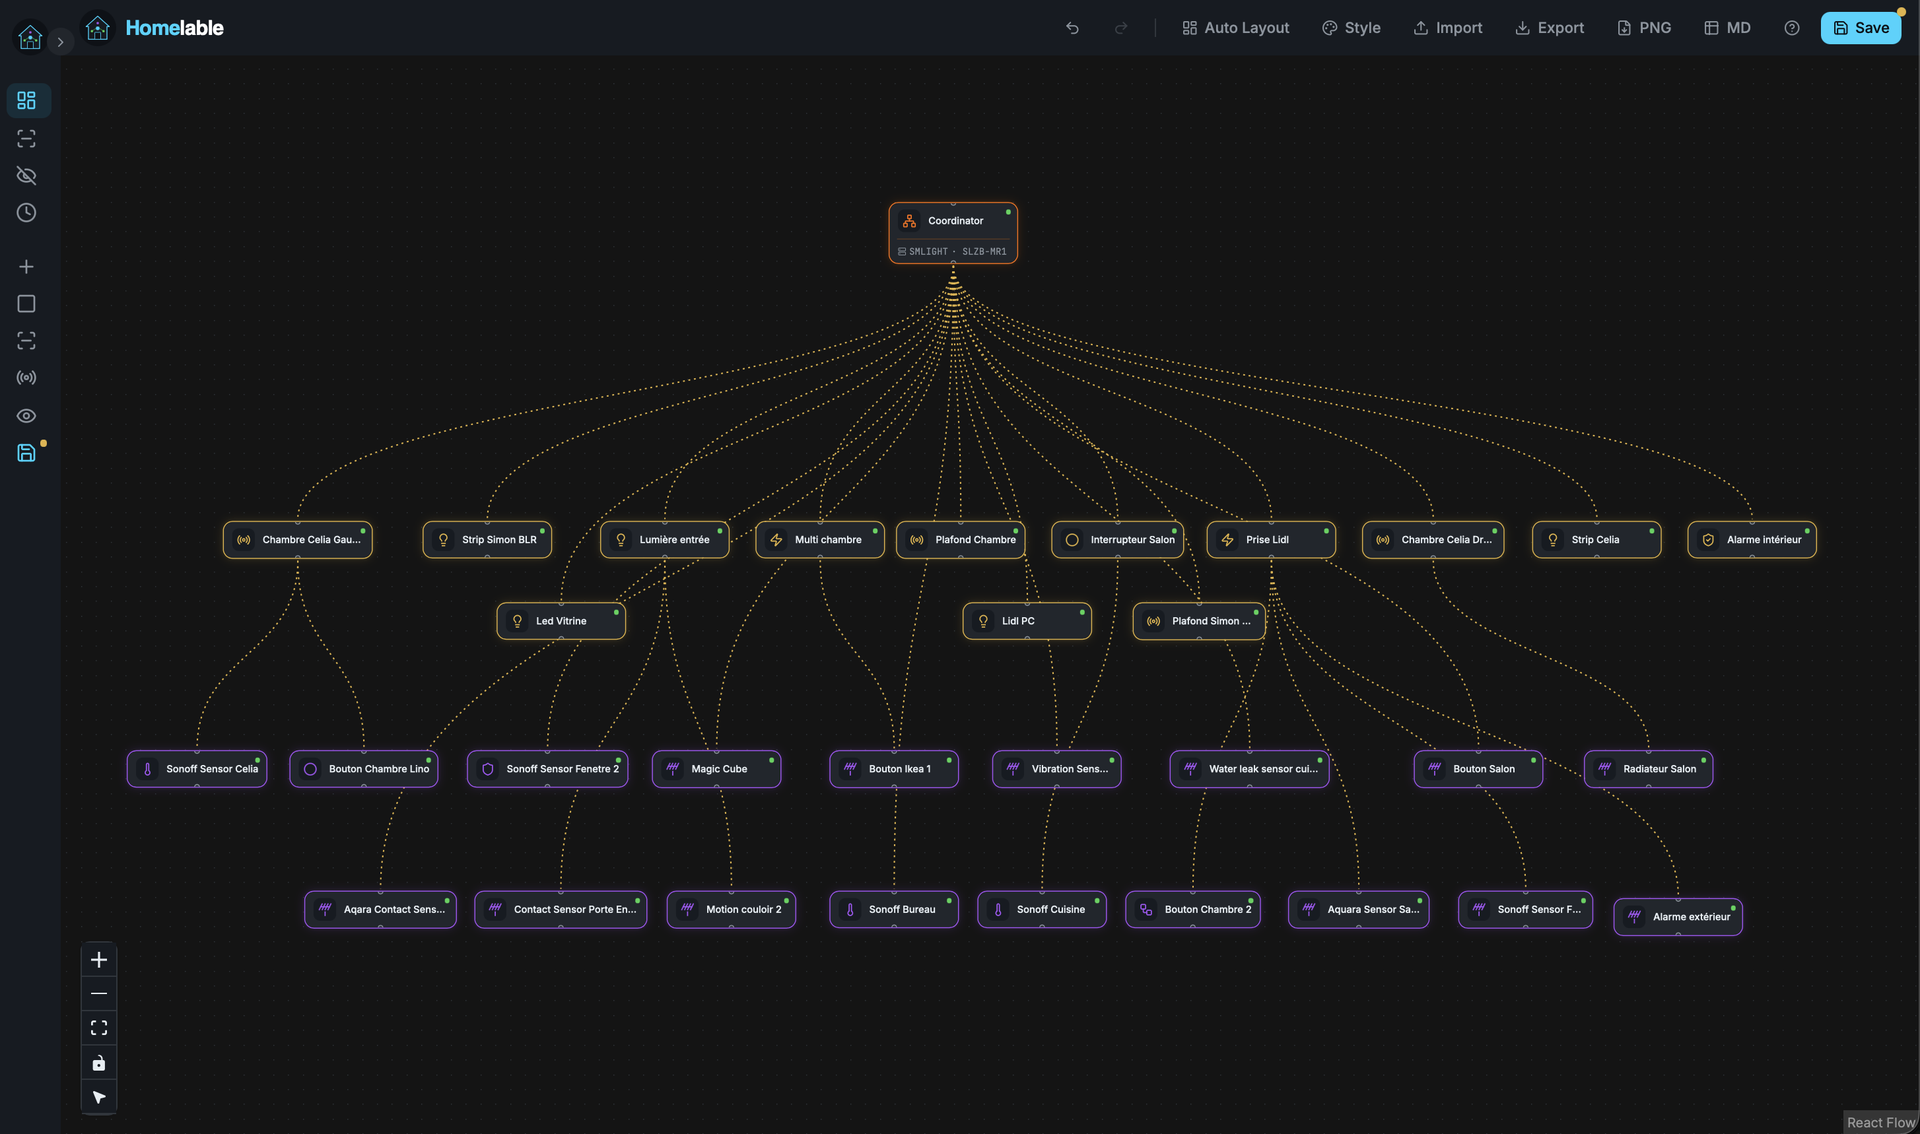
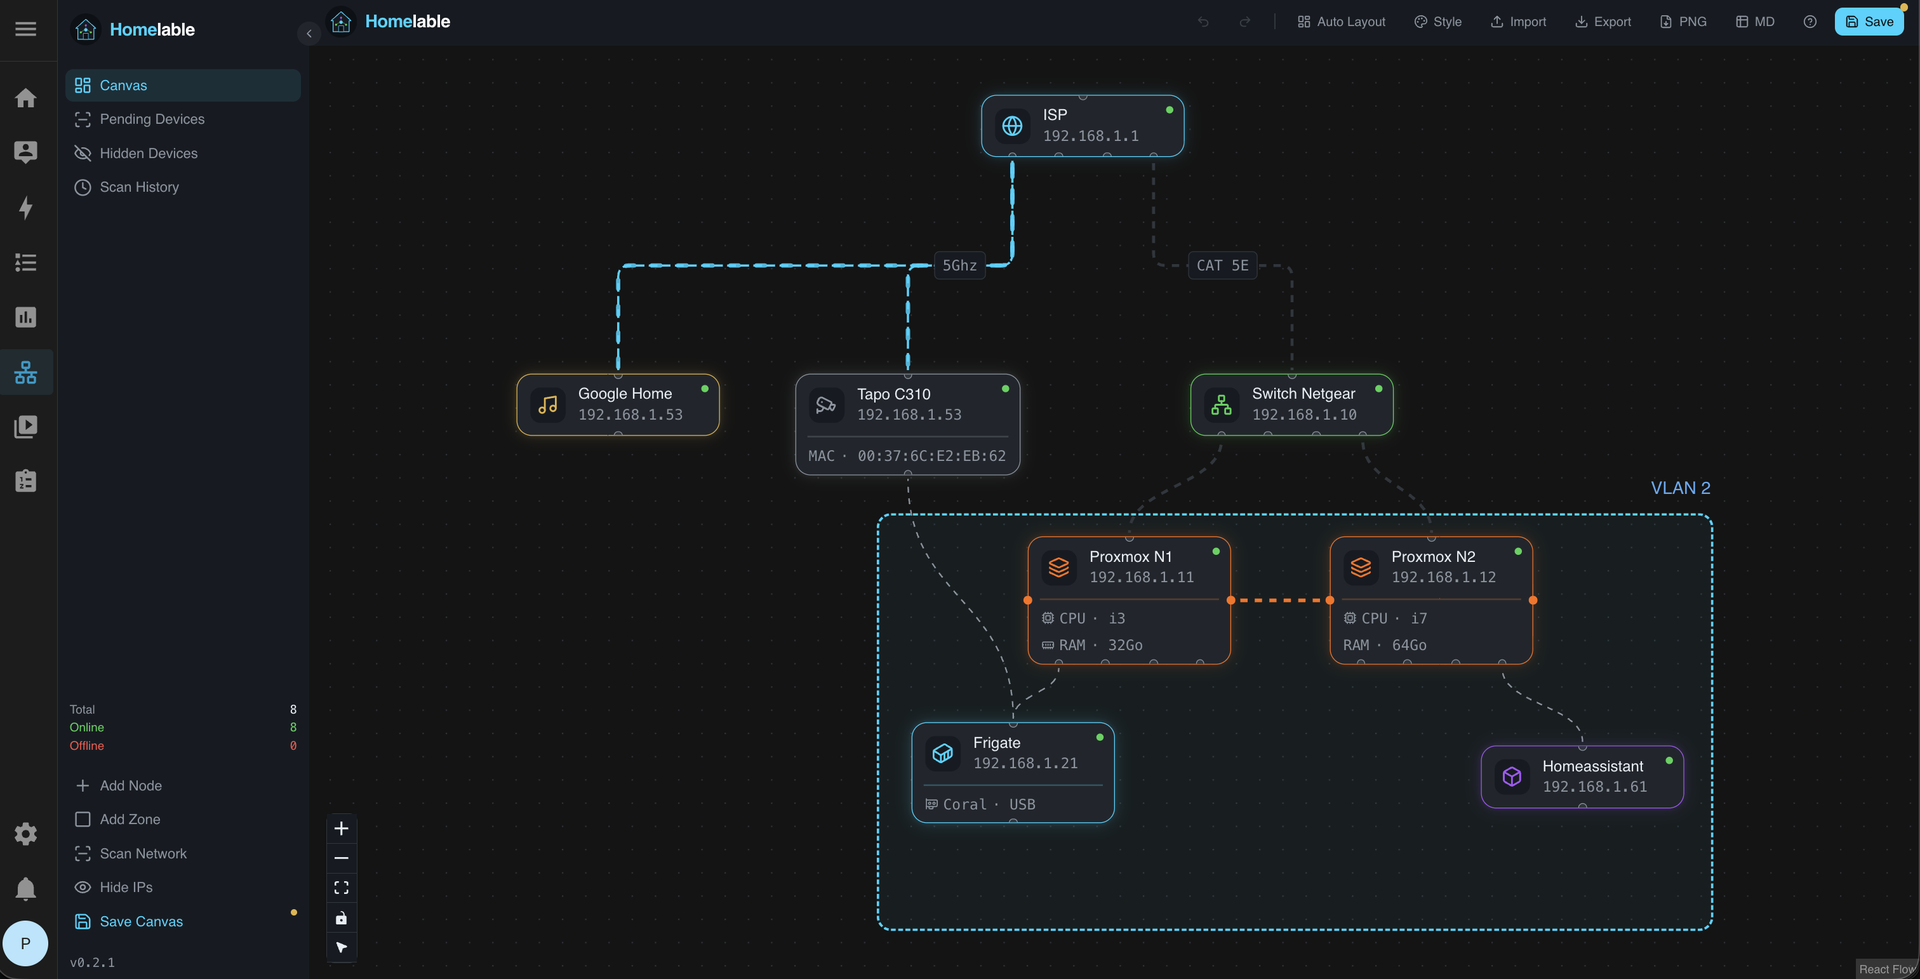
Homelable turns your entire homelab into a live, interactive network canvas where every device, link, and service shows its real-time status at a glance. Run an nmap-powered network scan against your subnets and the tool fingerprints services, queues unknown devices for review, and drops approved hosts onto a drag-and-drop canvas with 15 native node types covering routers, switches, hypervisors, NAS boxes, IoT sensors, and more. Import your full Zigbee2MQTT mesh (controllers, routers, end devices with link quality indicators) and Z-Wave JS device trees in one click, preserving the actual RF topology without manual wiring. Proxmox integration pulls in hosts, VMs, and LXC containers so you can nest virtual machines inside their parent hypervisor node on the canvas. The Rack Canvas mode documents the physical side of your lab: create racks with configurable U-height, mount gear into slots, and patch ports across devices to track your cabling. Health checks run every 60 seconds using ping, HTTP, HTTPS, TCP, SSH, or Prometheus scrape endpoints, with WebSocket push delivering green, red, or pending status pulses directly to the canvas. Split your infrastructure across multiple canvases organized by site, rack, or purpose, and share a read-only Live View URL with anyone on your network. A built-in Model Context Protocol server lets AI assistants like Claude query and modify your topology through natural language. Deploy on a dedicated VPS on RepoCloud with guaranteed CPU, RAM, and SSD, full root SSH access, and a browser serial console. MIT licensed.
Benefits
- Complete Homelab Visibility
- Drag, pan, and zoom across an interactive canvas showing every server, VM, container, and IoT device on your network. Live status indicators update via WebSocket every 60 seconds.
- Automatic Device Discovery
- nmap scans fingerprint services across your configured CIDR ranges and queue unknown devices for one-click approval. No manual IP entry required for initial network mapping.
- Physical Rack Documentation
- The Rack Canvas mode creates rack diagrams with configurable U-heights, device mounting, and port-to-port patching. Track your actual cabling alongside the logical network topology.
- Wireless Mesh Visualization
- Import Zigbee2MQTT and Z-Wave JS device hierarchies with real RF link quality data. See controllers, routers, and end devices arranged by their actual wireless mesh structure.
Features
- Network Scanner
- Runs nmap with service version detection across configured subnets. Discovered devices enter a pending queue for review before being added to the canvas.
- Live Status Monitoring
- Configurable health checks via ping, HTTP, HTTPS, TCP, SSH, and Prometheus endpoints. APScheduler runs checks every 60 seconds with WebSocket push to the UI.
- Rack Canvas
- Design physical rack layouts with U-height slots, mounted equipment, and port-to-port patch connections. Complements the logical network diagram with physical documentation.
- Proxmox Integration
- Import Proxmox VE hosts with their VMs and LXC containers. Nested nodes on the canvas reflect the actual hypervisor-to-guest hierarchy.
- MCP Server
- Built-in Model Context Protocol server on port 8001 exposes read and write topology access. AI assistants like Claude can query device status and modify the canvas.