HitKeep
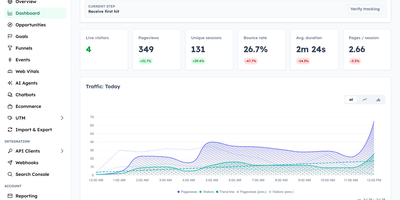
HitKeep is a sovereign web analytics platform that consolidates cookieless visitor telemetry, conversion funnels, e-commerce revenue reports, and AI engine visibility into a privacy-respecting dashboard that replaces Google Analytics and complex tracking clouds. Marketing teams can monitor inbound visitor journeys without installing intrusive consent banners or violating regional GDPR regulations. Custom conversion funnels and goal milestones track user registrations, checkout transactions, newsletter subscriptions, and software downloads with exact revenue attribution. Integrated Google Search Console synchronization brings organic search queries, keyword impression rankings, and click-through metrics directly alongside real-time pageview logs. A dedicated artificial intelligence visibility dashboard monitors crawling bots, retrieval citations, and direct referral visits originating from ChatGPT, Claude, Perplexity, and other generative search agents. Growth analysts can pose natural language questions to an embedded AI reporting assistant, generating instant cohort breakdowns and engagement trends without assembling complex manual filters. Site operators can configure custom tracking domains, whitelist reverse proxy networks, filter out referrer spam, and schedule automated database backups across persistent storage volumes. Complete data sovereignty controls allow teams to export raw event telemetry into open Parquet and CSV archives or stream metrics into external business intelligence warehouses via webhooks. Running on a dedicated VPS on RepoCloud with guaranteed CPU, RAM, and SSD, full root SSH access, and a browser serial console. MIT licensed.
db-ui
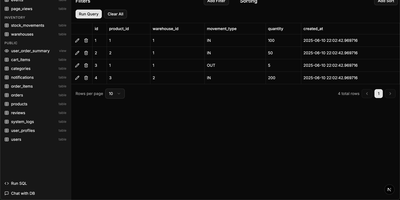
Traditional database management tools like pgAdmin and phpMyAdmin were built for DBAs, not for the rest of the team that just needs to look up a record or run a quick query. db-ui strips away the complexity and gives you a clean, modern interface that anyone can use. Browse tables in a paginated grid view with inline editing, filtering, and sorting built right into the column headers. The sidebar lists every table and view across all schemas with fuzzy search (Cmd+K to focus) that filters results as you type. Click any table to see its data, or switch to the schema introspection view to visualize columns, types, constraints, and relationships without writing a single query. The SQL editor provides syntax highlighting, result visualization in tabular format, and one-click CSV export for downstream analysis. For questions about your data model, the integrated AI chat assistant has full access to your database schema and can help you understand table relationships, write complex queries, suggest indexes, and provide optimization recommendations with streaming responses. Connect to PostgreSQL, MySQL, or Microsoft SQL Server through environment variables and deploy the whole application as a single Docker container. On RepoCloud, deploy db-ui on a dedicated VPS with root SSH access and direct connectivity to your database servers under the MIT license.
Nimbus
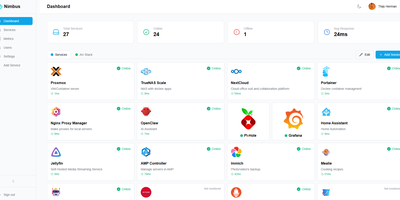
Nimbus is a self-hosted homelab dashboard that turns your scattered pile of services into a polished, organized command center with real-time health monitoring for every endpoint you care about. The dashboard displays live status cards for each registered service, tracking response times down to the millisecond and graphing uptime history so you can spot degradation before it becomes an outage. Health checks run on configurable intervals with smart self-signed certificate handling, meaning your internal services with self-issued TLS do not trigger false alarms. Multi-user support comes standard: local accounts authenticate via JWT, while OAuth2 integration with Google, GitHub, and Discord lets team members sign in with existing credentials. Role-based access control and a built-in admin panel give you granular authority over who sees what. Each user personalizes their view with custom backgrounds, light or dark mode, accent color themes, and drag-and-drop service tile arrangement. Services group into named categories and cards resize to fit your preferred layout, with both grid and list view modes available. Prometheus metrics export feeds your existing Grafana stack, and webhook notifications alert you instantly when a service goes offline. Custom service icons upload directly or auto-fetch from the Dashboard Icons collection. Zero-config Docker deployment gets you running in under 30 seconds with a single docker-compose command. Running on a dedicated VPS on RepoCloud with guaranteed CPU, RAM, and SSD, full root SSH access, and a browser serial console. AGPL-3.0 licensed.