Traceway
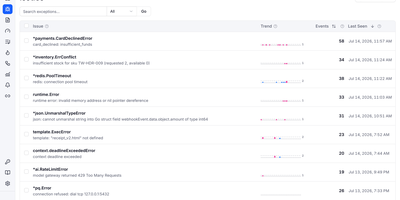
Production debugging slows to a crawl when logs, distributed traces, metrics, and session replays live in four disconnected dashboards, which is why Traceway consolidates every OpenTelemetry signal into a single self-hosted observability platform. Point any standard OTLP exporter directly at the ingestion endpoints without maintaining an intermediary collector or installing proprietary vendor SDKs. When an unhandled exception fires in production, automatic SHA-256 stack trace fingerprinting groups duplicates into prioritized issues complete with source-mapped frames and attached browser or Flutter session replays showing exact user clicks before the crash. Clicking any structured log entry jumps straight to its corresponding distributed span waterfall so engineers can trace slow database queries or failing downstream HTTP calls across microservices. Route performance bottlenecks surface immediately through per-endpoint P50, P95, and P99 latency percentiles ranked by Apdex and a five-factor impact score. Teams shipping AI features can also inspect LLM token consumption, model costs, tool calls, and multi-turn conversations grouped by customer identifier. Built-in on-call rotation schedules, escalation policies, and multi-channel alerts via Slack, Telegram, Pushover, email, and webhooks ensure incidents reach the right responder with one-click acknowledgment links. Running on a dedicated VPS on RepoCloud with guaranteed CPU, RAM, and SSD, full root SSH access, and a browser serial console. MIT licensed.
Monoscope
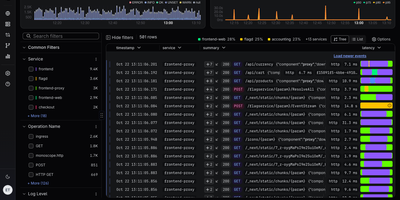
Across logs, traces, and metrics, Monoscope gives engineering teams one self-hosted workspace for finding what broke, asking questions in plain English, and hearing about problems before users do. Start in the Explorer: search events with KQL or an Ask AI prompt, flip between log rows, bar and line charts, log patterns, and sessions, and narrow results with facets for service, level, and HTTP status. Open any span to read its attributes, then follow the full trace across services in a waterfall, timeline, or map view. Live Tail streams new events as they arrive, and the Service Map draws every dependency with its error rate, latency, and requests per second. Build dashboards from widgets with copyable KQL and SQL, then set scheduled monitors with warn and alert thresholds, cron monitors, and uptime checks. An Issues inbox gathers API changes, errors, and log patterns so each one can be acknowledged, archived, or marked as spam, while Reports send scheduled summaries by email. Telemetry arrives over OTLP gRPC on port 4317 from OpenTelemetry SDKs and collectors. The monoscope CLI emits JSON for scripts, and an MCP server at /api/v1/mcp lets Claude, Cursor, and Cline search events and triage issues. Natural-language search uses the OpenAI-compatible model you configure. Running on a dedicated VPS on RepoCloud with guaranteed CPU, RAM, and SSD, full root SSH access, and a browser serial console. AGPL-3.0 licensed.
PriceBuddy
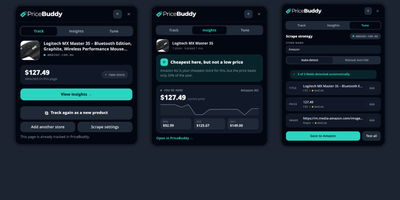
Waiting for the right moment to buy usually means refreshing product pages for weeks, so PriceBuddy does the refreshing for you and speaks up when the price is right. Paste a product URL and it fetches the details and price, then rechecks on a global schedule or a per-product interval from every 5 minutes to every 24 hours. Stores are scraped with CSS selectors, regular expressions, or JSONPath, a headless browser covers JavaScript-heavy shops, and an optional AI provider (OpenAI, Anthropic, Gemini, or local Ollama) can recover missing prices or repair broken selectors. Attach several URLs to one product to compare retailers or marketplace listings, with in-stock, pre-order, and discontinued states shown beside each source. Unit pricing reveals the real cost per tablet or bag when multi-packs distort shelf prices, while history charts show minimum, maximum, and average over time. Alerts fire on a target price, a drop threshold, or a back-in-stock event and arrive by in-app notice, email, Pushover, Gotify, Apprise, Telegram, Discord webhook, or ntfy. Tags sort products into draggable dashboard groups, with optional smart sections for what to buy now, recent drops, and failed checks. Each user keeps separate products and settings, a REST API with scoped tokens serves your scripts, and a Chrome and Edge extension tracks items from the page you are viewing. Running on a dedicated VPS on RepoCloud with guaranteed CPU, RAM, and SSD, full root SSH access, and a browser serial console. GPL-3.0 licensed.
Rootprint
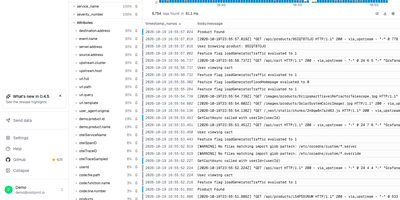
A year of searchable logs and traces no longer needs a metered logging service, because Rootprint keeps the whole index in a storage bucket you already own. A search matches any word on any line, since every log is indexed in full and no service name, stream, or label is needed first. A frequency histogram, one-click field filters, and saved views narrow the results, a fold mode collapses repeated lines, and exports arrive as NDJSON, CSV, or plain text, or as a share link. Open a trace from the log that emitted it, or paste a trace ID, and a waterfall shows per-span timing, attributes, events, and database calls grouped by query, with each span linking back to its logs. The trace explorer charts span volume, error rate, and p50, p95, and p99 latency, ranks the busiest operations, and filters spans by service, duration, and status. Every service gets its own page with request rate, error rate, operations, dependencies, and errors. Data arrives over OpenTelemetry from the Collector, Vector, or Fluent Bit, through a plain HTTP gateway, or by pulling from Kafka, Kinesis, or SQS, with guided setup for nine integrations. Indexes can live in S3, Google Cloud Storage, R2, MinIO, or Azure Blob. Teammates sign in with Google, GitHub, or any OpenID Connect provider, and scoped API keys serve scripts. Running on a dedicated VPS on RepoCloud with guaranteed CPU, RAM, and SSD, full root SSH access, and a browser serial console. Apache-2.0 licensed.
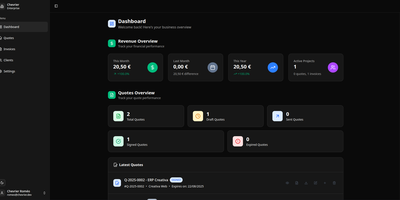
Invoicerr
Invoicerr nails the exact billing sequence freelancers actually use: draft a quote, send it to the client, collect a legally-binding electronic signature via a secure browser link, convert the approved quote into an invoice, and generate a branded PDF — no DocuSign account, no external signing service, no enterprise complexity. The React frontend with NestJS backend uses Prisma ORM with your choice of SQLite for instant local setup or PostgreSQL for production workloads. Quotes and invoices are first-class objects with independent status tracking — unread, sent, viewed, signed for quotes; paid for invoices — not a single form with a label swap. The e-signature system generates secure-token signing links that clients open in their browser to review and sign documents without needing any account or external service. PDF generation renders quotes, invoices, and receipts with your company logo, name, VAT number, colors, and custom email templates so documents reflect your brand identity rather than the software's defaults. Authentication supports JWT tokens or OIDC providers stored in cookies. The REST API backend enables future integrations with mobile and desktop clients. A plugin system with community-made features and outgoing webhooks extends functionality without forking core code. International-friendly with customizable currencies. Deploy with Docker Compose using the prebuilt image from GitHub Container Registry. Running on a dedicated VPS on RepoCloud with guaranteed CPU, RAM, and SSD, full root SSH access, and a browser serial console. AGPL-3.0 licensed.