Jellystat
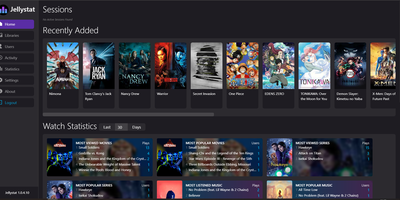
Jellystat is a self-hosted media analytics and live session monitoring dashboard for Jellyfin and Emby servers that turns raw streaming activity into detailed user, library, and playback insights. Media server administrators use the live dashboard to watch active streams in real time, inspecting transcoding status, client devices, bitrates, and playback progress as sessions happen. Every completed or partial stream is logged automatically so you can browse chronological watch histories, filter by library or stream type, and analyze peak concurrent streaming hours across the week. Dedicated library and user views break down total watch duration, play counts, and most popular movies, episodes, or music albums per account. If you already use the official Jellyfin Playback Reporting or Statistics plugins, you can import existing historical records directly into your instance without losing past data. Built-in database backup and restore tools, automatic library synchronization tasks, IP geolocation via MaxMind GeoLite, and interactive Swagger API documentation at the /swagger endpoint round out the administrative toolkit. Running on a dedicated VPS on RepoCloud with guaranteed CPU, RAM, and SSD, full root SSH access, and a browser serial console. MIT licensed.
RankMe
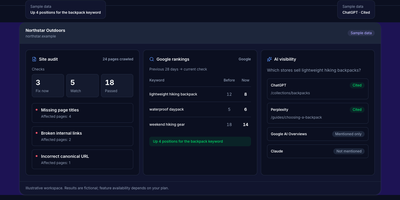
RankMe puts the whole SEO workbench on your own server: audits, rankings, keywords, backlinks, and AI visibility without a per-seat subscription deciding what you may check. Crawl a site and it runs 26 automated checks, returning a plain-language report sorted into Fix now, Watch, and Passed, where each finding names the page, explains in one sentence why it matters, and tells you how to fix it, with an optional AI summary on top. Rank tracking follows Google organic positions over time plus Bing, YouTube, and Amazon, watches SERP features, fires confirmed-drop alerts, and maps local rankings on a geogrid. Keyword research covers volume, difficulty, trends, and SERP-overlap clustering, while Search Console data feeds cannibalization reports and connects to GA4, PageSpeed Insights, and CrUX for performance context. Backlink profiles, link-gap analysis, toxic-link review, and competitor discovery show who links to rivals and which content earns it. A dedicated AI visibility module tracks prompts in AI Overviews and LLM answers and measures share of voice in a weekly digest. Agencies get PDF and CSV exports, scheduled white-label client reports, read-only share links, a REST API, and an MCP server, with alerts delivered by email, Slack, or signed webhook across seven interface languages. Running on a dedicated VPS on RepoCloud with guaranteed CPU, RAM, and SSD, full root SSH access, and a browser serial console. AGPL-3.0 licensed.
Open DroneLog
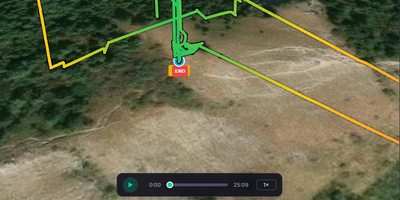
Every DJI and Litchi flight you have ever logged becomes a searchable dashboard on your own server with Open DroneLog, a free, open-source alternative to DroneLogbook, Airdata UAV, and Flight Reader. Drop in DJI .txt logs, Litchi CSV files, or Airdata CSV exports and units are detected automatically, while deduplication on drone serial, battery serial, and start time lets you re-import a folder without duplicate flights. Each flight opens as a 3D terrain map with satellite, topographic, and OpenStreetMap layers, then replays from 0.5x to 16x speed with live telemetry and an RC joystick overlay. Synchronized charts plot height, speed, battery cell voltages, attitude, RC signal, GPS, and distance to home, with drag-to-zoom. Filters narrow flights by date, drone, battery, controller, duration, altitude, distance, tag, or map area, and automatic tags such as Night Flight and Low Battery arrive with offline reverse-geocoded locations. The overview dashboard adds an activity heatmap, per-drone and per-battery charts, and a cluster map. Battery health bars track cycle counts and capacity history, and maintenance thresholds show as color-coded progress bars. Export flights as CSV, JSON, GPX, or KML, build printable HTML flight reports that save as PDF, or generate a FlyCard image for social media. A sync folder imports new logs automatically, pilot profiles can sit behind passwords, and full-database backup and restore moves data between desktop and Docker. Running on a dedicated VPS on RepoCloud with guaranteed CPU, RAM, and SSD, full root SSH access, and a browser serial console. AGPL-3.0 licensed.
Limelit Open
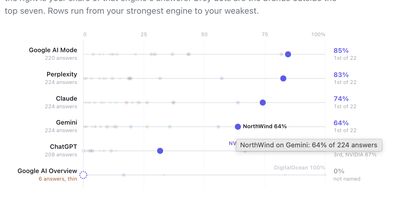
When a buyer asks ChatGPT, Claude, or Perplexity which product to choose, Limelit Open shows whether your brand appears in the answer, where it ranks, and which sources the engines trusted. You define the prompts your market actually asks, register your competitors, and the tracker runs every prompt against seven engines on a schedule you control: ChatGPT, Claude, Perplexity, and Gemini through vendor APIs with web search on, plus Google AI Overviews, Google AI Mode, and Bing Copilot through scraper providers, each result labeled by how it was collected. Every stored answer is searched for your brand and each competitor with the rank of the list item they appear in, so visibility, share of voice, average position, and citation share rest on readable evidence rather than a black-box score. Click any number and you land on the full answer text with matches highlighted, the searches the engine ran, the brands it named, and every cited URL classified as yours, a competitor's, social, informational, or other. A prompt by engine grid makes weak spots obvious, and the built-in MCP server lets Claude or another assistant query the same data in plain language. Runs are capped by a daily ceiling you set, prompts and answers live in one SQLite file, and a single export command dumps the whole instance as JSON or CSVs for your own reporting. Running on a dedicated VPS on RepoCloud with guaranteed CPU, RAM, and SSD, full root SSH access, and a browser serial console. Apache-2.0 licensed.

BrightBean Studio
BrightBean Studio provides an open-source social media management suite that centralizes multi-account publishing, visual calendar scheduling, idea tracking, and cross-channel analytics into a unified self-hosted dashboard. Content creators and marketing agencies draft cross-network posts within an interactive composer that provides real-time channel previews and custom caption overrides for individual networks. The visual drag-and-drop calendar maps publishing queues across recurring weekly time slots, while an integrated Kanban board organizes brainstorming concepts from unassigned ideation to production-ready schedules. Community managers monitor unified social inboxes aggregating direct messages, mentions, and comments across Facebook, Instagram, LinkedIn, YouTube, TikTok, Bluesky, Threads, Pinterest, and Mastodon. Team leads configure multi-tier approval workflows with threaded editorial comments and issue passwordless 30-day magic links so external clients can approve drafts without registration. Built-in performance dashboards aggregate engagement rates, follower growth curves, and watch time metrics directly from native network APIs without relying on third-party data aggregators. Running on a dedicated VPS on RepoCloud with guaranteed CPU, RAM, and SSD, full root SSH access, and a browser serial console. AGPL-3.0 licensed.
JellyGlance
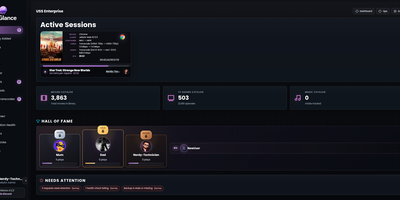
Running a Jellyfin or Emby server usually means a dozen open tabs; JellyGlance folds your whole media server into one screen you can leave open on a wall. Live sessions show who is watching what, from where, on which client, with direct play or transcode state, codec, bitrate, subtitles, and progress for every stream. Playback history accumulates in its own database, so statistics survive even when the media server forgets: top movies, series, libraries, clients, and users, watch-time trends, activity heatmaps, and weekly, monthly, and yearly recaps rendered as shareable cards. The home dashboard arranges by drag and drop, with presets, density controls, themes, kiosk mode for a wall display, and alert rules. Recently added shelves group by library, while library views surface totals and metadata gaps. Jellyseerr and Overseerr requests appear with poster cards, requester context, and admin actions, and the release calendar pulls upcoming titles from your *arr apps beside the queues of your torrent and Usenet clients, stalled items included. Wizarr invites, Tdarr transcodes, and Maintainerr cleanup connect from the same integrations area. Notifications travel by webhook, Discord, Gotify, and email newsletters, backups export to a plain folder, and sign-in spans local accounts, Jellyfin Quick Connect, and OIDC. Running on a dedicated VPS on RepoCloud with guaranteed CPU, RAM, and SSD, full root SSH access, and a browser serial console. MIT licensed.
AgentsView
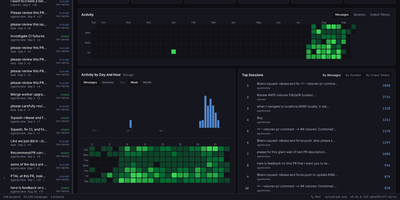
Software developers running Claude Code, Cursor, Codex, and Aider use AgentsView to trace token expenditures, search full session transcripts, and analyze multi-agent concurrency timelines. Engineers can search through historical developer sessions to locate specific code modifications, prompt chains, or debugging rationales across extensive programming workflows. The real-time activity timeline visualizes concurrent agent operations, revealing peak execution windows, task run durations, and automated tool invocations. The usage analytics engine calculates financial costs and token volumes per model by applying live pricing tables while accounting for prompt caching read discounts. Developers inspect granular turn-by-turn session transcripts complete with raw model payloads, file difference diffs, executed shell commands, and syntax errors. The recall browser extracts key technical context from past programming sessions, organizing facts into an indexed reference knowledge corpus for reuse across future project tasks. Administrators can replicate SQLite session tables into DuckDB analytics files or PostgreSQL warehouses to query longitudinal metrics using SQL analytical tools or custom reporting scripts. Running on a dedicated VPS on RepoCloud with guaranteed CPU, RAM, and SSD, full root SSH access, and a browser serial console. MIT licensed.
Shaper
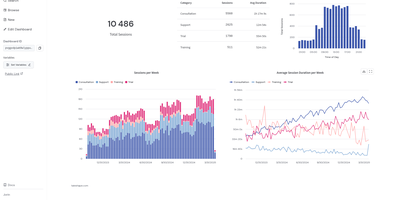
Write standard SQL queries and watch Shaper turn them into interactive dashboards, scheduled reports, and customer-facing analytics widgets without maintaining a heavy business intelligence stack. Every query maps directly to a visual component through simple type casts like BARCHART, LINECHART, GAUGE, BOXPLOT, or DROPDOWN. Analysts can attach external PostgreSQL and MySQL databases, read Parquet, CSV, JSON, and Excel files straight from S3 object storage, or stream live events into the HTTP ingest API. Interactive filter controls let viewers slice metrics by date ranges, multi-select dropdowns, and dynamic parameter variables that automatically re-evaluate downstream charts. Teams version-control their entire reporting layer as plain SQL files in Git, making dashboard updates auditable in pull requests and simple for AI coding assistants to generate. Product engineers embed white-labeled analytics directly into customer web apps without iframes, issuing per-tenant JWT tokens to enforce row-level data isolation. Need scheduled deliverables for stakeholders? Configure SQL-driven background tasks that transform datasets on a cron schedule, send threshold alerts to Slack or Microsoft Teams, and generate downloadable PDF, PNG, Excel, or CSV reports. External collaborators can also view live metrics through password-protected sharing links. Running on a dedicated VPS on RepoCloud with guaranteed CPU, RAM, and SSD, full root SSH access, and a browser serial console. MPL-2.0 licensed.
Streamystats
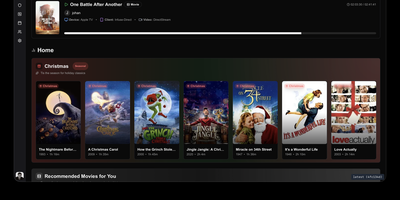
To uncover deep viewing insights and AI-powered content recommendations across your self-hosted Jellyfin media server, Streamystats delivers a comprehensive analytics and watch-history platform. Once connected to one or more Jellyfin instances using native MediaBrowser authentication, the dashboard tracks live playback sessions, per-user watch durations, device and client breakdowns, and library-wide growth metrics without requiring third-party reporting plugins. You can import existing historical logs from Jellystat or the Playback Reporting plugin so years of viewing habits carry over immediately, then explore interactive watch-time graphs, genre radar charts, actor and director leaderboards, and a yearly Wrapped summary. When you enable vector embeddings through OpenAI, OpenRouter, Google Gemini, Voyage AI, or a local Ollama model, the recommendation engine calculates cosine similarity against your watch history and explains exactly which watched movies or series inspired each suggestion. An integrated AI chat assistant equipped with thirteen specialized function-calling tools lets you search your catalog semantically, ask natural-language questions about your viewing statistics, and generate shared movie recommendations for multiple household members at once. Administrators can also mark titles as watched or unwatched with automatic watch-time inference, manage watchlists over an external API, and connect Janitorr for automated media cleanup. Running on a dedicated VPS on RepoCloud with guaranteed CPU, RAM, and SSD, full root SSH access, and a browser serial console. MIT licensed.
MySpeed
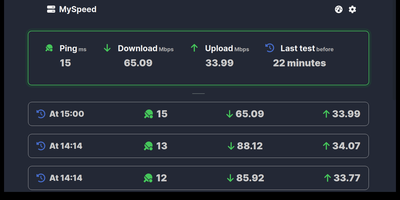
Holding internet service providers accountable for promised bandwidth requires continuous, automated measurement, and MySpeed turns any server into an always-on connection performance analyzer that tracks download speeds, upload throughput, ping latency, and jitter around the clock. Instead of running manual browser tests only when video calls stutter, you can schedule recurring speed checks using custom Cron expressions and switch freely between Ookla, LibreSpeed, and Cloudflare testing servers to verify routing performance across different upstream networks. Interactive statistics views render gradient speed timelines, ping and jitter graphs, hourly performance breakdowns that expose peak-hour congestion, and standard deviation consistency charts, using smart 300-bucket downsampling so multi-month histories load instantaneously. Failed tests are flagged with visual markers on the timeline, while built-in health checks dispatch instant alerts to Discord, Telegram, Signal, WhatsApp, Gotify, email, or custom webhooks whenever bandwidth drops below your target thresholds or outages occur. Administrators can link multiple remote MySpeed instances into a single dashboard to compare bandwidth across branch offices, pause scheduled runs during heavy file transfers, export historical logs, and scrape real-time telemetry into Prometheus and Grafana. Running on a dedicated VPS on RepoCloud with guaranteed CPU, RAM, and SSD, full root SSH access, and a browser serial console. MIT licensed.
Vince
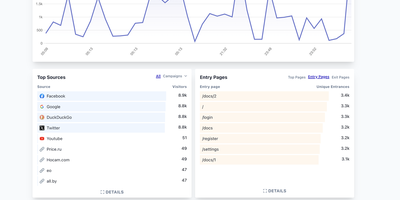
Own every visitor metric without cookies, consent banners, or external database clusters through Vince, a self-hosted web analytics platform engineered for fast multi-site traffic intelligence. Zero cookies. Sub-kilobyte tracking script. Unlimited domains and events. You can point existing Plausible Analytics tracker snippets directly at your instance and immediately begin recording unique visitors, total sessions, pageviews, views per visit, bounce rates, and visit durations across all of your properties. Interactive dashboards break down incoming traffic by referral sources, UTM campaign parameters, entry and exit pages, countries, regions, cities, device categories, browsers, and operating systems. Behavior analytics go beyond simple pageviews by capturing outbound link clicks, file downloads, 404 error pages, pageview goals, and custom event conversions with custom properties. Period-over-period comparisons let you benchmark current traffic and conversion rates against previous date ranges or custom calendar intervals with a single click. Dashboards stay private by default, but you can open public stats views or generate unique, optionally password-protected shared links for clients and stakeholders, as well as query metrics programmatically over the REST API. Running on a dedicated VPS on RepoCloud with guaranteed CPU, RAM, and SSD, full root SSH access, and a browser serial console. AGPL-3.0 licensed.
Your Spotify
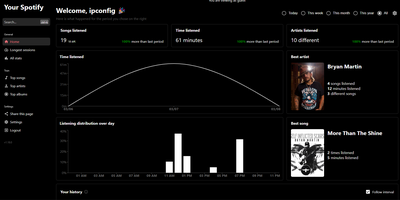
To explore years of personal music streaming habits without waiting for an annual year-end summary, Your Spotify continuously tracks your listening history and presents it inside a private analytics dashboard. Music enthusiasts use the interface to inspect daily, weekly, monthly, and custom date-range breakdowns of their most played tracks, top artists, favorite albums, and total listening duration. Listeners who want their complete historical archive from day one can upload official Spotify privacy data exports, including both past-year StreamingHistory JSON files and multi-year Extended Streaming History archives, directly through the settings panel. Friends and family sharing an instance can use the collaborative affinity view to compare overlapping listening habits across multiple accounts in intersection or union mode. From any historical table, top-tracks ranking, or multi-user affinity comparison, you can generate new playlists directly inside your Spotify account or trigger track playback on active devices. Administrators can manage user registrations, generate shareable public guest tokens for read-only dashboard access, blacklist specific artists from skewing statistics, and expose ingestion metrics to Prometheus. Running on a dedicated VPS on RepoCloud with guaranteed CPU, RAM, and SSD, full root SSH access, and a browser serial console. GPL-3.0 licensed.
Movary
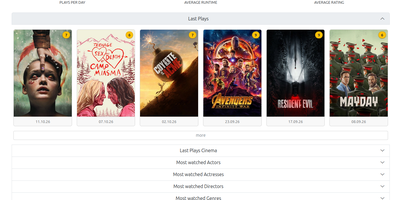
Catalog, rate, and analyze every film you watch with Movary, a self-hosted movie tracking hub and personal cinema diary that replaces Letterboxd and Trakt. Each time a movie finishes playing on Plex, Jellyfin, Emby, or Kodi, automated webhook scrobblers record the viewing session and star rating directly into your timeline without manual logging. You can also bring over years of existing watch history by importing exports from Letterboxd, Trakt, or Netflix, and automatically cross-post newly logged reviews and ratings to Mastodon or feed Watchlist additions straight into Radarr. Customizing your personal dashboard lets you rearrange analytical widgets that break down your viewing habits by most-watched actors, directors, genres, original languages, release decades, and custom watch locations like local cinemas or home theaters. Movie metadata, posters, and ratings pulled from TMDB and IMDb are cached locally on your server, while built-in background job schedules keep artwork and cast details refreshed automatically. Multi-user account controls, TOTP two-factor authentication, granular profile visibility settings, and personal Bearer API tokens make it easy to run a private household log or a shared film club server. Running on a dedicated VPS on RepoCloud with guaranteed CPU, RAM, and SSD, full root SSH access, and a browser serial console. MIT licensed.
Offen
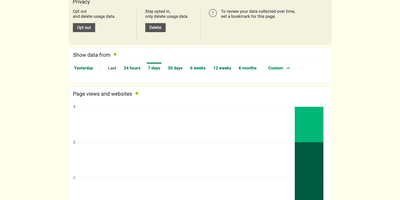
Analytics usually starts by watching people who never agreed to be watched; Offen flips that order, collecting nothing until a visitor actively opts in, and then showing that visitor exactly what was recorded. Paste the tracking snippet into your pages and the Auditorium reports the metrics that actually guide decisions: unique users and sessions, page views in real time, top pages, landing and exit pages, referrers, locations, UTM parameters, and weekly retention. Every visitor gets the same interface pointed at their own footprint, where they can review each recorded visit, opt out at any moment, or delete their stored data outright. Records are encrypted end to end, user data expires automatically after six months, and first-party cookies keep the tool inside GDPR-friendly territory without third parties touching the stream. One installation tracks several websites, accounts can be shared with a team, and the consent banner adapts its colors and shape to your site design. The interface and banner speak English, French, German, Portuguese, Spanish, and Vietnamese. Running on a dedicated VPS on RepoCloud with guaranteed CPU, RAM, and SSD, full root SSH access, and a browser serial console. Apache-2.0 licensed.