Stars
Forks
Watchers
Developer links
Shaper
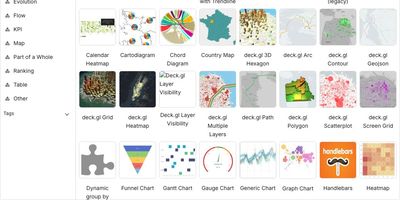
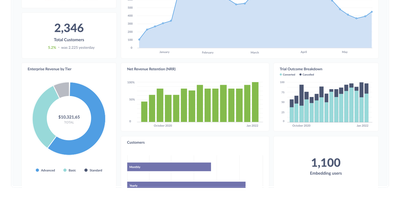
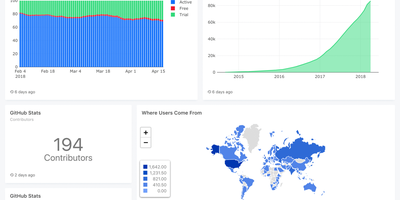
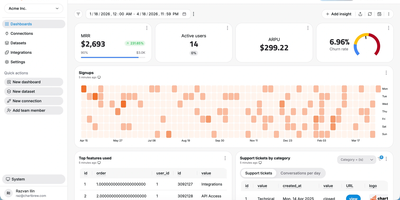
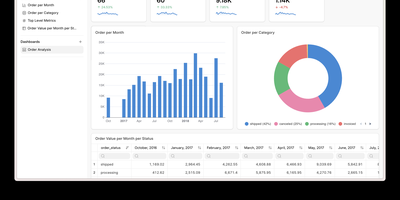
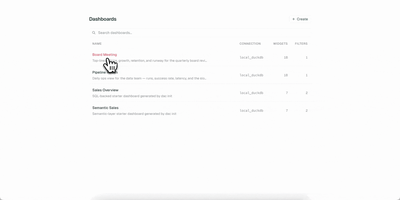
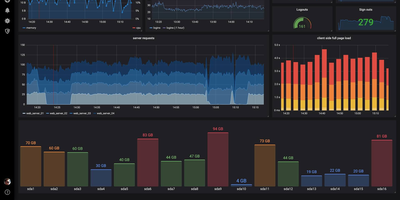
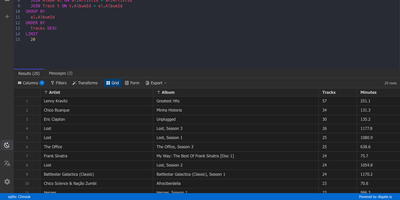
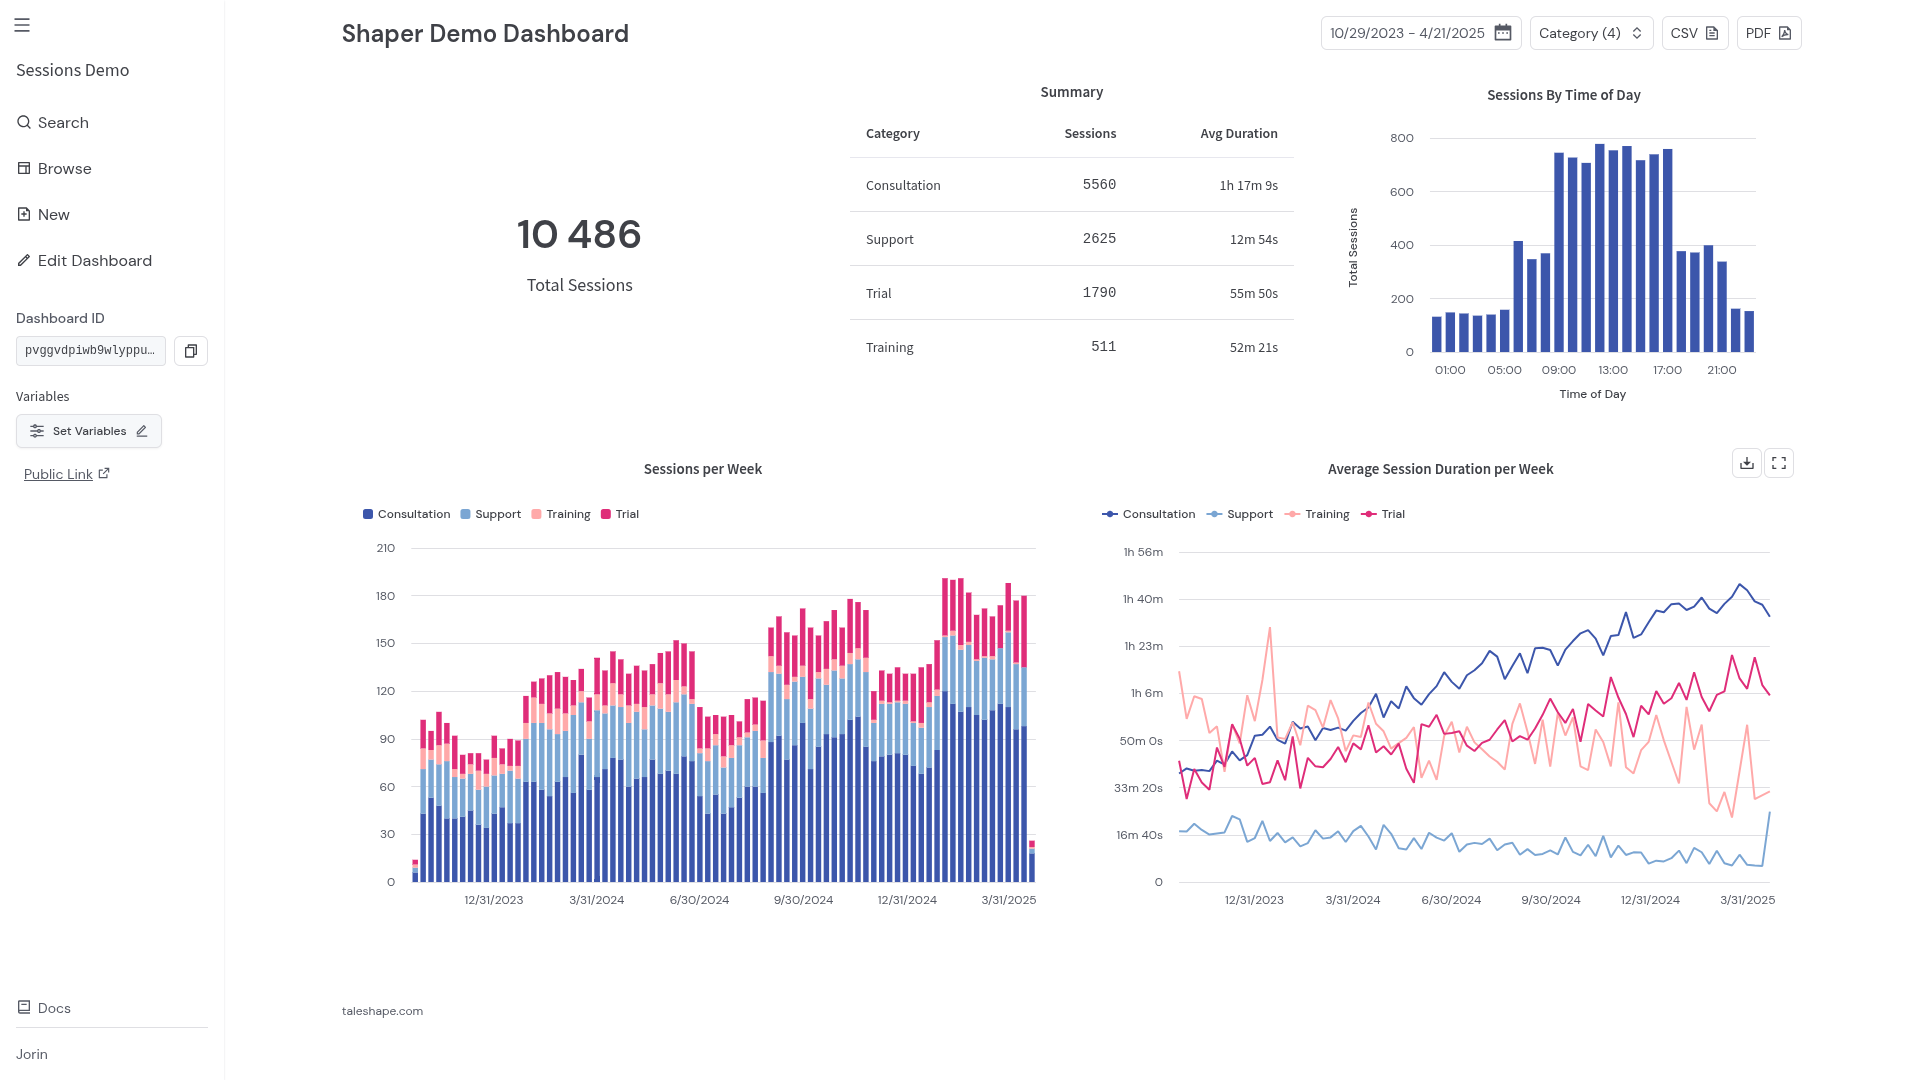
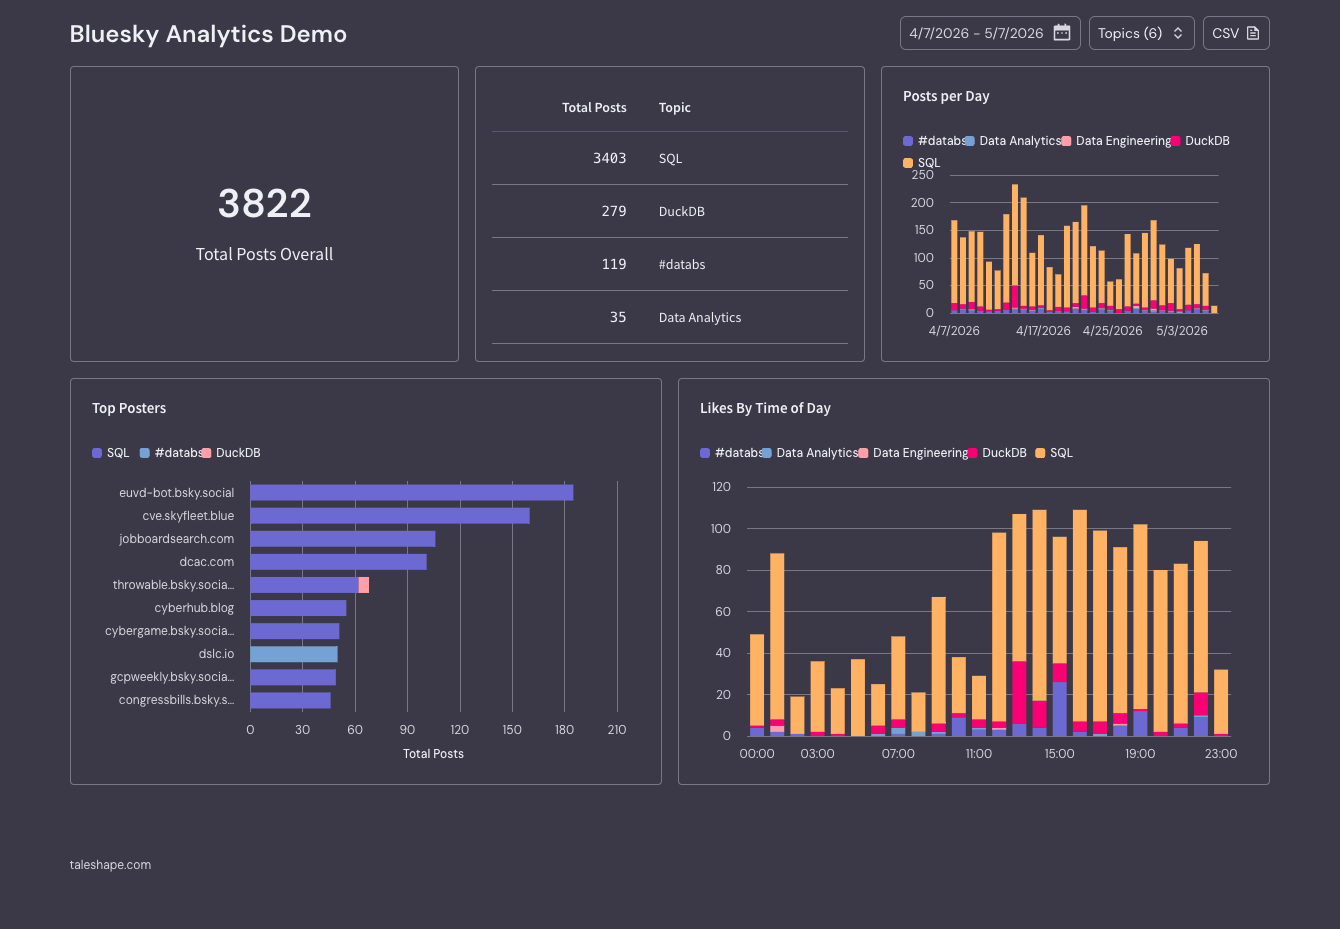
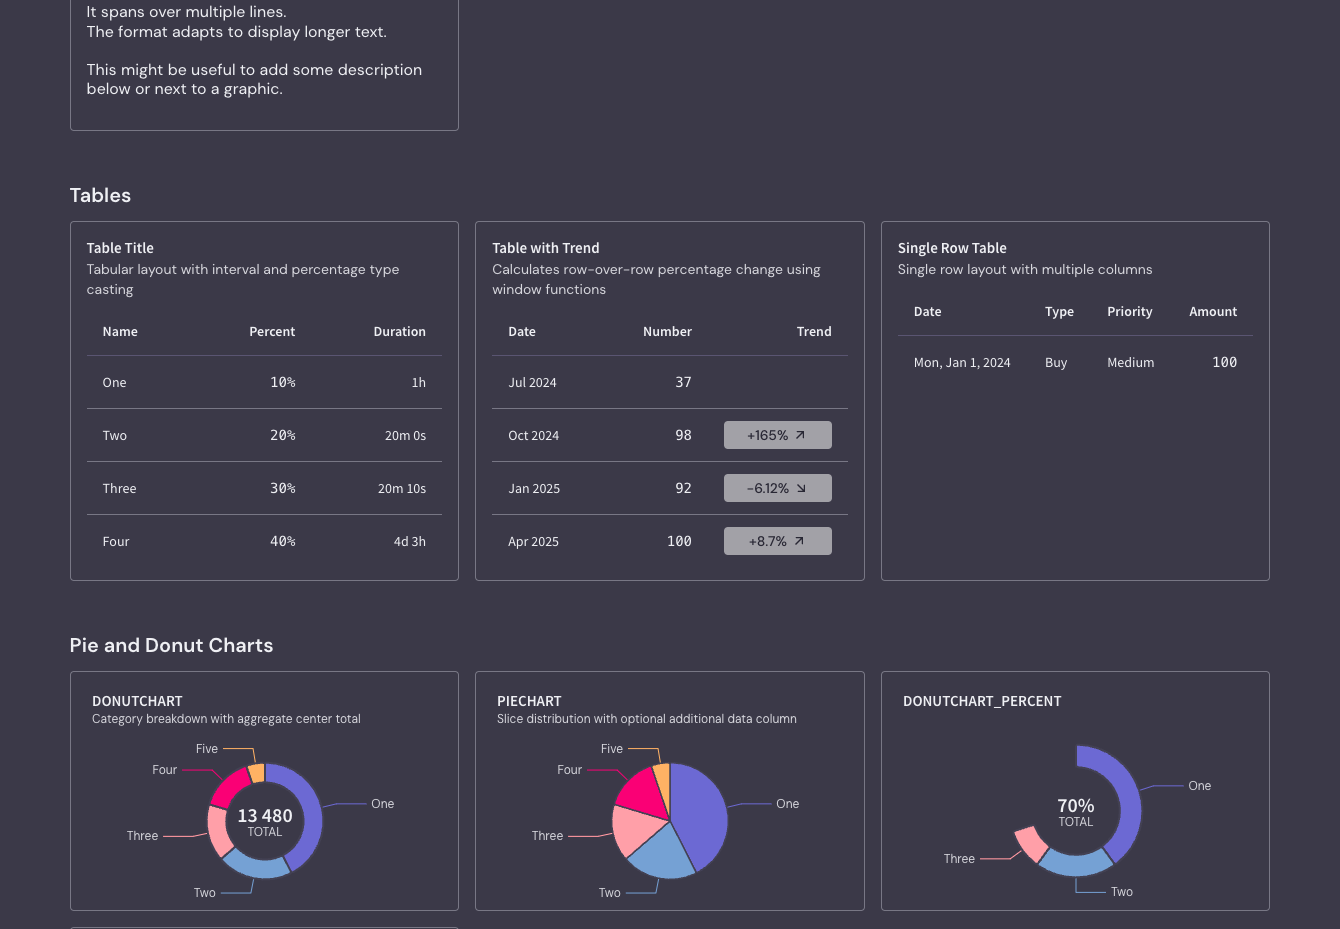
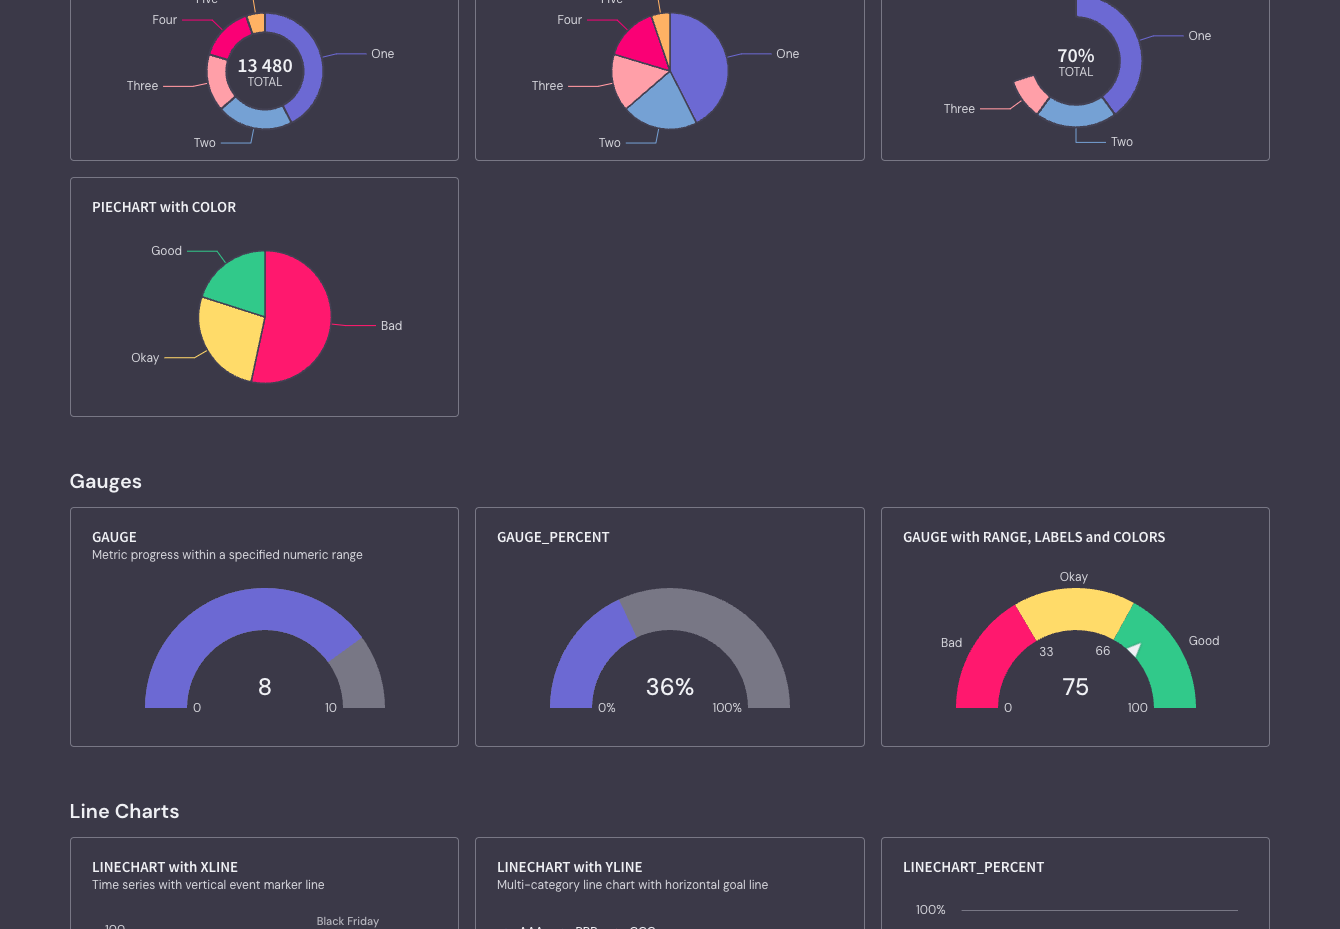
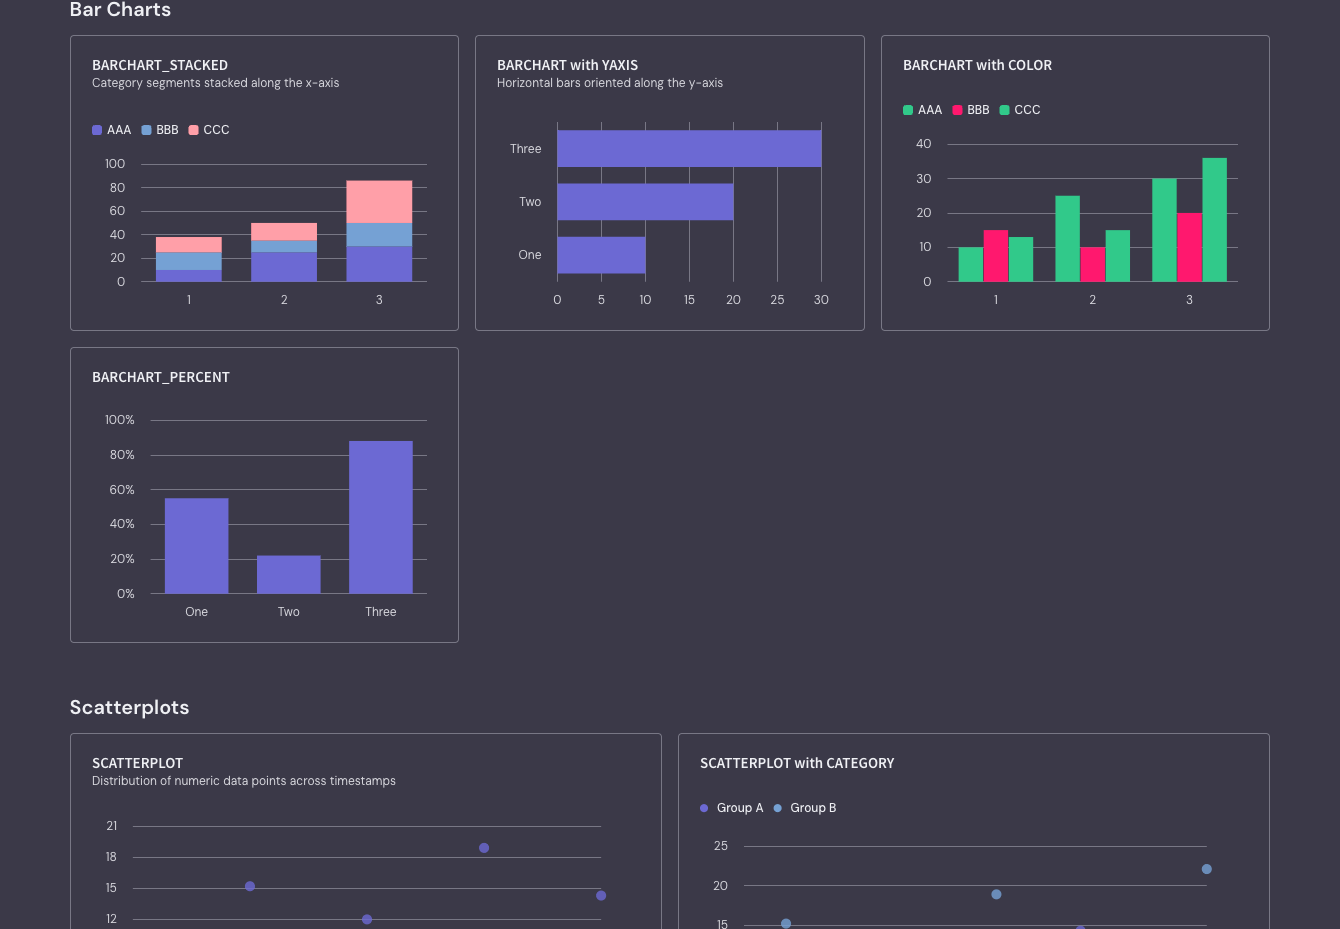
Write standard SQL queries and watch Shaper turn them into interactive dashboards, scheduled reports, and customer-facing analytics widgets without maintaining a heavy business intelligence stack. Every query maps directly to a visual component through simple type casts like BARCHART, LINECHART, GAUGE, BOXPLOT, or DROPDOWN. Analysts can attach external PostgreSQL and MySQL databases, read Parquet, CSV, JSON, and Excel files straight from S3 object storage, or stream live events into the HTTP ingest API. Interactive filter controls let viewers slice metrics by date ranges, multi-select dropdowns, and dynamic parameter variables that automatically re-evaluate downstream charts. Teams version-control their entire reporting layer as plain SQL files in Git, making dashboard updates auditable in pull requests and simple for AI coding assistants to generate. Product engineers embed white-labeled analytics directly into customer web apps without iframes, issuing per-tenant JWT tokens to enforce row-level data isolation. Need scheduled deliverables for stakeholders? Configure SQL-driven background tasks that transform datasets on a cron schedule, send threshold alerts to Slack or Microsoft Teams, and generate downloadable PDF, PNG, Excel, or CSV reports. External collaborators can also view live metrics through password-protected sharing links. Running on a dedicated VPS on RepoCloud with guaranteed CPU, RAM, and SSD, full root SSH access, and a browser serial console. MPL-2.0 licensed.
Benefits
- Pure SQL BI-as-Code Workflow
- Author charts, KPI cards, interactive filters, and section layouts using standard DuckDB SQL casts that live in Git repositories for pull-request review and AI agent generation.
- Iframe-Free Customer Embedded Analytics
- Mount white-labeled dashboards natively inside web applications using JavaScript and React SDKs while enforcing multi-tenant row-level security through signed per-user JWT access tokens.
- Unified Multi-Source Query Engine
- Query across attached PostgreSQL and MySQL databases, S3 Parquet lakes, Google Sheets, and local DuckDB tables in a single analytical query without external ETL pipelines.
- Automated Exports and Scheduled Alerts
- Generate one-click CSV, Excel, JSON, PNG, and PDF downloads directly from dashboard queries or schedule recurring SQL tasks that push alerts to Slack and Teams.
Features
- Custom SQL Visualization Casts
- Render stacked bar charts, line graphs, gauges, boxplots, KPI comparison cards, and trend tables by casting DuckDB SQL columns with ::BARCHART, ::LINECHART, or ::TREND.
- Interactive Filter Controls
- Add date pickers, date range selectors, single dropdowns, and multi-select menus via SQL queries that dynamically bind user selections into downstream analytical queries.
- Native JS and React SDKs
- Embed interactive dashboards directly into host applications without iframes, supporting custom CSS theming, white-label branding, and JWT-based tenant parameterization.
- HTTP Data Ingest API
- Stream real-time event payloads over HTTP into embedded DuckDB storage with automatic schema inference alongside scheduled SQL transformation jobs.
- Multi-Format Report Generation
- Export query results and full dashboard views as downloadable CSV, XLSX, JSON, PNG, or formatted PDF files and share live views via password-protected URLs.