Homelable
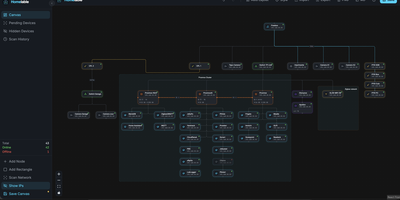
Homelable turns your entire homelab into a live, interactive network canvas where every device, link, and service shows its real-time status at a glance. Run an nmap-powered network scan against your subnets and the tool fingerprints services, queues unknown devices for review, and drops approved hosts onto a drag-and-drop canvas with 15 native node types covering routers, switches, hypervisors, NAS boxes, IoT sensors, and more. Import your full Zigbee2MQTT mesh (controllers, routers, end devices with link quality indicators) and Z-Wave JS device trees in one click, preserving the actual RF topology without manual wiring. Proxmox integration pulls in hosts, VMs, and LXC containers so you can nest virtual machines inside their parent hypervisor node on the canvas. The Rack Canvas mode documents the physical side of your lab: create racks with configurable U-height, mount gear into slots, and patch ports across devices to track your cabling. Health checks run every 60 seconds using ping, HTTP, HTTPS, TCP, SSH, or Prometheus scrape endpoints, with WebSocket push delivering green, red, or pending status pulses directly to the canvas. Split your infrastructure across multiple canvases organized by site, rack, or purpose, and share a read-only Live View URL with anyone on your network. A built-in Model Context Protocol server lets AI assistants like Claude query and modify your topology through natural language. Deploy on a dedicated VPS on RepoCloud with guaranteed CPU, RAM, and SSD, full root SSH access, and a browser serial console. MIT licensed.
Komodo
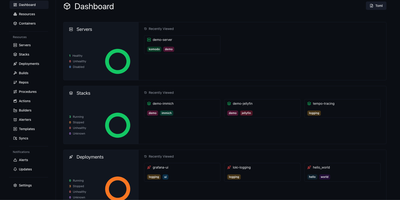
Komodo puts every server, container, and deployment pipeline behind a single dashboard where you build, ship, and monitor Docker workloads across unlimited hosts. Lightweight stateless agents install on each connected server and report CPU, memory, and disk metrics back to the Rust-powered core, giving you real-time visibility without heavyweight monitoring stacks. Docker Compose stacks deploy directly from the UI or link to Git repositories with webhook-triggered automatic redeploys on push. A built-in CI pipeline compiles versioned Docker images from source, with optional AWS spot instances for burst build capacity. For orchestration at scale, Docker Swarm management handles node configuration, service deployment, and multi-node stack orchestration from the same control plane. Browser terminal sessions open persistent named shells on servers and inside containers, complete with shared team access and scriptable Actions that chain executions into multi-stage procedures. Infrastructure-as-code support defines all resources declaratively in TOML files within a Git repository, keeping production state version-controlled and auditable. Granular role-based access control with user groups, per-resource permissions, and OAuth through GitHub and Google keeps teams operating within defined boundaries. A full OpenAPI specification, dedicated CLI, and typesafe client libraries for Rust and TypeScript make programmatic integration straightforward. With 12,000+ stars and active development, the community continues expanding multi-architecture builds and Swarm tooling.
Drydock
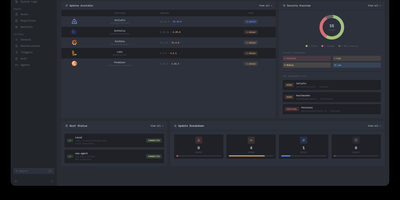
Deploying container updates without blind surprises is what Drydock delivers through a monitor-first inspection plane that evaluates image registries, scans CVE vulnerabilities, and automates rollbacks across distributed Docker infrastructure. Systems engineers track container fleets across twenty-three public and private registries including Docker Hub, GitHub Container Registry, Harbor, and Quay using cursor-based pagination and semver classification. The integrated Update Bouncer runs Trivy and Grype static scanners against incoming candidate layers, blocking deployments that fail configurable CVE severity policies while verifying cryptographic signatures through cosign. Operators configure declarative update schedules with stabilization countdown gates that hold back brand-new releases until defined burn-in periods elapse. When updates execute, Drydock creates pre-upgrade container snapshots and evaluates post-launch container health checks, instantly restoring previous image digests and network configs if failures occur. Distributed Portwing edge agents stream live container output and system logs over encrypted WebSockets, allowing central consoles to coordinate remote daemon updates without opening inbound host firewall ports. Automated event triggers dispatch granular notifications and update payloads across seventeen communication channels including Slack, Discord, Telegram, and Home Assistant MQTT brokers. Running on a dedicated VPS on RepoCloud with guaranteed CPU, RAM, and SSD, full root SSH access, and a browser serial console. AGPL-3.0 licensed.
Tianji
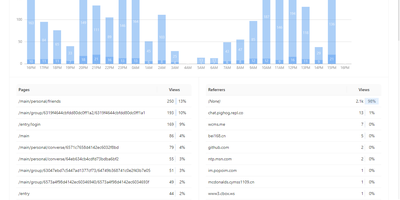
Website analytics, uptime monitoring, and server status - three tools most teams run separately - combined in Tianji, an open-source observability platform. The analytics layer tracks page views, unique visitors, referrers, and UTM parameters with a lightweight cookie-less script, which keeps collection GDPR and CCPA friendly. The uptime monitor checks availability and latency on configurable intervals, accepts passively reported results, and publishes public status pages for incident communication. Server status agents report CPU, memory, disk, and network metrics with threshold-based alerts, and notifications route through webhooks, Slack, Telegram, and other channels with noise control. It also includes anonymous telemetry for tracking deployments of your own open-source projects, surveys, waitlists, team collaboration, and an OpenAPI interface for integrations and exports. The consolidation is the point: traffic analytics, uptime checks, and server metrics share one interface and one alerting layer, so diagnosing an incident does not mean hopping between Google Analytics, Uptime Kuma, and Prometheus - and the built-in public status pages replace a separate paid Statuspage-style subscription. Because collection uses no cookies with IP truncation and aggregation by default, basic traffic measurement requires no consent banner. Built in TypeScript under the Apache 2.0 license and inspired by Umami and Uptime Kuma, it is deliberately right-sized for independent developers and small SaaS teams whose monitoring needs are real but lightweight.
Checkmate
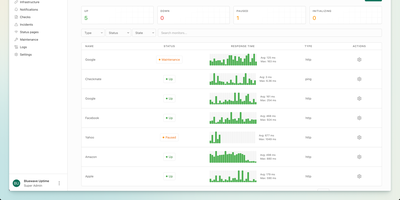
With 10,400 GitHub stars, 153 contributors, and no per-monitor pricing to worry about, Checkmate delivers comprehensive infrastructure monitoring from a single self-hosted dashboard — tracking uptime, page speed, server hardware, Docker containers, and even game servers without sending a byte of telemetry off your network. Ten monitor types cover HTTP, ping, TCP, gRPC, WebSocket, DNS, SSL certificate expiry, Docker container health, Lighthouse page speed with Core Web Vitals tracking, and game server status for over 100 server types including Minecraft and CS2. The Globalping integration enables geo-distributed monitoring from six continents, running ping and HTTP checks from Africa, Asia, Europe, North America, South America, and Oceania with results plotted on an interactive map. The optional Capture agent written in Go collects CPU, RAM, disk usage, temperature, and network metrics from any Linux, Windows, Mac, or Raspberry Pi host. Public status pages ship with four built-in themes and custom branding support, showing per-service uptime bars and incident history on a single shareable URL. Alert notifications reach teams through email, Discord, Slack, PagerDuty, Microsoft Teams, Telegram, Matrix, ntfy, Twilio SMS, and webhooks. Deploy via a single Docker Compose file requiring roughly 1 GB RAM — up and running in under five minutes on any Docker host. Running on a dedicated VPS on RepoCloud with guaranteed CPU, RAM, and SSD, full root SSH access, and a browser serial console. AGPLv3 licensed.
Sencho
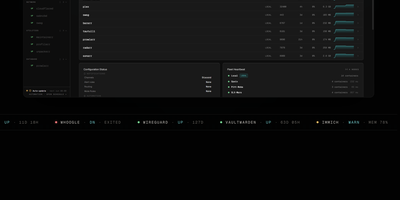
With over 430 GitHub stars and designed for DevOps engineers, platform teams, and homelab operators, Sencho is the self-hosted Docker Compose control plane that gives you a real operational cockpit without abandoning file-on-disk compose workflows. The web dashboard provides live CPU, memory, and disk sparklines per container, one-click start/stop/restart controls, and a Monaco-powered YAML editor with syntax highlighting, inline diff, and one-click rollback. Compose files remain the source of truth on the host filesystem. Multi-node management connects remote Sencho instances via authenticated HTTP and WebSocket proxy using long-lived API tokens, with no SSH access or exposed Docker sockets required. The Pilot Agent establishes an outbound-only WebSocket tunnel for nodes behind NAT, CGNAT, or strict firewalls. Blueprints define compose intent once and deploy it across label-targeted nodes, with drift detection keeping the fleet aligned. Fleet Federation provides cordon and pin controls for maintenance windows, while Fleet Actions execute bulk deploy, stop, and restart operations by stack label across the entire infrastructure. The security suite includes Trivy vulnerability scanning, deploy enforcement policies, SARIF and SBOM export, and Fleet Sync to replicate scan policies across replicas. Additional capabilities include 199+ one-click app templates, Git source integration, atomic deploys with auto-rollback, auto-heal, scheduled operations, webhooks, and custom S3 off-site backups to MinIO, R2, B2, or AWS. Running on a dedicated VPS on RepoCloud with guaranteed CPU, RAM, and SSD, full root SSH access, and a browser serial console. AGPL-3.0 licensed.
OctoPrint
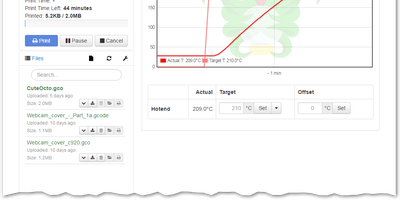
Over a million active instances make OctoPrint the standard web interface for consumer 3D printers - Gina Häußge's Python application, the center of the printing world since 2012. It talks to your printer over USB serial and turns every browser into a control panel: upload, organize, and start G-code prints; watch hotend and bed temperature graphs in real time; drive the print head manually; adjust feed rate, flow, and fan speed mid-print; and hit an emergency stop if things go wrong. The G-code visualizer renders the current layer in sync with the job, and a connected webcam adds a live feed plus automatic timelapse recording of every build. What keeps OctoPrint ahead is its plugin ecosystem - 300+ community plugins installable from the built-in manager. Highlights include Obico's AI spaghetti detection that pauses failed prints automatically, OctoEverywhere for tunnel-based remote access, Bed Level Visualizer's 3D mesh of your bed surface, PrintTimeGenius for accurate time estimates, Exclude Region to abandon one failed object mid-print while others continue, and Firmware Updater to flash Marlin or Klipper without SD-card shuffling. Event hooks fire notifications when prints finish or fail, and a full REST API supports slicer integration and custom automation. AGPL-licensed.
Aptabase
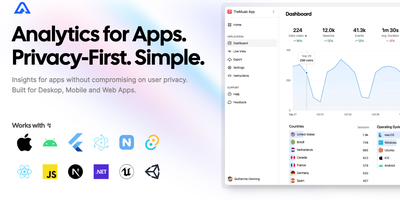
Web analytics tools ignore native mobile, desktop, and game apps; Aptabase was built for exactly those. If Firebase Analytics would force a privacy-policy footnote you don't want to write, this is the alternative - session-based metrics with no cookies, no IDFA or GAID, no device fingerprinting, and a daily-rotated salt that makes cross-day re-identification mathematically impossible. That design means GDPR, CCPA, and PECR compliance out of the box and "Data Not Collected" App Store privacy labels without ATT prompts. The SDK coverage is the widest in its category: eleven first-party libraries spanning Swift, Kotlin, Flutter, React Native, Tauri, Electron, .NET MAUI, NativeScript, Unity, Unreal Engine, and JavaScript for web - each MIT-licensed, following platform conventions, and accepting a custom host parameter that points at your instance. Integration is minutes: initialize with an app key, call trackEvent with optional properties, and the dashboard shows sessions, events, app versions, OS breakdowns, and country-level geography. The self-hosted stack is a .NET server over PostgreSQL for metadata and ClickHouse for high-volume event ingestion, giving cloud-parity features under an AGPL license. For indie iOS/Android apps, Electron and Tauri tools, and Unity or Unreal games, it replaces Firebase without the Google entanglement.
xyOps
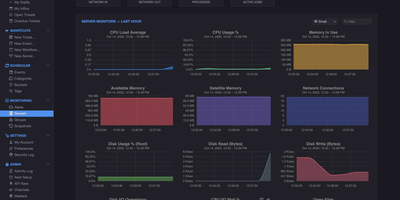
With 4,500+ GitHub stars and version 1.0.92 released August 2026, xyOps delivers a complete operations platform that unifies workflow automation, job scheduling, server monitoring, alerting, and incident response in one self-hosted system. The platform uses a distributed architecture where a central conductor coordinates lightweight xySat satellite agents running on Linux, macOS, or Windows worker nodes via persistent WebSocket connections. The visual workflow builder lets you chain events, triggers, actions, and monitors into multi-step pipelines with conditional logic, fan-out/fan-in parallelism, multiplex controllers for fleet-wide execution, and configurable resource limits. QuickMon provides per-second CPU, memory, disk, and network visibility streamed live to the web UI, while user-defined monitor plugins sample metrics every minute with time-series storage at hourly, daily, monthly, and yearly resolutions. Alert triggers evaluate expressions against live data and fire notifications via email, webhook, or custom actions, with full server snapshots attached showing every running process, network connection, and resource utilization at the moment of detection. Failed jobs and alerts automatically create tickets with linked logs, metrics history, and context for end-to-end incident tracking. The plugin marketplace supports extensions written in any language, and the Docker plugin enables container-based job execution. Deploy via Docker with persistent volumes on port 5522 for the web UI and 5523 for API access, running on a dedicated VPS on RepoCloud with guaranteed CPU, RAM, and SSD, full root SSH access, and a browser serial console. BSD-3-Clause licensed.
Apache HertzBeat
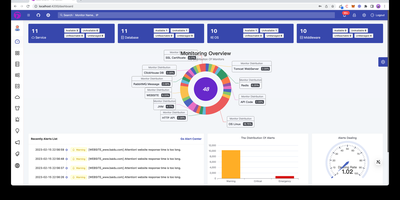
Instead of deploying proprietary background agents across dozens of target nodes, engineers rely on Apache HertzBeat to monitor real-time infrastructure health, metrics gathering, threshold alerting, and public status pages from a central operations platform. Operations teams can poll hundreds of target services without deploying proprietary background daemons, gathering performance data across Linux hosts, Kubernetes clusters, SQL databases, and network switches using native connection protocols. Engineers can define custom monitoring targets directly within the web dashboard by composing declarative YAML templates that specify polling intervals, parsing expressions, and metric extraction rules. The centralized alert engine processes inbound threshold events, suppresses cascading alert storms during maintenance windows, and dispatches actionable incident notifications to Discord channels, Slack rooms, Telegram groups, and webhook endpoints. Telemetry streams flow into interactive charts with customizable refresh cadences, enabling site reliability engineers to inspect latency waterfalls, correlate log spikes against CPU exhaustion, and track disk capacity trends over extended timeframes. Administrators can also publish real-time public status pages that inform external stakeholders about service availability, scheduled downtime, and ongoing incident resolutions. Running on a dedicated VPS on RepoCloud with guaranteed CPU, RAM, and SSD, full root SSH access, and a browser serial console. Apache 2.0 licensed.
Huginn
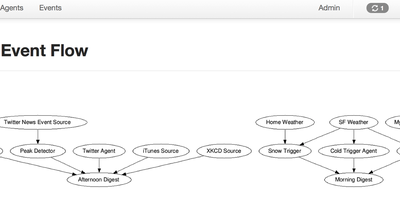
Huginn has established itself as the definitive open-source automation engine for developers who refuse to hand their workflow data to third-party cloud services. The platform lets you build agents that scrape websites, monitor RSS feeds, track weather via APIs, watch Twitter streams, aggregate news, detect price changes, and trigger notifications through email, SMS via Twilio, Slack webhooks, or social media posts to Twitter and Tumblr. Each agent creates and consumes JSON events, propagating them along a directed graph where complex multi-step workflows emerge from simple single-purpose components. The web interface provides visual agent management with drag-and-drop scenario building, real-time event logs, scheduling controls, and a built-in agent library covering dozens of use cases out of the box. Huginn supports Liquid templating for dynamic event transformation, regex-based content extraction, JavaScript-based data manipulation, and HumanTaskAgent for crowd-sourced workflow steps. Custom agents can be packaged as Ruby gems and loaded via the ADDITIONAL_GEMS environment variable without modifying core code. Deployment options include Docker with the official huginn/huginn all-in-one image or huginn/huginn-single-process for production multi-container setups with PostgreSQL or MySQL backends, plus native support for Heroku and OpenShift PaaS platforms. Running on a dedicated VPS on RepoCloud with guaranteed CPU, RAM, and SSD, full root SSH access, and a browser serial console. MIT licensed.
IRONSIGHT
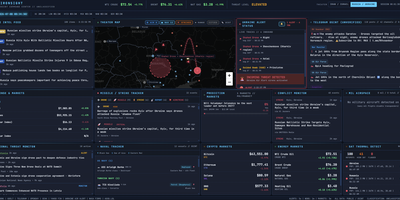
IRONSIGHT fuses over 50 publicly available intelligence sources into a single real-time dashboard that requires zero API keys and zero configuration. The Live Intel Feed aggregates 20+ RSS news sources with keyword relevance filtering from outlets including Reuters, Al Jazeera, and Kyiv Post. The Telegram OSINT module scrapes 27 channels every 60 seconds with automatic translation from Hebrew, Arabic, and Farsi. The interactive Leaflet Theater Map plots military aircraft positions via ADS-B transponder data, naval vessel locations in the Persian Gulf and Eastern Mediterranean, strike markers extracted from news and Telegram, missile trajectory arcs with range rings, and country-border overlays with a distance measurement tool. A header toggle switches the entire dashboard between Iran/Israel and Russia/Ukraine theaters, re-pointing every panel, map layer, and data feed to the selected conflict. The Israel Alert module streams live Pikud HaOref missile alerts with audio notifications, while the Conflict Monitor categorizes events into strikes, defense, diplomatic, and nuclear. Financial panels track defense contractor stocks, S&P 500, VIX, gold, Bitcoin, Ethereum, energy commodities via Yahoo Finance, and Polymarket prediction odds on conflict outcomes. NASA FIRMS satellite thermal detection flags fire and explosion signatures. The Next.js 16 App Router handles server-side data fetching for RSS and API endpoints while client-side React state management drives real-time polling updates. On RepoCloud, deploy IRONSIGHT on a dedicated VPS with persistent storage, root SSH access, and full control over your intelligence monitoring environment, all under the MIT license.
Graylog
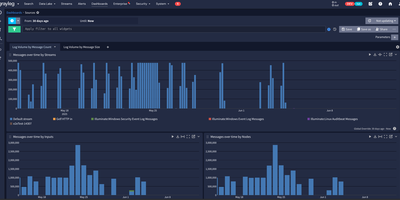
Trusted by over 60,000 organizations worldwide with more than 8,100 GitHub stars since 2010, Graylog has established itself as one of the fastest paths from raw log data to operational visibility, delivering centralized log management, security analytics, and compliance auditing through a purpose-built web interface with sub-second search at scale. The platform ingests logs from virtually any source via syslog, GELF, Beats, raw TCP/UDP, HTTP, CEF, IPFIX, and Netflow protocols, processing each message through configurable pipelines that parse fields, apply transformations, enrich events with GeoIP data from MaxMind or IPinfo lookup tables, and route messages to appropriate streams based on content rules. OpenSearch handles full-text indexing and storage with dynamic shard sizing that automatically calculates appropriate sizes from available node memory, while MongoDB stores configuration metadata including user accounts, roles, dashboards, alert rules, and pipeline definitions. The alerting system integrates with Slack, PagerDuty, and email with customizable notification templates and Replay Search links for immediate investigation context. Version 7.0 introduced MCP server integration for connecting preferred LLMs to perform AI-assisted log analysis and automation, while version 7.1 added Sigma detection rule import from private GitHub, GitLab, and Bitbucket repositories for detection-as-code workflows. The Sidecar agent management system centrally configures and deploys Filebeat, Winlogbeat, and nxlog collectors across infrastructure from the Graylog web interface. Running on a dedicated VPS on RepoCloud with guaranteed CPU, RAM, and SSD, full root SSH access, and a browser serial console. SSPL licensed.
Web-Check
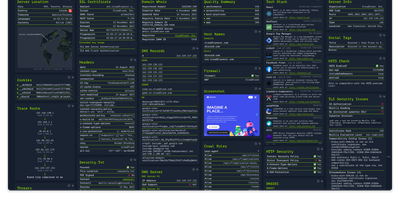
Enter a URL and get a dashboard of everything publicly discoverable about its security posture, server architecture, and technology stack: Web-Check is an all-in-one OSINT tool for analyzing any website. One scan surfaces IP info and server location, the full SSL certificate chain with issuing authority and validity, DNS records (A, MX, NS, CNAME, TXT) with DNSSEC status, HTTP response headers interpreted for security directives like HSTS, CSP, and X-Frame-Options, cookies and their flags, WHOIS domain info, robots.txt crawl rules, a sitemap-derived page map, the redirect ledger, open ports, traceroute, detected technologies, third-party trackers, associated hostnames, site performance, and even carbon footprint. Each card explains what the data means and why it matters, which makes the tool double as a security education resource - junior engineers learn headers and attack surfaces by scanning real sites. Practical uses span pre-deployment security audits (catch missing headers and misconfigurations before they ship), privacy compliance checks (identify trackers and cookie behavior for GDPR work), competitive tech-stack research, and network debugging via DNS and redirect inspection. Built by Lissy93 in TypeScript, it deploys as a single Docker container, and self-hosting keeps your reconnaissance targets and audit activity off third-party services.
Temps
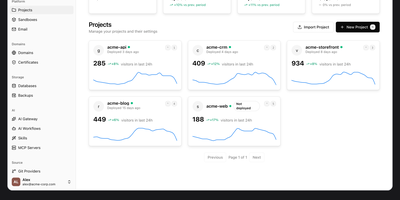
Consolidate application hosting, web analytics, error tracking, and performance monitoring into Temps, an open-source developer platform that replaces disparate SaaS subscriptions with a single compiled Rust binary. Engineering teams deploy full-stack web applications, background daemons, and microservices directly from Git repositories with automated TLS certificate provisioning powered by an embedded Cloudflare Pingora reverse proxy. The centralized web console unifies real-time visitor analytics, conversion funnels, and rrweb-powered session replay recordings without third-party tracking scripts. Integrated error monitoring ingests runtime exceptions with full stack traces and source map resolution, while continuous health checks evaluate container CPU utilization, memory thresholds, and network throughput across custom alerting rules. Developers manage infrastructure through an extensive command line interface containing over 440 operations across 69 command groups, or deploy drop-in skill files that allow AI coding assistants like Claude Code and Codex to provision preview environments autonomously. The platform also provides serverless key-value storage, S3-compatible blob buckets, and native transactional email routing with custom DKIM validation. Running on a dedicated VPS on RepoCloud with guaranteed CPU, RAM, and SSD, full root SSH access, and a browser serial console. Apache 2.0 licensed.
OneUptime
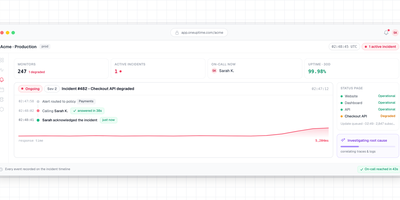
With 7,400+ GitHub stars and a feature set that replaces seven separate SaaS subscriptions — Pingdom for monitoring, StatusPage.io for status pages, PagerDuty for on-call, Incident.io for incident management, Datadog for APM, Loggly for logs, and Sentry for error tracking — OneUptime delivers every tool your reliability team needs in a single open-source platform that is genuinely 100% open source under Apache 2.0 (not open-core). Uptime monitoring runs synthetic checks against websites, APIs, ports, SSL certificates, and DNS records from distributed global probes with configurable intervals and thresholds. Branded status pages publish automatically when monitors detect issues, notifying subscribers via email, SMS, webhook, or RSS without manual intervention during an outage. On-call scheduling routes alerts through escalation policies to the right engineer via phone call, SMS, push notification, Slack, or Microsoft Teams. The incident management workflow handles declaration, triage, communication, resolution, and post-mortem generation in a unified timeline. APM collects traces and metrics via native OpenTelemetry integration — no proprietary agents required — while log management provides full-text search and alerting. An AI agent continuously monitors telemetry data, identifies root causes, and opens GitHub pull requests with proposed fixes for review. Deploy via Docker Compose or Kubernetes Helm charts with a Terraform provider for infrastructure-as-code configuration. Running on a dedicated VPS on RepoCloud with guaranteed CPU, RAM, and SSD, full root SSH access, and a browser serial console. Apache-2.0 licensed.
OpenReplay
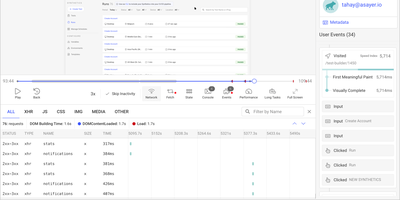
Backed by 12,400+ GitHub stars and positioned as the self-hosted alternative to FullStory and Hotjar, OpenReplay delivers the open-source session replay platform that keeps every byte of user behavior data on your own infrastructure. The JavaScript tracker captures pixel-perfect recordings of clicks, scrolls, form inputs, and navigation with automatic sensitive data masking, while simultaneously logging network requests, console errors, JavaScript exceptions, and Redux, VueX, MobX, NgRx, Pinia, and Zustand store state changes for complete technical context. DevTools mode reconstructs each session with full stack traces, GraphQL queries from Apollo and Relay, Fetch and Axios request payloads, CPU and memory metrics, and page speed waterfall charts — effectively giving developers a browser inspector tied to any user session. Product analytics surfaces conversion funnels, user journeys, click heatmaps, web vitals trends, and retention cohorts without requiring custom instrumentation. Co-browsing connects support agents to live user sessions with cursor control and WebRTC audio, enabling real-time assistance without third-party screen-sharing software. Integrations push session context into Sentry, Datadog, CloudWatch, Stackdriver, and Elastic for front-to-back debugging. Feature flags enable gradual rollouts with session-level targeting. The platform deploys to any cloud via Docker and Kubernetes with auto-scaling ingestion handling up to 50,000 sessions per month on the open-source edition. Running on a dedicated VPS on RepoCloud with guaranteed CPU, RAM, and SSD, full root SSH access, and a browser serial console. AGPLv3 licensed.
Pythia
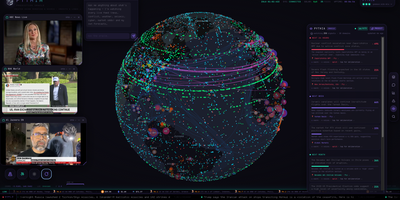
With over 400 GitHub stars and growing, Pythia transforms a local LLM into a self-calibrating geopolitical oracle that watches the entire planet and predicts what happens next — no API keys, no cloud, no cost. The Osiris-based Three.js globe frontend streams 30+ concurrent live feeds including GDELT geopolitics, armed conflict events, USGS earthquakes, NWS storm polygons, EONET disasters, FIRMS wildfires, Polymarket crowd odds, cryptocurrency and commodity prices, UNHCR displacement data, WHO disease outbreaks, and WFP food insecurity indicators. The FastAPI backend fuses these heterogeneous sources into a unified world brief, pipes it through Ollama, and generates located predictions across 24-hour, weekly, monthly, and yearly horizons — each carrying a probability, reasoning, and geocoordinates that fly the globe to the event. A council of four specialist swarm agents — Strategist, Economist, Naturalist, and Skeptic — re-scores every forecast, surfacing consensus, dissent, and splits through Brier-weighted voting where historically accurate personas earn louder votes. The engine maintains a persistent ledger graded by an LLM judge against archived world state, producing running Brier scores and calibration charts. Signal rules fire browser notifications and webhooks when conditions match, a morning brief digest summarizes overnight changes, and the agent API at port 8088 delivers the complete world view in a single JSON call compressed to approximately 50 tokens for AI agent consumption. Running on a dedicated VPS on RepoCloud with guaranteed CPU, RAM, and SSD, full root SSH access, and a browser serial console. MIT licensed.